. 2023 Jul:499:10-21.
doi: 10.1016/j.ydbio.2023.04.001. Epub 2023 Apr 14.

Aberrant differentiation of second heart field mesoderm prefigures cellular defects in the outflow tract in response to loss of FGF8

Affiliations

Aberrant differentiation of second heart field mesoderm prefigures cellular defects in the outflow tract in response to loss of FGF8

Sophie Astrof et al. Dev Biol. 2023 Jul.

Abstract

Development of the outflow tract of the heart requires specification, proliferation and deployment of a progenitor cell population from the second heart field to generate the myocardium at the arterial pole of the heart. Disruption of these processes leads to lethal defects in rotation and septation of the outflow tract. We previously showed that Fibroblast Growth Factor 8 (FGF8) directs a signaling cascade in the second heart field that regulates critical aspects of OFT morphogenesis. Here we show that in addition to the survival and proliferation cues previously described, FGF8 provides instructive and patterning information to OFT myocardial cells and their progenitors that prevents their aberrant differentiation along a working myocardial program.


Figures

Figure 1.
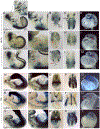
Figure 1.. Loss of FGF8 results in abnormal cellular organization of the embryonic outflow tract myocardium.
A, B) Bright field 20X images of H&E-stained transverse sections through the outflow tract of e10.5 control and Fgf8 mutant embryos; genotypes are indicated at top. Orientation is right at top, left at bottom; proximal OFT on left, distal OFT on right. Hearts were relaxed with verapamil at time of harvest. Double ended black arrow is 150 microns in both A and B and highlights paucity of cushion jelly and mesenchymal cells in the mutant. Arrowheads in A highlight smooth epithelial organization of myocardium while arrows in B highlight disorganized myocardium with out-of-plane cells. C-F) Dark field images of the OFT walls of additional embryos showing rounded, out of plane myocardial cells in mutants and reproducibility of findings shown in A and B. C and D are right OFT walls, E and F are left walls. Scale bars are 10 microns. G-J) Confocal images of sagittal sections through the myocardium of the distal OFT stained for DNA (DAPI, blue), β-catenin (green, G, I) and filamentous actin (H, J). Scale bars are 10 microns. Note aligned, parallel actin stained fibers in H, while arrows in J denote pericellular actin staining and arrowheads highlight disorganized cytoplasmic staining in the mutant OFT. myo, myocardium; endo, outflow tract endothelium; mes, outflow tract mesenchyme in the endocardial cushions consisting of cardiac jelly and EMT-derived mesenchymal cells; p, pericardium.
Figure 2.
Figure 2.. Loss of FGF8 disrupts basement membrane deposition, cell polarity and cellular organization in the SHF and OFT.
A-J’) Confocal images of sagittal sections through the OFT, transition zone/SHF of control (A-E’) and Fgf8 mutant (F-J’) E9.5 embryos. DNA is stained with DAPI (orange). Immunohistochemistry was used to detect fibronectin (blue), and Integrin α5 (pink). Arrowheads in E’ highlight fibronectin and Itgα5 normally assembled and adjacent in the OFT basement membrane (basal surface); arrows in J’ in the mutant highlight Itgα5 aberrantly localized throughout the cell membrane, independent of fibronectin, which is decreased. Scale bars are 50 μM in A and F and 20 μM in all other panels. B-E and F-J are digital zoom images of the boxed areas in A and H. E’ and J’ are digital zoom images of the boxed areas in E and J. Images are representative of ≥ 3 embryos. OFT, distal outflow tract lumen; a, right atrium; TZ, transition zone; SHF, second heart field; endo, endoderm; myo, myocardium K-R’) Confocal images of sagittal sections through the OFT and SHF of control (K-N’) and Fgf8 mutant (O-R’) E9.5 embryos. Immunohistochemistry was used to detect Itgβ1 (blue) and β-catenin (grayscale). DNA is stained with DAPI (orange). Arrowheads in M’ and N’ indicate normal localization of Itgβ1 in basement membrane (basal surface) of control OFT myocardium and of β-catenin predominantly localized in discrete adhesions, respectively. Arrows in Q’ and R’ highlight aberrantly localized Itgβ1 and β-catenin surrounding and at the apical surfaces of cells of the OFT and TZ. The intensity of β-catenin staining is increased in these regions relative to control. Scale bars are 50 μM in K and O and 20 μM in all other panels. K and O are 20X magnifications; all others are digital zoom images as indicated. Results are representative of ≥ 3 embryos. S-Z’) Confocal images of sagittal sections through the OFT and SHF of control (S-V’) and Fgf8 mutant (W-Z’) E9.5 embryos. Immunohistochemistry was used to detect the apical marker podocalyxin (blue) and Isl1 (pink). DNA is stained with DAPI (orange). Arrowheads in V’ highlight sharp apical localization of podocalyxin along the myocardium of the OFT, TZ and SHF. Arrows in J indicate abnormal clusters of disorganized mesoderm cells with pericellular podocalyxin staining. S and W are 20X magnifications; all others are digital zoom images of the boxed areas in S and W.
Figure 3.
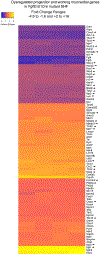
Figure 3.. The outflow tract myocardium in Fgf8 mutants has an abnormal working myocardial transcriptional profile.
A) Right lateral view of E9.5 embryo hearts with segments of heart labeled and color key PA1, pharyngeal arch 1 a, right atrium; OFT, outflow tract (d, distal p, proximal); RV right ventricle; LV left ventricle B-F) Schematics of patterns of transcript levels in different heart segments colored from high (pale yellow) to low (black). Schematics are shown adjacent to graphs quantitating transcript levels from representative transcripts in that class. C) qRT-PCR control reveals a pattern of high expression in the distal OFT relative to all other segments for transcript levels of Baalc, Sema3c, Tnc, and Bmp4 relative to HPRT. D) qRT-PCR reveals a pattern in this group highest in distal OFT, graded to proximal OFT with increased levels in the proximal OFT and ventricles compared to group C for Tbx3, Wnt11, Tbx2 and Igfbp5 transcripts. E) qRT-PCR results of transcript levels of WT1, Tbx18, Irx4 show pattern in which distal OFT has low expression levels, proximal OFT next and levels in the RV and LV are higher and comparable to one another. F) qRT-PCR results of transcript levels of Otx2, Bmp10, Gja5 and Nppa relative to HPRT control. The pattern in this group is highest in LV, lower in RV and minimally expressed in either segment of the OFT. G) Heat map of fold change values for significantly dysregulated OFT and chamber/working myocardial genes in microdissected OFTs of Fgf8 mutants relative to controls. The range of values was −5.1 to −1.5 for downregulated genes and +1.5 to +5.1 for the upregulated genes. Note levels for working myocardial genes are increased (yellow shades) in the mutant OFT while OFT/nonworking markers are decreased.
Figure 4.
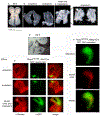
Figure 4.. Expression of the 96-16 and T55 SHF subregion transgenic reporters is altered in Fgf8 mutants.
Images show whole mount and dissected E9.5 embryos after staining for β-galactosidase activity driven by the 96-16 (A-M) and T55 (N-Y) transgenes. Genotypes are indicated at lower left of first panel in each row. A/ A’, F/F’, J/J’, N/N’, R/R’ and V/V’ are right lateral views; scale bars for these images are shown in lower right of panel A and A’. Red arrowheads in F’, J’ and R’ highlight decreased lacZ staining in OFT and SHF. B, G, K, O, S and W show caudal portion of body after transverse dissection through the second pharyngeal arch as in the diagram to the top of panel A. The view of these panels is from the vantage indicated by black arrowhead labeled B in the diagram. The neural tube (nt) is at top of the image; embryo’s right is on the left. Red arrowheads in G, K and S highlight decreased staining in OFT. C, H, L, P, T, and X are images of the embryo body after removal of the heart in plane indicated in diagram viewed in direction indicated by black arrowhead labeled C in diagram. D, I, M, Q, U and Y are images of dissected heart/OFT from the vantage indicated by arrowhead labeled D in diagram. The ventral aspect of the heart is at top. LA, left atrium; RA, right atrium
Figure 5.
Figure 5.. Microdissection and separation of pharyngeal tissue layers, including SHF.
A-C) Illustration of microdissection performed on an E8.5 embryo. Scale bar 500 μM. D) Right sided view of whole mount E9.5 wild type embryo. HT, Heart; pharyngeal arches 1 and 2 are labeled; ht, heart. E) Microdissection of tissue layers in Wnt1Cre; Rosa mTmG E9.5 embryos to label neural crest green. Scale bar 250 μM. F) Microdissection of SHF/second pharyngeal arch in Mesp1Cre; Rosa mTmG E9.5 embryos to label mesoderm green. Note residual neural crest in dissected region in red. Scale bar 250 μM. 2, pharyngeal arch 2
Figure 6.
Figure 6.. Outflow tract progenitors in the second heart field aberrantly express working myocardial transcripts and proteins in the absence of FGF8.
A) Heatmap of log2 fold change values of significantly dysregulated myocardial and progenitor genes in SHF microdissected from Fgf8 mutants compared to controls. The range of Log2 values is +0.51 to +4.3 (1.5 to 19.6 fold) for the upregulated genes and −2.3 to −0.51 and (−4.9 to −1.5 fold) for the downregulated genes. Black arrowheads at left denote transcripts that were similarly dysregulated in mutant OFT. B-G) Immunofluorescence detection of Titin and MF-20 in sagittal sections through the outflow tract and second heart field of E9.5 controls (B, D, F) and Fgf8 mutants (C, E, G) and Titin is in blue, MF-20 in pink and DAPI in orange. D-F show high magnification views of the TZ/SHF. Arrows point out minimal-to-no signal for either marker in the TZ/SHF of the control and presence of signal in this region in the mutants. RA, right atrium; OFT, outflow tract; RV, right ventricle; TZ/SHF, transition zone/second heart field

Similar articles

Cited by

References

    1. Ai D, Fu X, Wang J, Lu MF, Chen L, Baldini A, Klein WH, Martin JF, 2007. Canonical Wnt signaling functions in second heart field to promote right ventricular growth. Proc Natl Acad Sci U S A 104, 9319–9324. - PMC - PubMed
    1. Bajolle F, Zaffran S, Kelly RG, Hadchouel J, Bonnet D, Brown NA, Buckingham ME, 2006. Rotation of the myocardial wall of the outflow tract is implicated in the normal positioning of the great arteries. Circ Res 98, 421–428. - PubMed
    1. Bajolle F, Zaffran S, Meilhac SM, Dandonneau M, Chang T, Kelly RG, Buckingham ME, 2008. Myocardium at the base of the aorta and pulmonary trunk is prefigured in the outflow tract of the heart and in subdomains of the second heart field. Dev Biol 313, 25–34. - PubMed
    1. Bartram U, Molin DG, Wisse LJ, Mohamad A, Sanford LP, Doetschman T, Speer CP, Poelmann RE, Gittenberger-de Groot AC, 2001. Double-outlet right ventricle and overriding tricuspid valve reflect disturbances of looping, myocardialization, endocardial cushion differentiation, and apoptosis in TGF-beta(2)-knockout mice. Circulation 103, 2745–2752. - PubMed
    1. Biben C, Hatzistavrou T, Harvey RP, 1998. Expression of NK-2 class homeobox gene Nkx2–6 in foregut endoderm and heart. Mech Dev 73, 125–127. - PubMed

Publication types

Substances

LinkOut - more resources