. 2023 Jun;299(6):104708.
doi: 10.1016/j.jbc.2023.104708. Epub 2023 Apr 14.

Mitochondrial membrane potential instability on reperfusion after ischemia does not depend on mitochondrial Ca2+ uptake

Affiliations

Mitochondrial membrane potential instability on reperfusion after ischemia does not depend on mitochondrial Ca2+ uptake

Deepthi Ashok et al. J Biol Chem. 2023 Jun.

Abstract

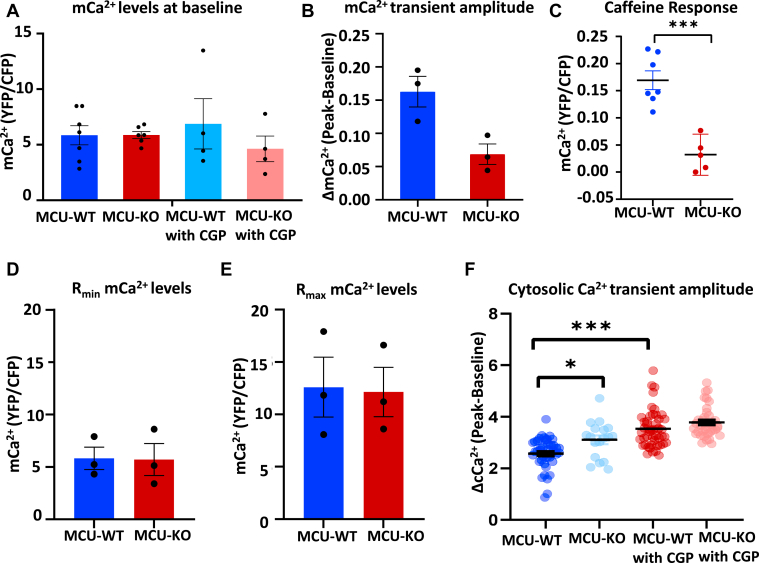
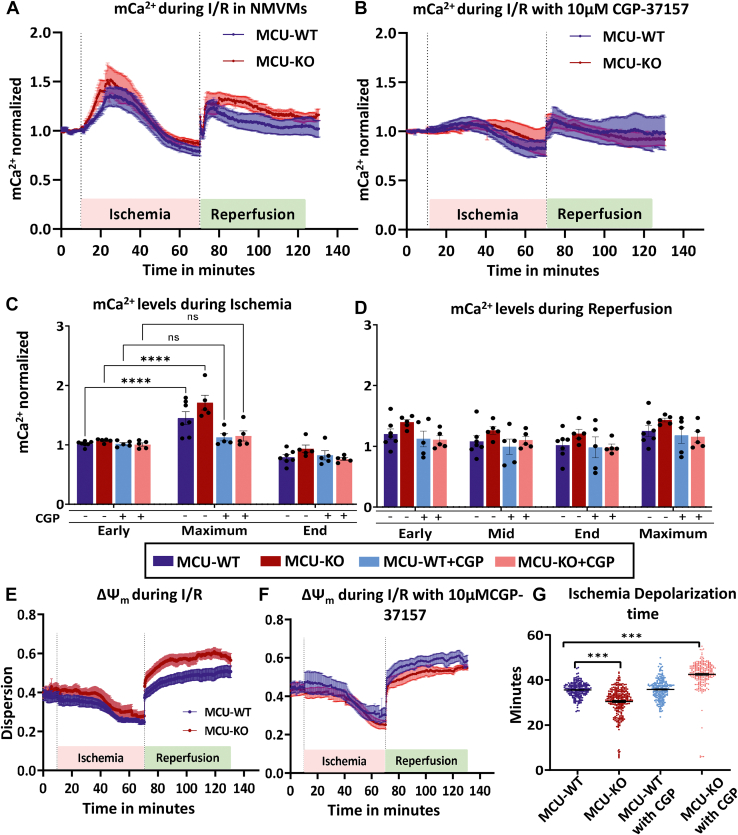
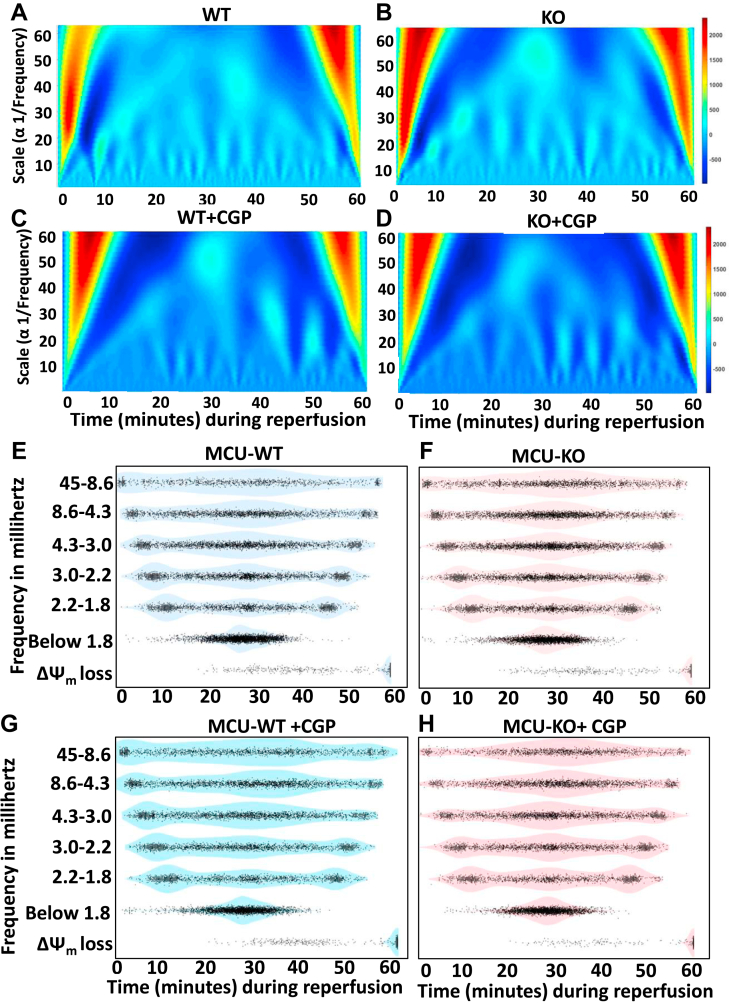
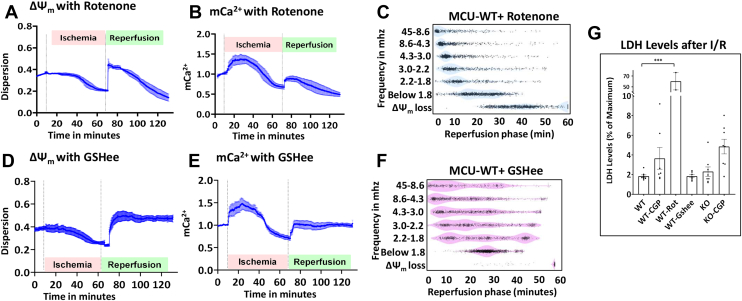
Physiologic Ca2+ entry via the Mitochondrial Calcium Uniporter (MCU) participates in energetic adaption to workload but may also contribute to cell death during ischemia/reperfusion (I/R) injury. The MCU has been identified as the primary mode of Ca2+ import into mitochondria. Several groups have tested the hypothesis that Ca2+ import via MCU is detrimental during I/R injury using genetically-engineered mouse models, yet the results from these studies are inconclusive. Furthermore, mitochondria exhibit unstable or oscillatory membrane potentials (ΔΨm) when subjected to stress, such as during I/R, but it is unclear if the primary trigger is an excess influx of mitochondrial Ca2+ (mCa2+), reactive oxygen species (ROS) accumulation, or other factors. Here, we critically examine whether MCU-mediated mitochondrial Ca2+ uptake during I/R is involved in ΔΨm instability, or sustained mitochondrial depolarization, during reperfusion by acutely knocking out MCU in neonatal mouse ventricular myocyte (NMVM) monolayers subjected to simulated I/R. Unexpectedly, we find that MCU knockout does not significantly alter mCa2+ import during I/R, nor does it affect ΔΨm recovery during reperfusion. In contrast, blocking the mitochondrial sodium-calcium exchanger (mNCE) suppressed the mCa2+ increase during Ischemia but did not affect ΔΨm recovery or the frequency of ΔΨm oscillations during reperfusion, indicating that mitochondrial ΔΨm instability on reperfusion is not triggered by mCa2+. Interestingly, inhibition of mitochondrial electron transport or supplementation with antioxidants stabilized I/R-induced ΔΨm oscillations. The findings are consistent with mCa2+ overload being mediated by reverse-mode mNCE activity and supporting ROS-induced ROS release as the primary trigger of ΔΨm instability during reperfusion injury.

Keywords: image processing; ischemia; mitochondrial membrane potential; oscillation; oxidative phosphorylation; reperfusion; time-series analysis; wavelet.


Conflict of interest statement

Conflict of interests The authors declare no conflict of interest with the contents of this article.

Figures

Figure 1
Figure 1
Methods and Protocol.A, In vitro ischemia and reperfusion protocol on monolayers of neonatal mouse ventricular myocytes (NMVMs). B, Representative cellular response during baseline, ischemia, and reperfusion. mitochondrial membrane potential (ΔΨm) and mitochondrial Ca2+ were monitored with TMRM and the genetically encoded MitoCam (4mtd3cpv) FRET probe, respectively. TMRM fluorescence was excited at 561 nm and emission was collected from 570 to 620 nm. For MitoCam, CFP was excited at 445 nm and emission was collected at 480 nm. The FRET signal (YFP) was collected at 560 nm. The ratio of the FRET signal to CFP after background subtraction indicated mCa2+ levels. C, NMVMs from MCUfl/fl mice were transduced with adenovirus expressing Cre-recombinase (Ad-Cre) or βgal (Ad-βgal) control virus. Left panel: 80% reduction in MCU protein (expected molecular weight of 30 kDa) observed on the fifth day after viral transduction in Ad-Cre treated cells. Right Panel: Ponceau stained loading control. D, Quantification of MCU protein from western blots (n = 6). MCU, mitochondrial calcium uniporter.
Figure 2
Figure 2
MCU is required for rapid Ca2+uptake into mitochondria.A, mCa2+ levels at baseline in Neonatal Mouse Ventricular Myocytes using the MitoCam probe. mCa2+ levels are represented as a ratio of the FRET signal (YFP) to CFP. Baseline mCa2+ for MCU-WT, MCU-KO, as well as MCU-WT or MCU-KO in the presence of CGP-37157 (CGP; 10 μM). B, mCa2+ transient amplitude in unstimulated cells in MCU-WT and KO. C, mCa2+ uptake measured when SR-Ca2+ is released by caffeine in the presence of 0 mM Na+ (Welch’s t test, WT= 7, KO= 5 cells). D and E, Rmin and Rmax levels for MitoCam signal in both groups. F, Cytosolic Ca2+ transients measured using Fura-2, with and without CGP. N > 18 cells (Kruskal Wallis non-parametric test, with Dunn’s Multiple comparison). Experiments (and calibrations) were repeated at least 3 times. Mean ± SEM is shown. KO, knockout; MCU, mitochondrial calcium uniporter; WT, wild type.
Figure 3
Figure 3
MCU knockout does not affect mitochondrial Ca2+import during Ischemia and Reperfusion but blocking mNCE prevents the rise in mCa2+during Ischemia.A, Mitochondrial Calcium monitored in Neonatal Mouse Ventricular Myocytes in control (MCU-WT) or knockout myocytes (MCU-KO) during 1 h of ischemia and 1 h of reperfusion. mCa2+ for each cell was quantified by obtaining the YFP/CFP ratio and normalizing to pre-ischemia baseline. B, mCa2+ in MCU-WT and MCU-KO cells in the presence of CGP-37157 (10 μM). C and D, Quantification of mCa2+ levels at different stages during Ischemia and Reperfusion. Number of experiments, WT(7), KO(6), WT+CGP(5), KO+CGP(5). Mean ± SEM are plotted. 2-way ANOVA was performed between treatments (∗∗∗p < 0.05). E, ΔΨm changes during I/R were assessed by measuring spatial TMRM signal Dispersion in each individual cell and then averaging the response for each experiment. ΔΨm in control MCU-WT (blue) and MCU-KO myocytes (red) throughout Ischemia/Reperfusion. F, ΔΨm response in MCU-WT and MCU-KO myocytes in the presence of CGP-37157 (10 μM) throughout Ischemia/Reperfusion. G,Time to ΔΨm depolarization during Ischemia in WT, KO and CGP-treated cells. SEM is indicated in F and G. KO, knockout; MCU, mitochondrial calcium uniporter; WT, wild type.
Figure 4
Figure 4
Mitochondrial oscillations persist when MCU is knocked out or with addition of CGP-37157. A–D, Representative scalograms of oscillating mitochondrial clusters in the 60-min reperfusion phase showing the presence of peak coefficients in the low scale range of 1–10 or high-frequency range corresponding to 45–8.6 and 8.6–4.3 mHz bands. Scalograms from mitochondrial clusters from WT, KO, WT+ CGP, and KO+ CGP treated cells are shown. They all show persistent oscillations in the 45–8.6 and 8.6–4.3 mHz bands. E–H, Violin dot plots showing the frequency distribution of oscillating clusters throughout the reperfusion phase determined by wavelet analysis for each experimental condition. Six frequency bands ranging from the fastest (45–8.6 mHz) to the slowest (Below 1.8 mHz) are shown. The time to irreversible ΔΨm depolarization is indicated as the lowest band. A, frequency distribution during reperfusion of oscillating mitochondrial clusters from WT cells (4093 mitochondrial clusters were analyzed from 7 different I/R of monolayers). B, frequency distribution from oscillating mitochondrial clusters from MCU-KO cells (3643 clusters from 6 different I/R of monolayers); C, from MCU-WT cells treated with CGP (3208 clusters from 5 different I/R of monolayers); D, MCU-KO cells treated with CGP (2977 clusters from 5 different I/R of monolayers were analyzed). KO, knockout; MCU, mitochondrial calcium uniporter; WT, wild type.
Figure 5
Figure 5
Inhibiting mitochondrial oxidative phosphorylation at complex I or increasing reduced glutathione stabilizes ΔΨm oscillations during reperfusion in MCU-WT cells.A, ΔΨm response with Rotenone (1 mM) added upon reperfusion. Inhibition of complex I facilitated ΔΨm stabilization during the first 20 min of reperfusion but increased sustained ΔΨm loss thereafter. B, mCa2+ recovery was blunted when Rotenone was added upon reperfusion. C, Violin dot plots representing frequency distribution oscillating mitochondrial clusters during reperfusion. The number of high-frequency oscillators (in the 45–8.6 and 8.6–4.3 mHz bands) was decreased by Rotenone over the first 20 min of reperfusion. Sustained ΔΨm loss began after 20 min of reperfusion as indicated by the increased density of points in the lowest band. Mean ± SEM are shown in the time course plots. Three different coverslips and 1685 clusters were analyzed for their oscillation patterns. D–F, Pre-treatment with the cell-permeable glutathione ethyl ester (GSHee; 4 mM) for 3 h did not affect the mean ΔΨm (D) or mCa2+ (E) responses during I/R, but GSHee mediated stabilization of high frequency oscillators (evident as a decreased density of points in the 4.3–45 mHz band and an increase in the Below 1.8 mHz band) by 20 to 40 min of reperfusion and prevented sustained ΔΨm loss (F). Four coverslip experiments with 2020 mitochondrial clusters analyzed for oscillatory patterns. G, LDH Assay as a measure of cytotoxicity at the end of Reperfusion after Ischemia. Supernatants were collected after reperfusion to measure Lactate Dehydrogenase levels. Positive control was supernatant from lysed NMVMs and was considered as 100% of LDH levels released (maximum). One-way ANOVA comparing WT with rotenone treatment showed significantly elevated levels of LDH at the end of I/R. WT comparisons with other samples were not significantly different. GSHee, reduced Glutathione; LDH, Lactate Dehydrogenase; MCU, mitochondrial calcium uniporter; NMVMs, neonatal mouse ventricular myocytes.
Figure 6
Figure 6
Redistribution of ΔΨmoscillation frequency during Reperfusion.A–D, Counts of mitochondrial clusters changing between fast (45–8.6 mHz; blue polygonal histogram) and slow frequencies (below 1.8 mHz; pink polygonal histogram) over the reperfusion time period with different treatments. Counts of mitochondrial clusters undergoing ΔΨm loss are also shown (green polygonal histogram). No significant differences were observed between MCU-WT, MCU-KO, and CGP treatment groups (G). E–F, with Rotenone treatment (E), the counts of fast oscillators decreased at 10 to 15-min time point while the count of slow oscillators increase. However, these mitochondria did not sustain ΔΨm, with irreversible depolarization starting at 15 min of reperfusion. With anti-oxidant glutathione ethyl ester (GSHEE) treatment (F), the number of fast oscillators decreased, starting around 15 min of reperfusion while the number of slow oscillators increased. ΔΨm loss occurred (if at all) only after 55 min of reperfusion. G, significant differences were observed between MCU-WT and GSHEE treatment and MCU-WT and Rotenone treatment. A non-parametric Kolmogorov–Smirnov test with alpha =0.001 was performed to test for significance. KO, knockout; MCU, mitochondrial calcium uniporter; WT, wild type.

Similar articles

Cited by

References

    1. Denton R.M. Regulation of mitochondrial dehydrogenases by calcium ions. Biochim. Biophys. Acta. 2009;1787:1309–1316. - PubMed
    1. Balaban R.S. The role of Ca(2+) signaling in the coordination of mitochondrial ATP production with cardiac work. Biochim. Biophys. Acta. 2009;1787:1334–1341. - PMC - PubMed
    1. Vygodina T., Kirichenko A., Konstantinov A.A. Direct regulation of cytochrome c oxidase by calcium ions. PLoS One. 2013;8 - PMC - PubMed
    1. Murphy E., Steenbergen C. Ion transport and energetics during cell death and protection. Physiology (Bethesda) 2008;23:115–123. - PMC - PubMed
    1. Kirichok Y., Krapivinsky G., Clapham D.E. The mitochondrial calcium uniporter is a highly selective ion channel. Nature. 2004;427:360–364. - PubMed

Publication types

LinkOut - more resources