. 2023 Aug;79(2):378-393.
doi: 10.1016/j.jhep.2023.03.041. Epub 2023 Apr 13.

HILPDA promotes NASH-driven HCC development by restraining intracellular fatty acid flux in hypoxia

Affiliations

HILPDA promotes NASH-driven HCC development by restraining intracellular fatty acid flux in hypoxia

Davide Povero et al. J Hepatol. 2023 Aug.

Abstract

Background & aims: The prevalence of non-alcoholic steatohepatitis (NASH)-driven hepatocellular carcinoma (HCC) is rising rapidly, yet its underlying mechanisms remain unclear. Herein, we aim to determine the role of hypoxia-inducible lipid droplet associated protein (HILPDA)/hypoxia-inducible gene 2 (HIG2), a selective inhibitor of intracellular lipolysis, in NASH-driven HCC.

Methods: The clinical significance of HILPDA was assessed in human NASH-driven HCC specimens by immunohistochemistry and transcriptomics analyses. The oncogenic effect of HILPDA was assessed in human HCC cells and in 3D epithelial spheroids upon exposure to free fatty acids and either normoxia or hypoxia. Lipidomics profiling of wild-type and HILPDA knockout HCC cells was assessed via shotgun and targeted approaches. Wild-type (Hilpdafl/fl) and hepatocyte-specific Hilpda knockout (HilpdaΔHep) mice were fed a Western diet and high sugar in drinking water while receiving carbon tetrachloride to induce NASH-driven HCC.

Results: In patients with NASH-driven HCC, upregulated HILPDA expression is strongly associated with poor survival. In oxygen-deprived and lipid-loaded culture conditions, HILPDA promotes viability of human hepatoma cells and growth of 3D epithelial spheroids. Lack of HILPDA triggered flux of polyunsaturated fatty acids to membrane phospholipids and of saturated fatty acids to ceramide synthesis, exacerbating lipid peroxidation and apoptosis in hypoxia. The apoptosis induced by HILPDA deficiency was reversed by pharmacological inhibition of ceramide synthesis. In our experimental mouse model of NASH-driven HCC, HilpdaΔHep exhibited reduced hepatic steatosis and tumorigenesis but increased oxidative stress in the liver. Single-cell analysis supports a dual role of hepatic HILPDA in protecting HCC cells and facilitating the establishment of a pro-tumorigenic immune microenvironment in NASH.

Conclusions: Hepatic HILPDA is a pivotal oncometabolic factor in the NASH liver microenvironment and represents a potential novel therapeutic target.

Impact and implications: Non-alcoholic steatohepatitis (NASH, chronic metabolic liver disease caused by buildup of fat, inflammation and damage in the liver) is emerging as the leading risk factor and the fastest growing cause of hepatocellular carcinoma (HCC), the most common form of liver cancer. While curative therapeutic options exist for HCC, it frequently presents at a late stage when such options are no longer effective and only systemic therapies are available. However, systemic therapies are still associated with poor efficacy and some side effects. In addition, no approved drugs are available for NASH. Therefore, understanding the underlying metabolic alterations occurring during NASH-driven HCC is key to identifying new cancer treatments that target the unique metabolic needs of cancer cells.

Keywords: HILPDA; Hepatocellular carcinoma; Hypoxia; Nonalcoholic steatohepatitis; lipid metabolism; lipidomics.


Conflict of interest statement

Conflict of interest

The authors declare no conflicts of interest that pertain to this work.

Please refer to the accompanying ICMJE disclosure forms for further details.

Figures

Fig. 1.
Fig. 1.. HILPDA is upregulated in human HCC and NASH-driven HCC.
(A) Bioinformatics analysis of HILPDA expression in human HCC tumor tissue and non-tumor tissues using TCGA’s LIHC cohort from cBioPortal and UCSC Xena browser. (B) Kaplan-Meier curve of survival of patients with HCC and high- vs. low-expression levels of HILPDA, as determined by TCGA data sets. (C) Hypoxia boxplot correlating HILPDA mRNA expression with hypoxia levels (moderate or severe) as determined using the Gene Ontology human response to hypoxia genes (n = 330). (D) 10X Genomics spatial gene distribution of HCC marker GLUL, HILPDA and HIF1A in human NASH-driven HCC tissue and paired adjacent non-cancerous tissue. (E) IHC analysis of HILPDA expression in 8 HCC samples and 4 normal livers. Representative images are shown. (F) RT-qPCR of HILPDA mRNA expression in human HCC tumor tissue and non-tumor tissues. 18S was used as a housekeeping gene. Data are presented as mean±SD. (A, C, F) Paired two-tailed Student’s t tests were used. Kaplan-Meier survival curve and the log-rank test were used. *p <0.05; **p <0.01; ***p <0.001; ****p <0.0001. GLUL, Glutamine Synthethase; HCC, Hepatocellular carcinoma; HIF1A, Hypoxia inducible factor 1alpha; HILPDA, Hypoxia-inducible lipid droplet associated protein; TCGA-LIHC, Cancer Genome Atlas Liver Hepatocellular Carcinoma; RT-qPCR, quantitative real-time polymerase chain reaction.
Fig. 2.
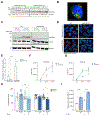
Fig. 2.. HILPDA promotes HCC cell growth and survival.
(A) Western blot analysis of HILPDA in Huh7 cells exposed to normoxia (21% O2) or hypoxia (0.5% O2) and with or without exogenous free FAs (150 μM) for 16 h. Relative protein quantification is indicated in red as fold-change for each experimental condition. β-actin was used as loading control. (B) Immunofluorescent analysis of HILPDA which localizes around LDs (red) in Huh7 cells exposed to hypoxia and oleic acid (150 μM) for 16 h. (C) Western blot analysis of HILPDA and ATGL in WT and HILPDA KO Huh7 cells exposed to normoxia (21% O2) or hypoxia (0.5% O2) and with or without OA (150 μM) for 16 h. β-actin was used as loading control. (D) Fluorescent-based imaging of neutral lipids stored in LDs (red) and identified using LipidTOX in WT and HILPDA KO Huh7 cells exposed to normoxia (21% O2) or hypoxia (0.5% O2) and with or without OA (150 μM) for 16 h. (E) Intracellular TG level (nmol/mg proteins) in WT and HILPDA KO Huh7 cells exposed to normoxia (21% O2) or hypoxia (0.5% O2) and with or without OA (150 μM) for 16 h. (F, G) Cell viability analysis of WT and HILPDA KO Huh7 cells exposed to normoxia (21% O2) or hypoxia (0.5% O2) for up to 48 h. (H) Proliferation assay in WT and HILPDA KO Huh7 cells exposed to normoxia (21% O2) or hypoxia (0.5% O2) and with or without 400 μM of FA mix (palmitic:oleic:linoleic acids) for up to 48 h. (I) Caspase 3/7 activity assay in WT and HILPDA KO Huh7 cells exposed to hypoxia (0.5% O2) and with or without 400 μM of FA mix (palmitic:oleic:linoleic acids) for 24 h. Data are means±SD. Paired two-tailed Student’s t tests were used. (H, I) Nonparametric Kruskal-Wallis ANOVA test was used. *p <0.05; **p <0.01; ***p <0.001; ****p <0.0001. FA, fatty acid; KO, knockout; L, linoleic acid; O, oleic acid; P, palmitic acid; Veh, vehicle (0.5% FA-free BSA); WT, wild-type.
Fig. 3.
Fig. 3.. HILPDA deletion disrupts lipid homeostasis and increases PUFA-enrichment in membrane phospholipids.
(A) Heatmap of lipid species in WT and HILPDA knockout Huh7 cells exposed to normoxia (21% O2) or hypoxia (0.5% O2) and 200 μM oleic acid for 24 h, analyzed by multidimensional mass spectrometry (MDMS)-based shotgun lipidomics (MDMS-SL). Values reported as percentage of total lipids in each species. (B–G) Levels of representative individual lipid species with polyunsaturated fatty acyl chains (C18:2, C18:3, C20:4) in WT and HILPDA KO Huh7 cells exposed to normoxia (21% O2) or hypoxia (0.5% O2) and 200 μM oleic acid for 24 h. (H–J) Levels of 14C-linoleic acid enrichment ratios in triglycerides, phosphatidylcholine and phosphatidylethanolamine in Huh7 cells treated with HILPDA siRNA (siHILPDA) or control siRNA (siControl) and exposed to normoxia (21% O2) or hypoxia (0.5% O2), 0.2 μCi/ml linoleic acid [1-14C] and 150 μM of cold linoleic acid for 24 h. Data are presented as mean±SD. (B-J) Non-parametric Kruskal-Wallis ANOVA test was used. *p <0.05; **p <0.01; ***p <0.001; ****p <0.0001. FA, fatty acid; KO, knockout; LPE, lysophosphatidylethanolamine; PC, phosphatidylcholine; PE, phosphatidylethanolamine; PG, phosphatidylglycerol; PS, phosphatidylserine; WT, wild-type.
Fig. 4.
Fig. 4.. HILPDA deficiency disrupts sphingolipid homeostasis leading to apoptosis of HCC cells.
(A) Heatmap of ceramide species in WT and HILPDA KO Huh7 cells exposed to normoxia (21% O2) or hypoxia (0.5% O2) and 200 μM oleic acid for 24 h, analyzed by multidimensional mass spectrometry-based shotgun lipidomics. (B) Levels of representative individual ceramide species in WT and HILPDA KO Huh7 cells exposed to normoxia (21% O2) or hypoxia (0.5% O2) and 200 μM oleic acid for 24 h. (C) Heatmap of sphingolipid species in Huh7 cells treated with HILPDA siRNA (siHILPDA) or control siRNA (siControl) and exposed to normoxia (21% O2) or hypoxia (0.5% O2) and 200 μM oleic acid for 24 h, analyzed by liquid chromatography tandem mass spectrometry. (D, E) Levels of representative individual sphingolipid species in in Huh7 cells treated with HILPDA siRNA (siHILPDA) or control siRNA (siControl) and exposed to normoxia (21% O2) or hypoxia (0.5% O2) and 200 μM oleic acid for 24 h. (F) RT-qPCR analyses of SPTLC1, CERS2 and CERS6 in WT and HILPDA KO Huh7 cells exposed to normoxia (21% O2) or hypoxia (0.5% O2) and 200 μM oleic acid for 24 h. 18S was used as a housekeeping gene. (G, H) Caspase 3/7 activity assay in WT and HILPDA KO Huh7 cells exposed to normoxia (21% O2) or hypoxia (0.5% O2) and 400 μM FA mix (palmitic:oleic:linoleic acids) for 24 h with or without 10 μM of FB1, 10 μM of Myr or vehicle control (0.1% DMSO). Data are presented as mean ± SD. (B, D–H) Non-parametric Kruskal-Wallis ANOVA test was used. *p <0.05; **p <0.01; ***p <0.001; ****p <0.0001. Cer, ceramide; KO, knockout; WT, wild-type.
Fig. 5.
Fig. 5.. HILPDA deletion leads to enrichment of PUFAs in cell membranes and leads to oxidative stress, lipid peroxidation and mitochondrial dysfunction.
(A) Representative fluorescence-based images and (B) quantitation of intracellular ROS levels detected by DCFDA assay in WT and HILPDA KO Huh7 cells exposed to normoxia (21% O2) or hypoxia (0.5% O2) and 300 μM FA mix (palmitic:oleic:linoleic acids) for 72 h. (C) Representative fluorescence-based images and (D) quantitation of membrane lipid peroxidation levels detected by linoleamide alkyne assay in WT and HILPDA KO Huh7 cells exposed to normoxia (21% O2) or hypoxia (0.5% O2) and 300 μM FA mix (palmitic:oleic:linoleic acids) for 72 h. (E) Intracellular levels of MDA in WT and HILPDA KO Huh7 cells exposed to normoxia (21% O2) or hypoxia (0.5% O2) and 300 μM FA mix (palmitic:oleic:linoleic acids) for 72 h. (F) Representative fluorescence-based images and (G) quantitation of mitochondrial membrane potential using MitoTracker Red CMXRos in WT and HILPDA KO Huh7 cells exposed to normoxia (21% O2) or hypoxia (0.5% O2) and 300 μM FA mix (palmitic:oleic:linoleic acids) for 72 h. (H) RT-qPCR analysis of ACSL5 mRNA expression in WT and HILPDA KO Huh7 cells exposed to normoxia (21% O2) or hypoxia (0.5% O2) and 300 μM FA mix (palmitic:oleic:linoleic acids) for 24 h. Data are presented as mean±SD. (B, D, E, G, H) Non-parametric Kruskal-Wallis ANOVA test was used. *p <0.05; **p <0.01; ***p <0.001; ****p <0.0001. KO, knockout; MDA, malondialdehyde; WT, wild-type.
Fig. 6.
Fig. 6.. HILPDA depletion arrests 3D HCC spheroids formation, size growth and survival.
(A) Scanning electron microscope imaging of 3D Huh7 epithelial spheroid. (B) Brightfield images of 3D Huh7 epithelial spheroid over 6 days in culture. (C) H&E staining of longitudinal section of formalin-fixed paraffin-embedded 3D Huh7 epithelial spheroid. (D) Procedural scheme of 3D Huh7 epithelial spheroid treatment with 400 μM of FA mix (palmitic:oleic:linoleic acids) and Image-iT hypoxia fluorescence-based reagent. (E) Fluorescence-based imaging of 3D Huh7 epithelial spheroid treated with 400 μM of FA mix (palmitic:oleic:linoleic acids) for 48 h. Hypoxic regions were detected with Image-iT hypoxia reagent, neutral lipids (red) with LipidTOX and cell nuclei (blue) with Hoechst33342 and imaged with Zeiss LSM980 with Airyscan 2. (F) Western blot analysis of HILPDA in wild-type (WT) and HILPDA KO 3D Huh7 epithelial spheroids. β-actin was used as loading control. (G) Brightfield images of WT and HILPDA KO 3D Huh7 epithelial spheroids. (H) IHC for HILPDA in wild-type (WT) and HILPDA KO 3D Huh7 epithelial spheroids. (I) Spheroid area (μm2) of WT and HILPDA KO 3D Huh7 epithelial spheroids over 6 days in culture. (J) Spheroid area (μm2) of WT and HILPDA KO 3D Huh7 epithelial spheroids after 2 weeks in culture. (K) Proliferation assay of WT and HILPDA KO 3D Huh7 epithelial spheroids after 72 h. (L) Transmission electron microscopy images of WT and HILPDA KO 3D Huh7 spheroid sections, where mitochondria have been pseudocolored. (M) Western blot analyses of pro-/active caspase-8 and pro-/active caspase3 in WT and HILPDA KO 3D Huh7 spheroids with or without 400 μM of FA mix (palmitic:oleic:linoleic acids). Relative protein quantification is indicated in red as fold-change for each experimental condition. β-actin was used as loading control. Data are means±SD. (J, K) Paired two-tailed Student’s t tests were used. *p <0.05; **p <0.01; ***p <0.001; ****p <0.0001. KO, knockout; WT, wild-type.
Fig. 7.
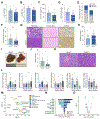
Fig. 7.. Hepatocyte-specific Hilpda knockout ameliorates liver steatosis and impedes NASH-driven HCC formation in vivo.
Hepatocyte-specific Hilpda knockout (HilpdaΔHep) and Hilpda-floxed control (Hilpdafl/fl) C57/B6 mice (n = 14 mice/group) were fed a Western diet plus sugar water and injected weekly with CCl4 intraperitoneally for 24 weeks. (A) Liver weight. (B) Liver/BW ratio. (C) Levels of hepatic triglycerides (mg/g liver). (D) NAFLD activity score and (E) individual scores for steatosis, ballooning, and inflammation in liver samples of indicated experimental groups. (F) Quantitation of picrosirius red staining for liver fibrosis in the indicated experimental groups. (G) H&E, Prussian blue staining (iron accumulation) and IHC for 8-OHdG (oxidative stress marker) in liver tissue for indicated experimental groups. (H) Quantitation of hepatic levels of 8-OHdG for indicated experimental groups. (I) Gross images of livers highlighting dysplastic nodules (yellow circles) in the indicated experimental groups. (J) Number of dysplastic nodules in each of the indicated experimental group. (K) Representative H&E staining of liver tissues for the indicated experimental groups. (L) RT-qPCR analyses of Gpc3, Cpt1, Fasn, Fth1, Oct4 and Sox2 mRNA expression in adjacent liver parenchyma and dysplastic nodules harvested from the indicated experimental groups. Hprt was used as a housekeeping gene. (M) UMAP plots of liver cell clusters identified by single-cell RNA-seq analysis in both experimental groups (n = 2 mice/group). (N) Relative cell count normalized on total count of each liver cell cluster in the indicated experimental groups. (O) Volcano plot of differentially expressed genes in HilpdaΔHep vs. Hilpdafl/fl T cells identified by single-cell RNA-seq analysis (n = 2 mice/group). Data are presented as mean ± SD. (A–D, F, G, J) Paired two-tailed Student’s t tests were used. (L) Non-parametric Kruskal-Wallis ANOVA test was used. (N) Two-proportions z-test was used. *p <0.05; **p <0.01; ***p <0.001; ****p <0.0001. BW, body weight; NAFLD, non-alcoholic fatty liver disease; NASH, non-alcoholic steatohepatitis; NK, natural killer; UMAP, uniform manifold approximation and projection.

Comment in

References

    1. Younossi ZM, Blissett D, Blissett R, Henry L, Stepanova M, Younossi Y, et al. The economic and clinical burden of nonalcoholic fatty liver disease in the United States and Europe. Hepatology 2016;64:1577–1586. - PubMed
    1. Loomba R, Sanyal AJ. The global NAFLD epidemic. Nat Rev Gastroenterol Hepatol 2013;10:686–690. - PubMed
    1. Adams LA, Lymp JF, St Sauver J, Sanderson SO, Lindor KD, Feldstein A, et al. The natural history of nonalcoholic fatty liver disease: a population-based cohort study. Gastroenterology 2005;129:113–121. - PubMed
    1. White DL, Kanwal F, El-Serag HB. Association between nonalcoholic fatty liver disease and risk for hepatocellular cancer, based on systematic review. Clin Gastroenterol Hepatol 2012;10:1342–1359 e1342. - PMC - PubMed
    1. Anstee QM, Reeves HL, Kotsiliti E, Govaere O, Heikenwalder M. From NASH to HCC: current concepts and future challenges. Nat Rev Gastroenterol Hepatol 2019;16:411–428. - PubMed

Publication types