

Timing of seasonal influenza epidemics for 25 countries in Africa during 2010-19: a retrospective analysis
- PMID: 37061311
- PMCID: PMC10126228
- DOI: 10.1016/S2214-109X(23)00109-2
Timing of seasonal influenza epidemics for 25 countries in Africa during 2010-19: a retrospective analysis
Abstract
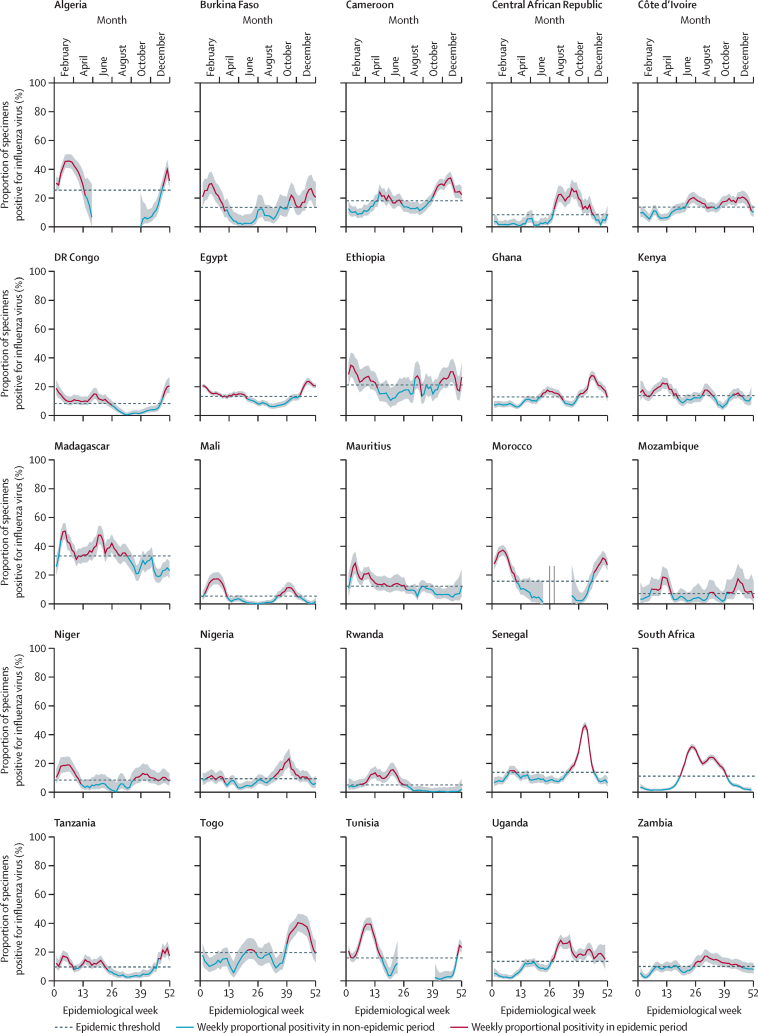
Background: Using country-specific surveillance data to describe influenza epidemic activity could inform decisions on the timing of influenza vaccination. We analysed surveillance data from African countries to characterise the timing of seasonal influenza epidemics to inform national vaccination strategies.
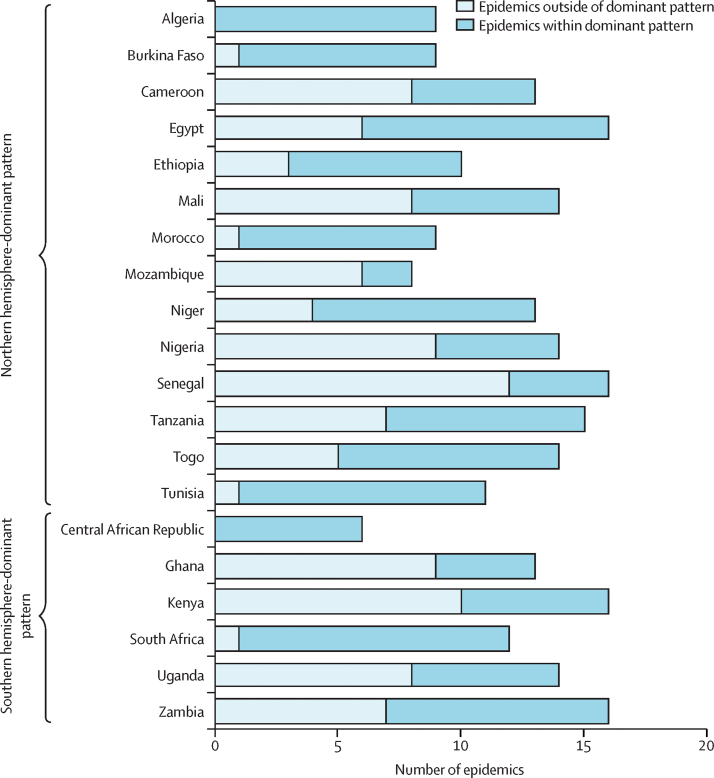
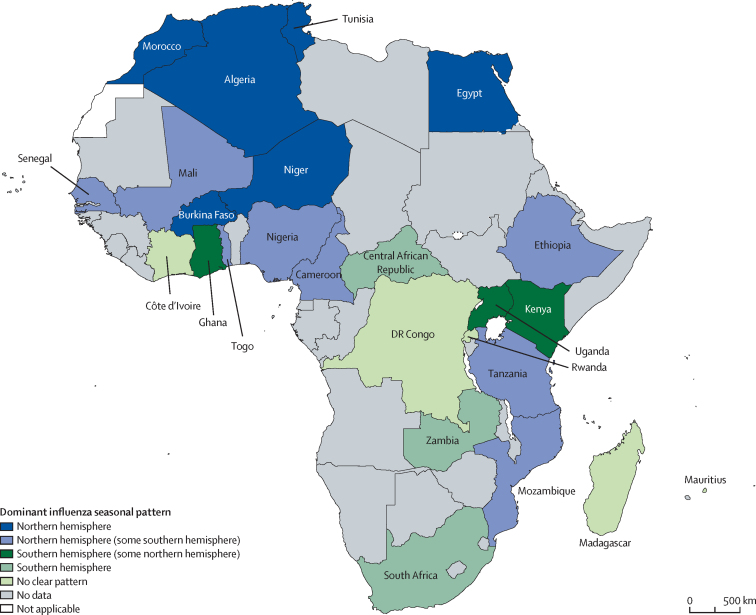
Methods: We used publicly available sentinel data from African countries reporting to the WHO Global Influenza Surveillance and Response FluNet platform that had 3-10 years of data collected during 2010-19. We calculated a 3-week moving proportion of samples positive for influenza virus and assessed epidemic timing using an aggregate average method. The start and end of each epidemic were defined as the first week when the proportion of positive samples exceeded or went below the annual mean, respectively, for at least 3 consecutive weeks. We categorised countries into five epidemic patterns: northern hemisphere-dominant, with epidemics occurring in October-March; southern hemisphere-dominant, with epidemics occurring in April-September; primarily northern hemisphere with some epidemic activity in southern hemisphere months; primarily southern hemisphere with some epidemic activity in northern hemisphere months; and year-round influenza transmission without a discernible northern hemisphere or southern hemisphere predominance (no clear pattern).
Findings: Of the 34 countries reporting data to FluNet, 25 had at least 3 years of data, representing 46% of the countries in Africa and 89% of Africa's population. Study countries reported RT-PCR respiratory virus results for a total of 503 609 specimens (median 12 971 [IQR 9607-20 960] per country-year), of which 74 001 (15%; median 2078 [IQR 1087-3008] per country-year) were positive for influenza viruses. 248 epidemics occurred across 236 country-years of data (median 10 [range 7-10] per country). Six (24%) countries had a northern hemisphere pattern (Algeria, Burkina Faso, Egypt, Morocco, Niger, and Tunisia). Eight (32%) had a primarily northern hemisphere pattern with some southern hemisphere epidemics (Cameroon, Ethiopia, Mali, Mozambique, Nigeria, Senegal, Tanzania, and Togo). Three (12%) had a primarily southern hemisphere pattern with some northern hemisphere epidemics (Ghana, Kenya, and Uganda). Three (12%) had a southern hemisphere pattern (Central African Republic, South Africa, and Zambia). Five (20%) had no clear pattern (Côte d'Ivoire, DR Congo, Madagascar, Mauritius, and Rwanda).
Interpretation: Most countries had identifiable influenza epidemic periods that could be used to inform authorities of non-seasonal and seasonal influenza activity, guide vaccine timing, and promote timely interventions.
Funding: None.
Translations: For the Berber, Luganda, Xhosa, Chewa, Yoruba, Igbo, Hausa and Afan Oromo translations of the abstract see Supplementary Materials section.
Copyright © 2023 The Author(s). Published by Elsevier Ltd. This is an Open Access article under the CC BY-NC-ND 4.0 license. Published by Elsevier Ltd.. All rights reserved.
Conflict of interest statement
Declaration of interests We declare no competing interests.
Figures
Comment in
-
Influenza surveillance data from Africa to inform tailored vaccination programmes.Lancet Glob Health. 2023 May;11(5):e640-e641. doi: 10.1016/S2214-109X(23)00154-7. Lancet Glob Health. 2023. PMID: 37061300 No abstract available.
References
-
- Antunes JL, Waldman EA, Borrell C, Paiva TM. Effectiveness of influenza vaccination and its impact on health inequalities. Int J Epidemiol. 2007;36:1319–1326. - PubMed
MeSH terms
Substances
Grants and funding
LinkOut - more resources
Full Text Sources
Medical
Miscellaneous
