. 2023 Apr;153(4):988-998.
doi: 10.1016/j.tjnut.2022.11.021. Epub 2022 Dec 22.

Glucose-Induced Activation of mTORC1 is Associated with Hexokinase2 Binding to Sestrins in HEK293T Cells

Affiliations

Glucose-Induced Activation of mTORC1 is Associated with Hexokinase2 Binding to Sestrins in HEK293T Cells

Paul A Roberson et al. J Nutr. 2023 Apr.

Abstract

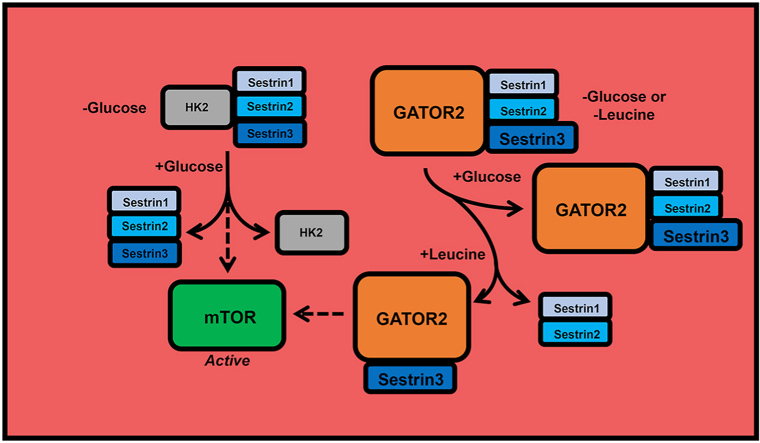
Background: Sestrins (SESN1-3) act as proximal sensors in leucine-induced activation of the protein kinase mechanistic target of rapamycin (mTOR) in complex 1 (mTORC1), a key regulator of cell growth and metabolism.

Objective: In the present study, the hypothesis that SESNs also mediate glucose-induced activation of mTORC1 was tested.

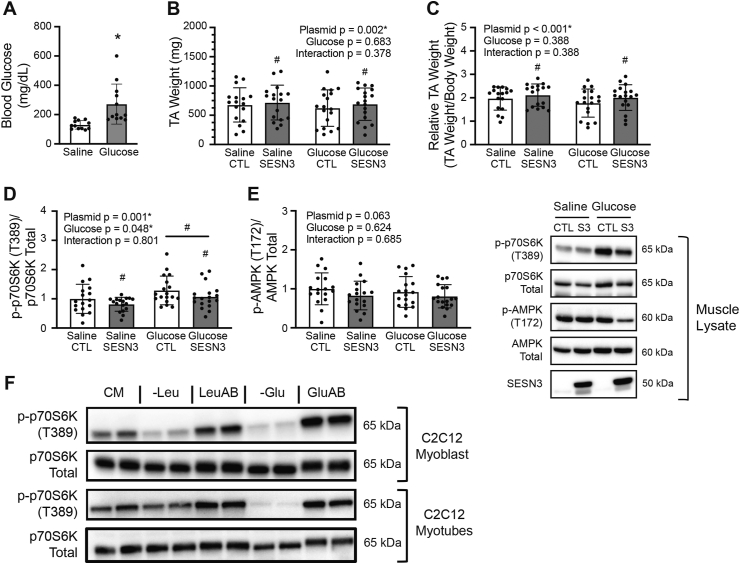
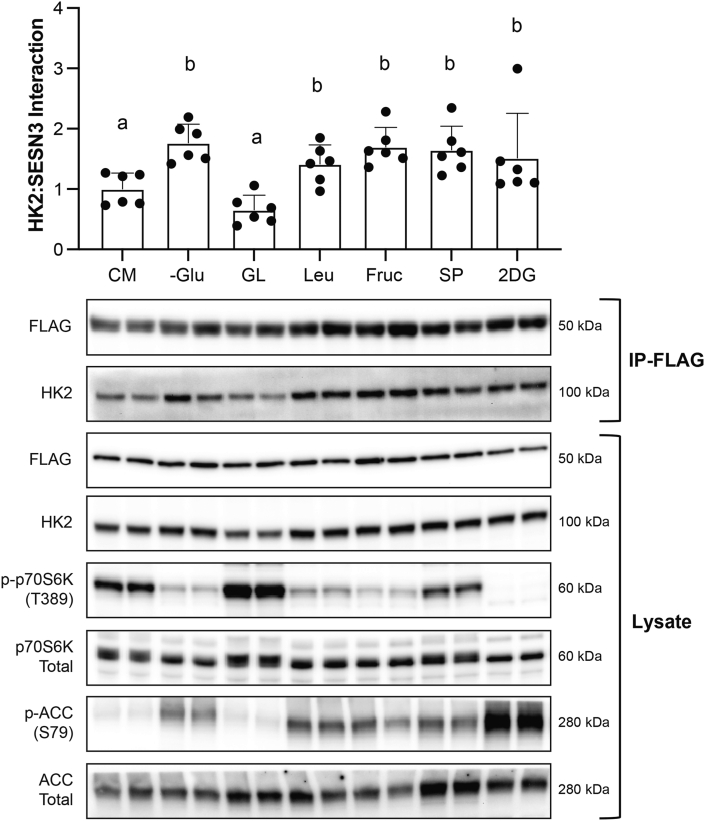
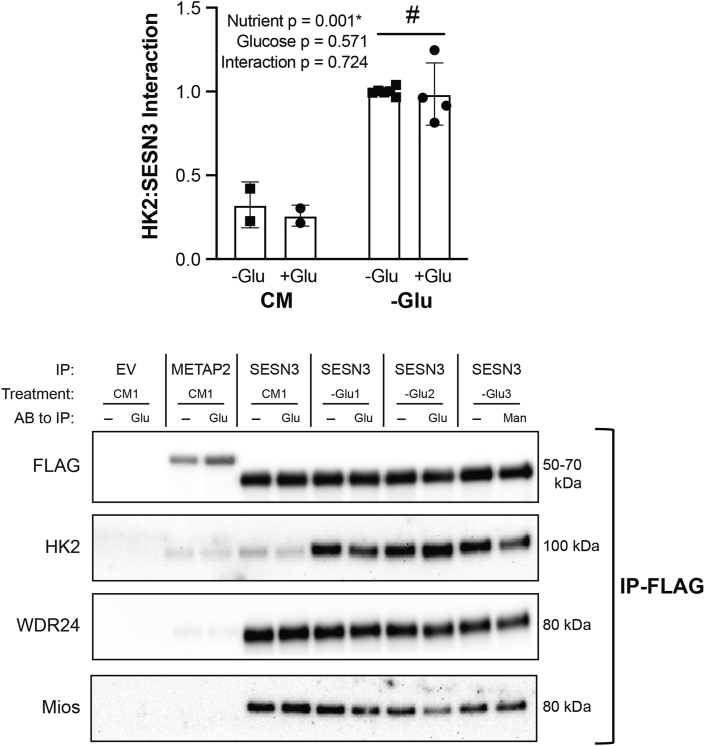
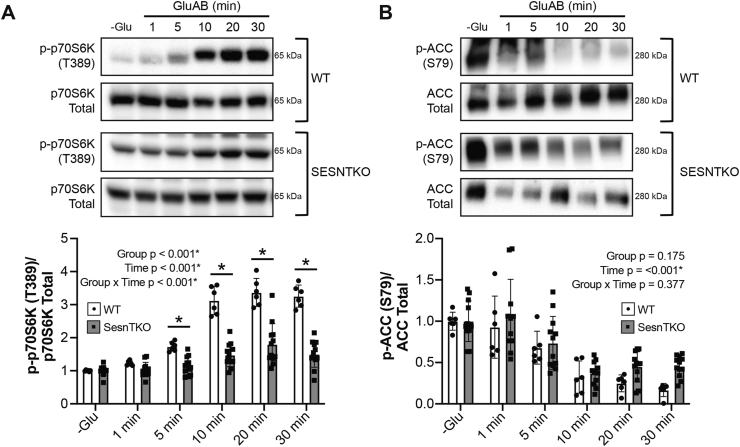
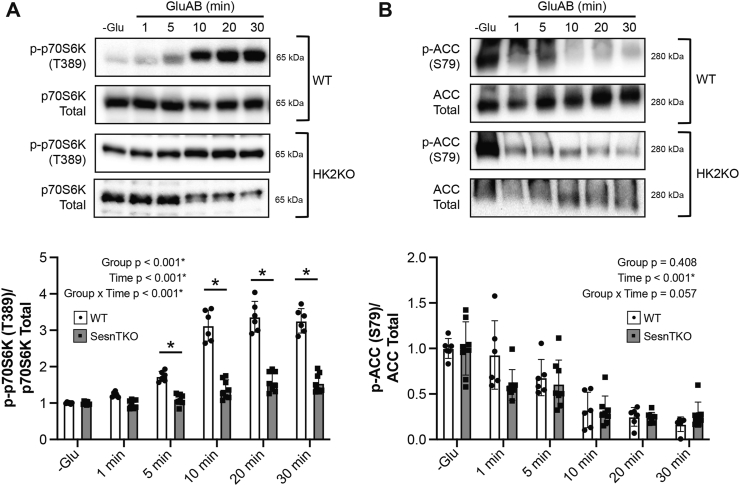
Methods: Rats underwent overnight fasting, and in the morning, either saline or a glucose solution (4 g⋅kg-1 BW/10 mL⋅kg-1) was administered by oral gavage; mTORC1 activation in the tibialis anterior muscle was assessed. To further assess the mechanism through which glucose promotes mTORC1 activation, wild-type (WT) HEK293T and HEK293T cells lacking either all 3 SESNs (SESNTKO) or hexokinase 2 (HK2KO) were deprived of glucose, followed by glucose addback, and mTORC1 activation was assessed. In addition, glucose-induced changes in the association of the SESNs with components of the GAP activity toward the Rags (GATOR2) complex and with hexokinase 2 (HK2) were assessed by co-immunoprecipitation. One- and two-way ANOVA with Tukey post hoc comparisons were used.

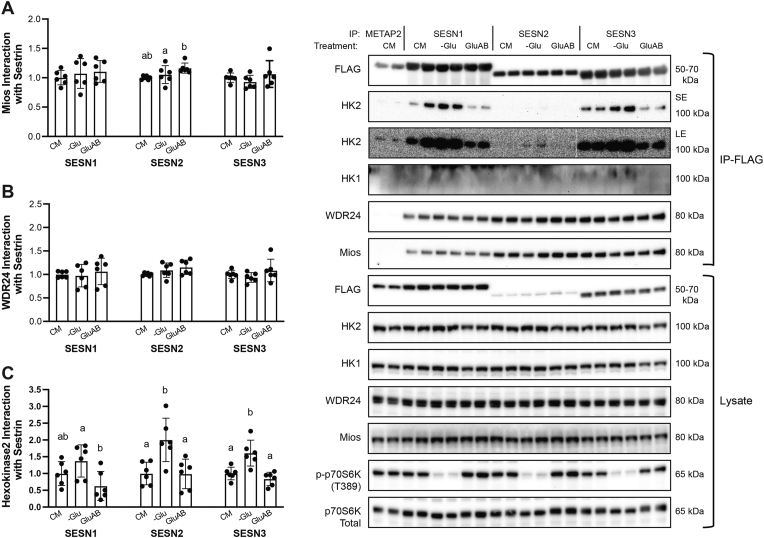
Results: Glucose administration to fasted rats promoted mTORC1 activation. Similarly, glucose readdition (GluAB) to the medium of glucose-deprived WT cells also promoted mTORC1 activation. By contrast, SESNTKO cells demonstrated attenuated mTORC1 activation following GluAB compared with WT cells. Interestingly, HK2 associated with all 3 SESNs in a glucose-dependent manner, i.e., HK2 abundance in SESN immunoprecipitates was high in cells deprived of glucose and decreased in response to GluAB. Moreover, similar to SESNTKO cells, the sensitivity of mTORC1 to GluAB was attenuated in HK2KO cells compared with WT cells.

Conclusions: The results of this study demonstrate that the SESNs and HK2 play important roles in glucose-induced mTORC1 activation in HEK293T cells. However, unlike leucine-induced mTORC1 activation, the effect was independent of the changes in SESN-GATOR2 interaction, and instead, it was associated with alterations in the association of SESNs with HK2.

Keywords: glucose; mTORC1; metabolism; nutrient signaling; skeletal muscle.


Figures

Image 1
Graphical abstract
FIGURE 1
FIGURE 1
Oral administration of glucose activates mTORC1 in skeletal muscle in vivo and following glucose addback to cells deprived of the nutrient. (A) Rat blood glucose level following saline or glucose oral gavage. (B) Absolute and (C) relative tibialis anterior muscle weight following gavage. (D) Relative phosphorylation of skeletal muscle p70S6K on T389 and (E) AMPK on T172; representative blots are pictured to the right. (F) Nutrient availability effects on mTORC1 activation in C2C12 myoblasts and myotubes. “CTL”—Control, “SESN3/S3”—Sestrin3. Values are presented as mean ± SD. ∗ P < 0.050 between groups. “#” represents a significant main effect (P < 0.050) between 2 conditions. Numerical data, experiment number, replicate number, and n-size are detailed in Supplemental Table 2.
FIGURE 4
FIGURE 4
The Sestrin3 (SESN3):Hexokinase2 (HK2) interaction in HEK293T cells is affected by glucose specifically. HK2 interaction with SESN3 in response to different nutrients. Differing letters denote significant differences (P < 0.050) between groups. Representative images are shown below the figure and in duplicate. Images from immunoprecipitated (IP) samples are listed next to “IP-FLAG,” whereas cell lysate samples are listed next to “Lysate.” All values were made relative to the average of CM and are presented as mean ± SD. Numerical data, experiment number, replicate number, and n-size are detailed in Supplemental Table 2.
FIGURE 5
FIGURE 5
Glucose does not directly modify the Sestrin3 (SESN3):Hexokinase2 (HK2) interaction. HK2 interaction with SESN3 in response to glucose addition to cell lysates from HEK293T cells. Representative images are below the figure and in duplicate. Images from immunoprecipitated (IP) samples are listed next to “IP-FLAG.” Two separate experiments were completed, and each experiment contained one CM culture dish and 3 −Glu dishes. Each dish was split, and one duplicate received no glucose (−Glu), whereas the other received 10 mM glucose (+Glu). The −Glu/+Glu condition only contains 4 samples as the other 2 samples received mannitol. All values were made relative to the average of −Glu and are presented as mean ± SD. # represents a significant main effect (P < 0.05) between 2 conditions. Numerical data, experiment number, replicate number, and n-size are detailed in Supplemental Table 2.
FIGURE 3
FIGURE 3
Sestrin (SESN) interaction with Hexokinase2, but not GATOR2, is influenced by glucose availability in HEK293T cells. Interaction of the GATOR2 proteins (A) Mios and (B) WDR24, respectively, and (C) hexokinase 2 (HK2) with FLAG-tagged SESNs in response to glucose deprivation and readdition. Differing letters denote significant differences (P < 0.050) between groups within a SESN. Representative images for all conditions are adjacent to the panels and are in duplicate. Images from immunoprecipitated (IP) samples are listed next to “IP-FLAG,” whereas cell lysate samples are listed next to “Lysate.” All values were made relative to the average of each respective SESN’s CM and are presented as mean ± SD. “SE”, short exposure. “LE”, long exposure. Numerical data, experiment number, replicate number, and n-size are detailed in Supplemental Table 2.
FIGURE 2
FIGURE 2
Sestrin-deficient HEK293T cells demonstrate blunted mTORC1 activation in response to glucose. (A) Relative phosphorylation of p70S6K on T389 and (B) ACC on S79 in response to glucose readdition following glucose deprivation in wild-type and Sestrin triple-knockout cells. Representative blots accompany each figure. Values are presented as mean ± SD. ∗ P < 0.050 between groups. Numerical data, experiment number, replicate number, and n-size are detailed in Supplemental Table 2.
FIGURE 6
FIGURE 6
Hexokinase2 knockout HEK293T cells demonstrate blunted mTORC1 activation in response to glucose in HEK293T cells. (A) Relative phosphorylation of p70S6K on T389 and (B) ACC on S79 in response to glucose readdition in wild-type (WT) and hexokinase2 knockout cells (HK2KO). The data obtained from WT cells in Figure 2A, B were reused for Figure 6A, B, respectively. For WT cells, 3 separate experiments containing 2 experimental replicates for each experiment were utilized. For the HK2KO cells, 2 separate experiments containing 4 experimental replicates for each experiment were utilized. Values were made relative to the average of the −Glu condition for each cell line (WT or SesnTKO) and are presented as mean ± SD. Representative blots accompany each figure. ∗ P < 0.050 between groups. Numerical data, experiment number, replicate number, and n-size are detailed in Supplemental Table 2.

Comment in

Similar articles

Cited by

References

    1. Mergenthaler P., Lindauer U., Dienel G.A., Meisel A. Sugar for the brain: the role of glucose in physiological and pathological brain function. Trends Neurosci. 2013;36:587–597. - PMC - PubMed
    1. van Wijk R., van Solinge W.W. The energy-less red blood cell is lost: erythrocyte enzyme abnormalities of glycolysis. Blood. 2005;106:4034–4042. - PubMed
    1. Hargreaves M., Spriet L.L. Skeletal muscle energy metabolism during exercise. Nat Metab. 2020;2:817–828. - PubMed
    1. Shao D., Villet O., Zhang Z., Choi S.W., Yan J., Ritterhoff J., et al. Glucose promotes cell growth by suppressing branched-chain amino acid degradation. Nat Commun. 2018;9:2935. - PMC - PubMed
    1. Orozco J.M., Krawczyk P.A., Scaria S.M., Cangelosi A.L., Chan S.H., Kunchok T., et al. Dihydroxyacetone phosphate signals glucose availability to mTORC1. Nat Metab. 2022;2:893–901. - PMC - PubMed

Publication types