. 2023 Apr 15;14(1):2167.
doi: 10.1038/s41467-023-37431-x.

Stable endocytic structures navigate the complex pellicle of apicomplexan parasites

Affiliations

Stable endocytic structures navigate the complex pellicle of apicomplexan parasites

Ludek Koreny et al. Nat Commun. .

Abstract

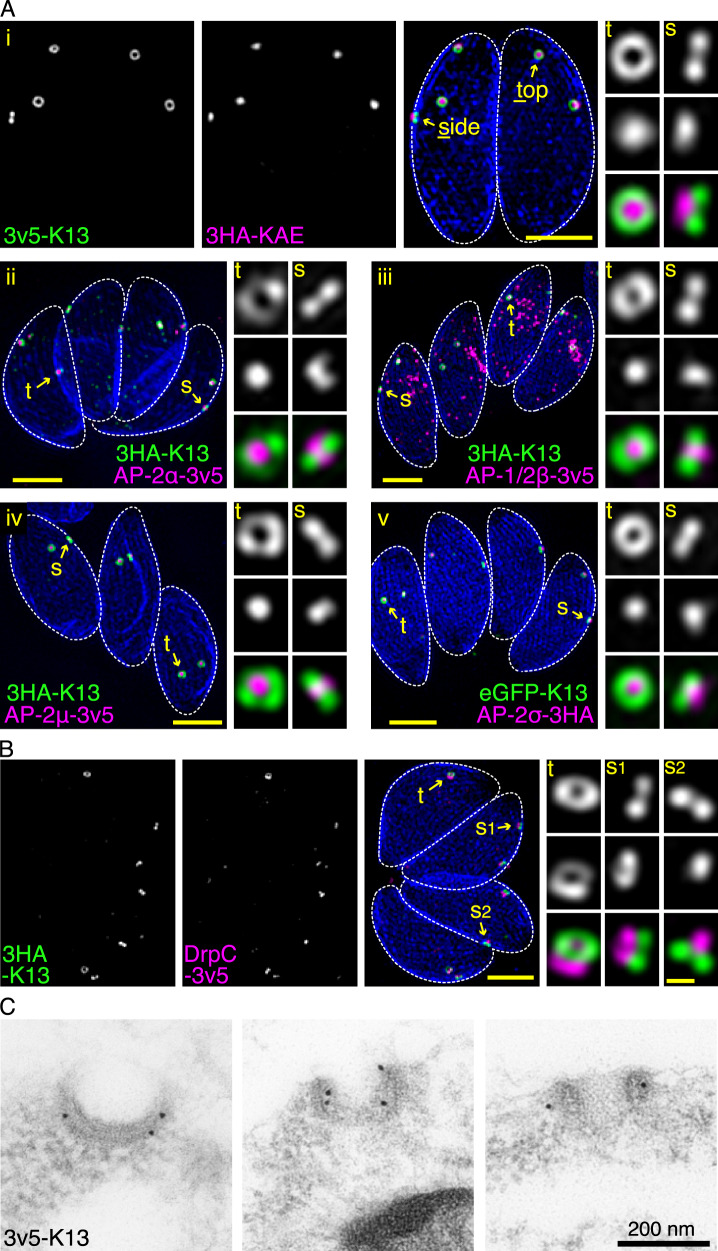
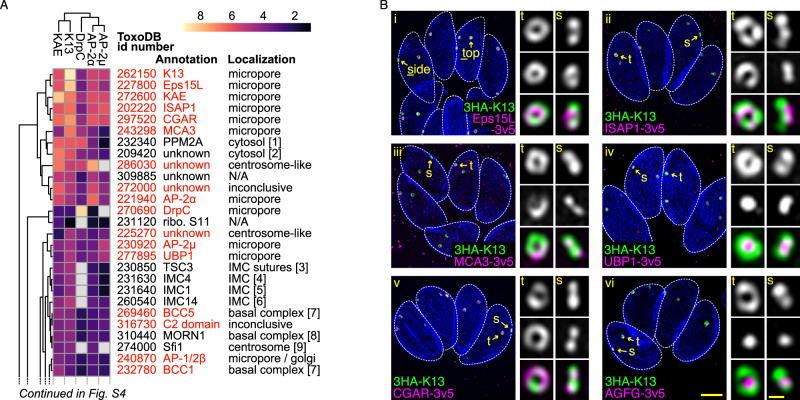
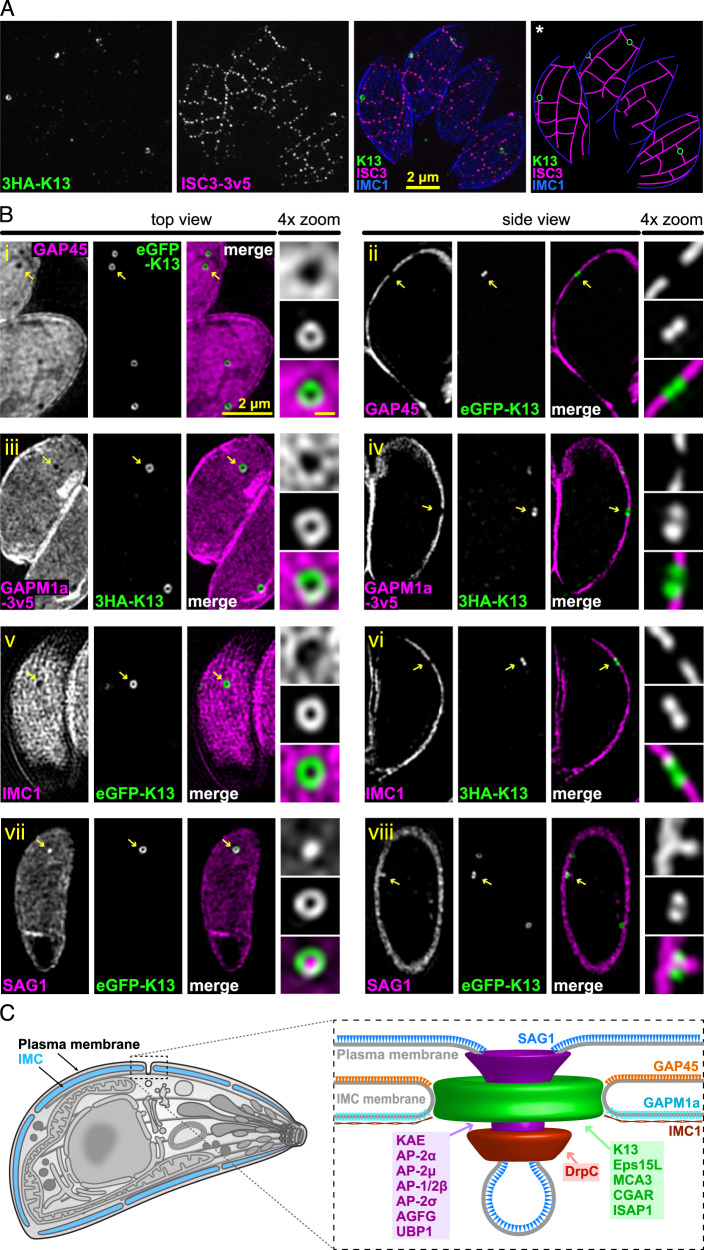
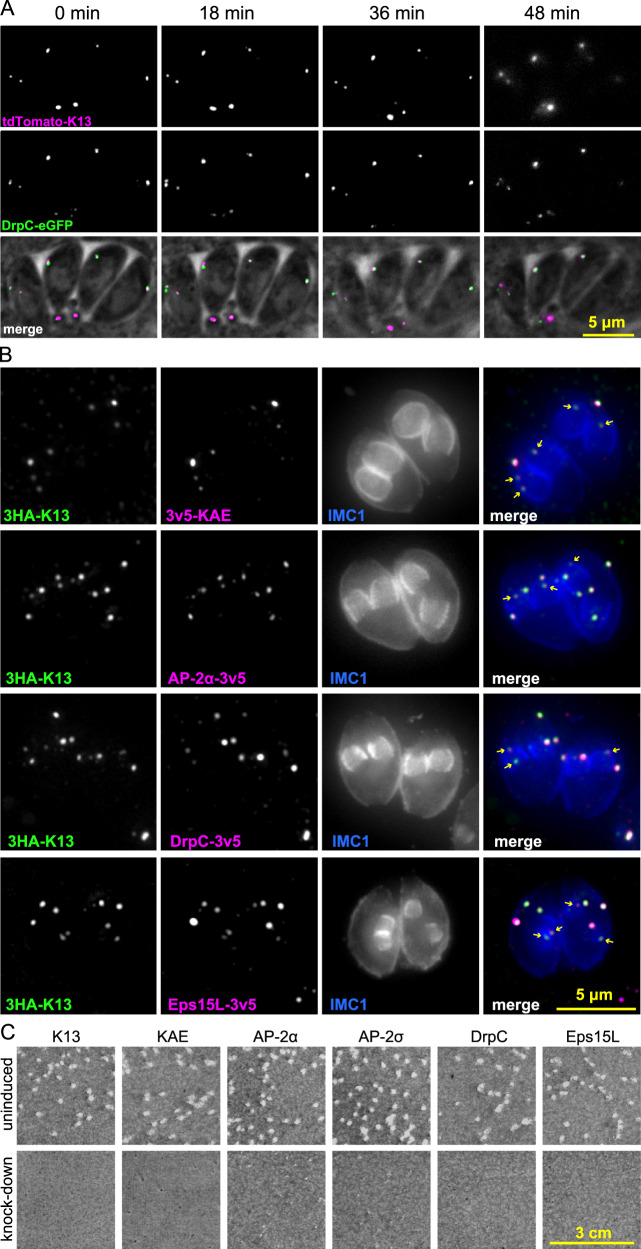
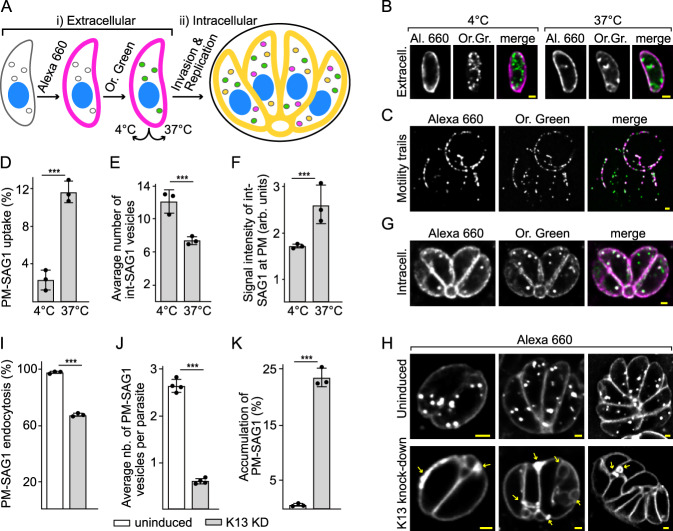
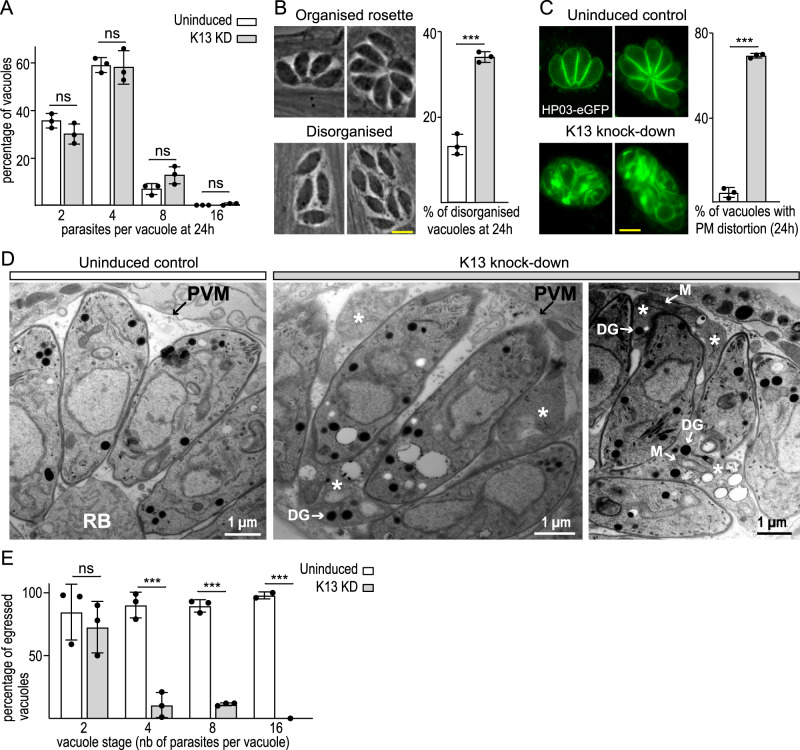
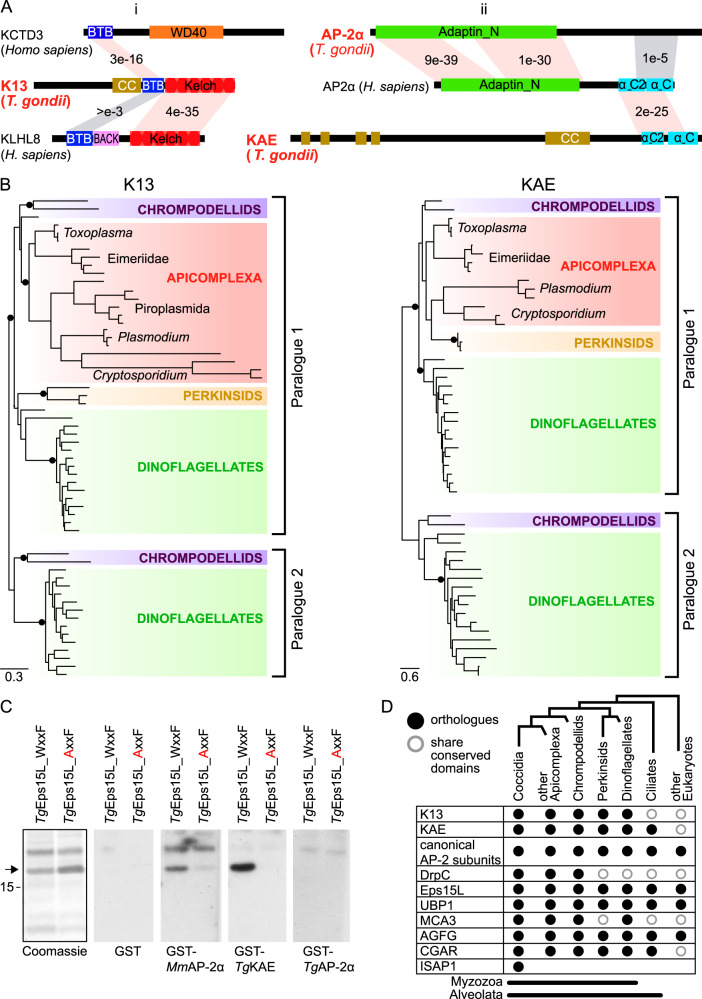
Apicomplexan parasites have immense impacts on humanity, but their basic cellular processes are often poorly understood. Where endocytosis occurs in these cells, how conserved this process is with other eukaryotes, and what the functions of endocytosis are across this phylum are major unanswered questions. Using the apicomplexan model Toxoplasma, we identified the molecular composition and behavior of unusual, fixed endocytic structures. Here, stable complexes of endocytic proteins differ markedly from the dynamic assembly/disassembly of these machineries in other eukaryotes. We identify that these endocytic structures correspond to the 'micropore' that has been observed throughout the Apicomplexa. Moreover, conserved molecular adaptation of this structure is seen in apicomplexans including the kelch-domain protein K13 that is central to malarial drug-resistance. We determine that a dominant function of endocytosis in Toxoplasma is plasma membrane homeostasis, rather than parasite nutrition, and that these specialized endocytic structures originated early in infrakingdom Alveolata likely in response to the complex cell pellicle that defines this medically and ecologically important ancient eukaryotic lineage.


Conflict of interest statement

The authors declare no competing interests.

Figures

Fig. 1
Fig. 1. Endocytosis-related AP-2 and DrpC associate with K13 at peripheral micropore structures in T. gondii.
A Collapsed projections of 3D-SIM images of intracellular parasites within the host cell vacuole showing K13 (green) with five different AP-2 related proteins: (i) KAE, (ii) AP-2α, (iii) AP-2µ, (iv) AP-1/2β and (v) AP-2σ (all magenta). B K13 (green) with dynamin related protein DrpC (magenta). The IMC1 (blue) shows the parasite inner membrane complex, and zoomed panels show micropores either in side (s) or top (t) projections as indicated. Reporter epitopes and the terminus of fusion are shown in the figures. See Fig. S1 for wide-field fluorescence images and Fig. S2 for further examples. Scale bars for large and small panels are 2 µm and 0.2 µm, respectively. C Immuno-TEM against v5-tagged K13 showing gold labelling specific to the classic micropore structure. See Fig. S3 for further cell examples.
Fig. 2
Fig. 2. Toxoplasma micropore shows conservation with the Plasmodium cytostome but also possesses unique proteins.
A Heat map of BioID-enriched proteins determined with five bait proteins. Results are clustered according to similarity of results between baits and ordered by fold enrichment (colours). Proteins reporter tagged in this study are shown in red, and inferred cell location given. Numbers in brackets refer to previously published localizations: [1], [2], [3], [4], [5], [6], [7], [8], [9]. Full heat map is shown in Fig. S4A. B Collapsed projections of 3D-SIM images of intracellular parasites showing K13 (green) with (i) Eps15L, (ii) ISAP1, (iii) MCA3, (iv) UBP1, (v) CGAR and (vi) AGFG (all magenta). IMC1 or GAP45 (blue) mark the parasite pellicle, and zoomed panels show micropores either in side (s) or top (t) projections as indicated. Reporter epitopes and the terminus of fusion are shown in the figures. Scale bars for large and small panels are 2 µm and 0.2 µm, respectively.
Fig. 3
Fig. 3. The micropore occurs in openings of the IMC at the alveolar plate boundaries.
A 3D-SIM images of intracellular parasites showing K13 (green) with a suture protein ISC3 (magenta). *The suture lines were extrapolated in the rightmost image based on the ISC3 signal. B Top and side 3D-SIM projections of micropores with markers for the IMC outer and inner membrane proteins GAP45 (i–ii) and GAPM1a (iii–iv), respectively; IMC subpellicular network protein IMC1 (v–vi); and GPI-anchored surface protein SAG1 (vii–viii) (all in magenta). Yellow arrows correspond to structures shown in the magnified panels, and all scale bars are 2 µm and 0.2 µm for the overview and zoomed images, respectively. C Model of the endocytic K13 micropore complex in the pellicle of T. gondii tachyzoite from these data and Figs. 1 and 2. IMC inner membrane complex. See Figs. S5 and S6 for further examples.
Fig. 4
Fig. 4. The K13 complex is stable over time, is assembled early in IMC formation during cell replication, and is required for parasite lytic cycle progression.
A Live-cell time-lapse sequence of four parasites in a host vacuole showing that K13 and DrpC locations are stable over time. B Wide-field fluorescence images of cells fixed during the formation of daughter cells that are evident by internal IMC1 (blue) pellicle ‘cups’. K13 (green) is co-stained with KAE, AP-2α, DrpC and Eps15L (all magenta) with weaker protein signals present for all in the developing daughters (arrows), some of which are seen at the pellicle leading edges. C Seven-day plaque growth assays in six cell lines with K13 complex gene expression individually suppressed by ATc. Representative results of three independent assays are shown.
Fig. 5
Fig. 5. SAG1-Halo-bound ligands report on endocytosis which is reduced in K13-depleted parasites.
A Schematic of differential labelling of SAG1 pools at the plasma membrane surface (PM-SAG1 stained with Alexa 660, magenta) or in internal vesicles (Int-SAG1 stained with Oregon Green, green) and tests for endocytic recycling at either non-permissive (4 °C) or permissive (37 °C) temperatures (i). Infection of hosts after labelling allows these processes to be monitored during intracellular growth (ii) (orange indicates co-location of signals). B Ligand detection of labelled extracellular cells incubated at either 4 °C or 37 °C. C Motility trails of labelled SAG1 left by gliding parasites at 37 °C. Differences according to temperature treatment in: D the percentage of cells with internalized PM-SAG1 as a measure of endocytosis (P value = 3.52E−5), E the number of Int-SAG1 vesicles per cell as a measure of exocytosis (P value = 3.03E−16), and F the intensity of Int-SAG1 at the cell surface as a further measure of exocytosis (P value = 9.82E−6). G Redistribution of differentially labelled extracellular cells (PM-SAG1 and Int-SAG1) viewed 24 h after invasion and intracellular growth. H Alexa 660-labelled PM-SAG1 after 24 h of growth without or with K13 depletion. Reduced uptake of PM-SAG1 to intracellular vesicles is quantified as I percentage of parasites with internalized PM-SAG1 (P value = 7.75E−16) and J the average number of PM-SAG1-positive vesicles per cell (P value = 1.13E−12). K13-depleted cells showed accumulations of extra PM-SAG1-positive membranes (arrows in H) which occurred in a higher percentage of cells than for the uninduced controls (K) (P value = 1.77E−9). Three biological replicates were used for all analyses; All P values are 0 ≤ P ≤ 0.001, ***, error bars are standard deviations and the centre measurement of the graph bars is mean. Two-sided Student’s T-test was used for all the comparisons with no adjustments. All scale bars = 1 µm. Source data are provided as a Source Data file.
Fig. 6
Fig. 6. K13-depletion disrupts parasite order, integrity and egress but not replication rate.
A Number of parasites per parasitophorous vacuole after 24 h of post invasion replication with or without 72 h of ATc-induced K13 depletion; P values are 0.1401 (2 parasites), 0.8919 (4 parasites), 0.0688 (8 parasites) and 0.1161 (16 parasites). B Percentage of disorganized vacuoles after the same treatments as (A). Disordered vacuoles are scored as those that lack ≥75% of parasites sharing a common posterior orientation as shown by four- and eight-cell parasite rosettes (examples imaged by phase contrast); P value = 0.0002. C Live cells expressing a plasma membrane marker HP03-eGFP after the same treatments as (A) and (B) showing increasing lack of organization and PM integrity with K13-depletion (see Fig. S8 for more examples); P value = 0.00001. The scale bars in (B) and (C) are 5 µm. D TEM images of parasites within the parasitophorous vacuole with K13 either present or depleted. With K13 depletion the spaces between parasites are filled with parasite cytoplasm bounded by a single membrane (asterisks) and containing organelles including mitochondria (M) and dense granules (DG). RB, residual body; PVM, parasitophorous vacuole membrane. E Egress assay showing percentage Ca2+ ionophore-induced egressed vacuoles according to vacuole parasite number for K13-depleted versus control cells; P values are 0.5299 (2 parasites), 0.0007 (4 parasites), 0.0000 (8 parasites). Three biological replicates were used for all analyses; P values are indicated as 0.05 < P ≤ 1, ns; 0 ≤ P ≤ 0.001, ***, error bars are standard deviations and the centre measurement of the graph bars is mean. Two-sided Student’s T-test was used for all the comparisons with no adjustments. Source data are provided as a Source Data file.
Fig. 7
Fig. 7. K13 and AP-2 unique traits co-evolved in Myzozoa.
A Domain architectures of: (i) K13 compared to proteins from humans, which demonstrate high sequence similarity to the BTB and Kelch domains, and (ii) apicomplexan AP-2α and KAE compared to human AP-2α as canonical representative. BLASTP E-values indicate relative conservation between common domains. Conserved domains shown in colour; CC, coiled coil. B Maximum-likelihood phylogenies for K13 and KAE. SH-like aLRT branch supports over 0.9 are indicated by black dots, and complete phylogenies are shown in Fig. S11D. C Far-Western blots with immobilized fragments of TgEps15L (arrow) containing either the native (WxxF) or mutated (AxxF) of the predicted AP-2 ear-binding domain (Coomassie-stained gel, black outline). GST-fused ear domains of AP-2 candidate proteins from Mus musculus (Mm) or T. gondii (Tg) (or GST alone as negative control) were allowed to bind to the Esp15L fragments and visualized by anti-GST staining. The marker size is 15 kDa. Source data are provided as a Source Data file. D Distribution of K13 complex proteins in myzozoan and related lineages.

Similar articles

Cited by

References

    1. Autoridad Nacional del Servicio Civil. World malaria report 2021. Angew. Chem. Int. Ed.6, 951–952 (2021).
    1. Striepen, B. Time to tackle cryptosporidiosis. Nature503, 189–191 (2013). - PubMed
    1. Khalil IA, et al. Morbidity, mortality, and long-term consequences associated with diarrhoea from Cryptosporidium infection in children younger than 5 years: a meta-analyses study. Lancet Glob. Health. 2018;6:e758–e768. doi: 10.1016/S2214-109X(18)30283-3. - DOI - PMC - PubMed
    1. Havelaar AH, et al. World Health Organization global estimates and regional comparisons of the burden of foodborne disease in 2010. PLoS Med. 2015;12:e1001923. doi: 10.1371/journal.pmed.1001923. - DOI - PMC - PubMed
    1. Montoya JG, Liesenfeld O. Toxoplasmosis. Lancet. 2004;363:1965–1976. doi: 10.1016/S0140-6736(04)16412-X. - DOI - PubMed

Publication types

Substances