. 2023 Apr 15;14(1):2164.
doi: 10.1038/s41467-023-37835-9.

Delayed generation of functional virus-specific circulating T follicular helper cells correlates with severe COVID-19

Affiliations

Delayed generation of functional virus-specific circulating T follicular helper cells correlates with severe COVID-19

Meng Yu et al. Nat Commun. .

Abstract

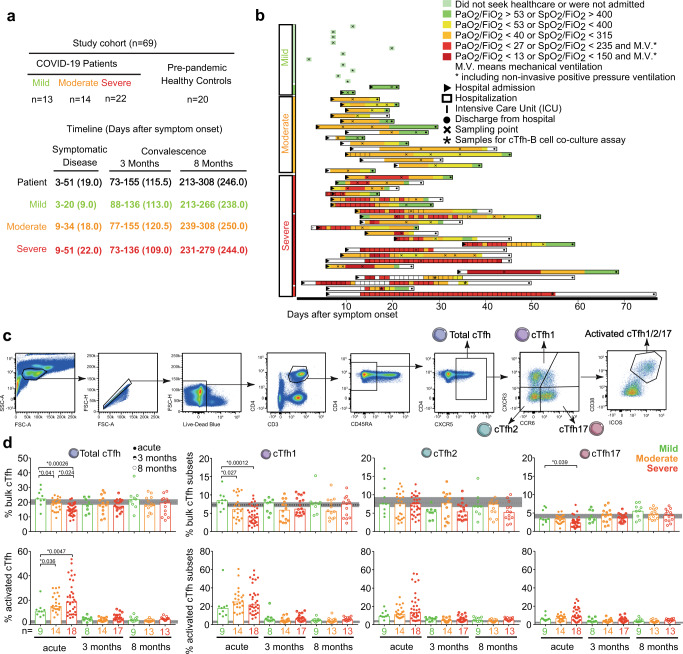
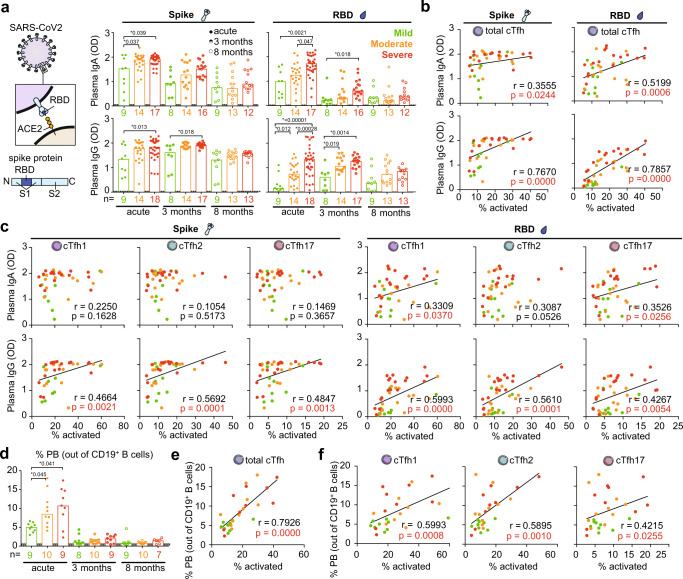
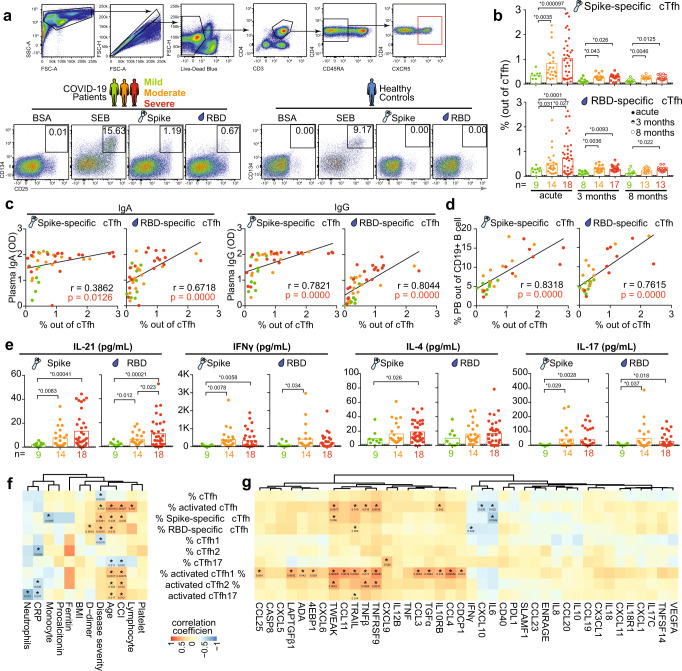
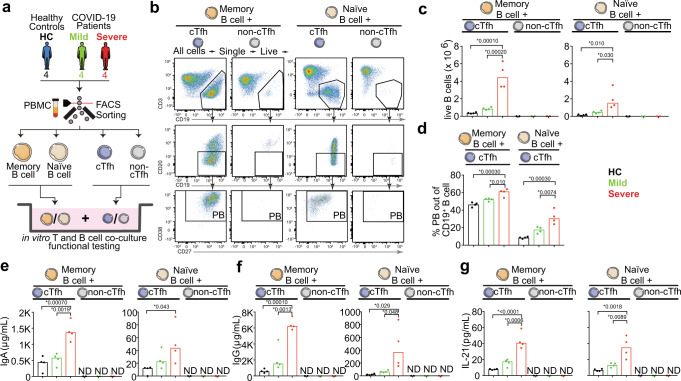
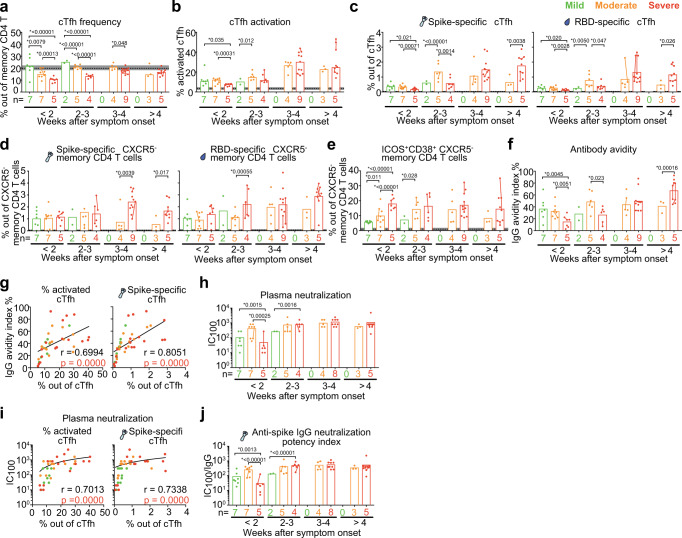
Effective humoral immune responses require well-orchestrated B and T follicular helper (Tfh) cell interactions. Whether these interactions are impaired and associated with COVID-19 disease severity is unclear. Here, longitudinal blood samples across COVID-19 disease severity are analysed. We find that during acute infection SARS-CoV-2-specific circulating Tfh (cTfh) cells expand with disease severity. SARS-CoV-2-specific cTfh cell frequencies correlate with plasmablast frequencies and SARS-CoV-2 antibody titers, avidity and neutralization. Furthermore, cTfh cells but not other memory CD4 T cells, from severe patients better induce plasmablast differentiation and antibody production compared to cTfh cells from mild patients. However, virus-specific cTfh cell development is delayed in patients that display or later develop severe disease compared to those with mild disease, which correlates with delayed induction of high-avidity neutralizing antibodies. Our study suggests that impaired generation of functional virus-specific cTfh cells delays high-quality antibody production at an early stage, potentially enabling progression to severe disease.


Conflict of interest statement

A.S.-S. is a consultant to Astra-Zeneca on studies not related to the present study. The remaining authors declare no competing interests.

Figures

Fig. 1
Fig. 1. Longitudinal frequency and activation of cTfh cells in COVID-19 patients across disease severity from acute disease up to 8 months convalescence.
a Overview of study cohort (n = 69), and b the timeline of longitudinal sampling. Patients are grouped based on peak disease severity, including mild (green), moderate (orange) and severe (red). Individual patients are color-coded based on daily disease severity. PaO2 is expressed in kPa. c Gating strategy to identify cTfh cells in PBMCs by flow cytometry. From single, live CD3+ CD4+ T cells, memory CD4+ T cells were identified as CD45RA. From memory CD4+ T cells, cTfh cells were identified as CXCR5+ cells. cTfh subsets were identified as cTfh1 (CXCR3+ CCR6), cTfh2 (CXCR3 CCR6) and cTfh17 (CXCR3- CCR6+). Activated cTfh and its subsets were identified with ICOS+ CD38+ expressing. Patients are grouped based on peak disease severity, including mild (green), moderate (orange) and severe (red). d Bar charts show the frequency of bulk and activated cTfh, cTfh1, cTfh2, and cTfh17 cells from COVID-19 patients with acute disease (Acute, full circle), 3 months convalescence (3 months, half circle) and 8 months convalescence (8 months, open circle) with median. Dots are individual samples color-coded according to peak disease severity. Dotted lines show the median frequency with 95% Cl (gray area) of prepandemic healthy controls. X axis shows the number of patients in each bar. During acute disease, 9, 22, and 33 individual samples from 9 mild, 14 moderate and 18 severe patients, respectively, were analyzed using two-sided Generalized Estimating Equations (GEE) to account for the intra-person correlations inherent to repeated measures and assess statistically significant differences without adjusting for multiple comparisons. During 3 and 8 months convalescence, only one sample from each patient was analyzed and two-sided Kruskal–Wallis with Dunn’s multiple comparisons test was used to assess statistically significant differences. P < 0.05 was considered to be a significant difference. *P values <0.05 are listed above each comparison. Source data are provided as a Source Data file.
Fig. 2
Fig. 2. Longitudinal titers of plasma immunoglobulins against SARS-CoV-2 spike and RBD and frequency of blood plasmablast (PB) in COVID-19 patients across disease severity from acute disease up to 8 months convalescence.
a Bar charts show the OD value of plasma IgA and IgG against SARS-CoV-2 spike and RBD with median. During acute infection (full circle), 9, 22, and 33 individual samples from 9 mild, 14 moderate, and 18 severe patients, respectively, were analyzed using two-sided Generalized Estimating Equations (GEE) to account for the intra-person correlations inherent to repeated measures and assess statistically significant differences without adjusting for multiple comparisons. During convalescence (half and open circle), only one sample from each patient was analyzed and two-sided Kruskal–Wallis with Dunn’s multiple comparisons test was used to assess statistically significant differences. One severe patient displayed IgA deficiency over time was excluded in all IgA analyses. b, c Two-sided Spearman correlation for plasma immunoglobulins against the spike and RBD versus frequency of activated (b) cTfh and c cTfh subsets during acute disease. In all, 9, 14, and 18 individual samples from 9 mild, 14 moderate and 18 severe patients were analyzed. For patients with longitudinal acute samples, data from the earliest sample was involved as the representative in Spearman correlation analysis. d Frequency of plasmablast from COVID-19 patients is shown by bar chats with median, and the dotted lines show the median frequency with 95% Cl (gray area) of healthy controls. Dots are individual samples color-coded according to peak disease severity. X axis shows the number of patients in each bar. Only one sample from each patient was analyzed during both acute disease and convalescence. Two-sided Kruskal–Wallis with Dunn’s multiple comparisons test was used to consider all statistically significant. e, f Two-sided Spearman correlation for frequency of plasmablast versus frequency of (e) activated cTfh and f activated cTfh subsets during acute disease. Overall, 9, 10, and 9 individual samples from 9 mild, 10 moderate and 9 severe patients were analyzed during acute disease. P < 0.05 was considered to be a significant difference. *P values <0.05 are listed above each comparison. Source data are provided as a Source Data file.
Fig. 3
Fig. 3. Longitudinal frequency of SARS-CoV-2 spike and RBD-specific cTfh in COVID-19 patients across disease severity from acute disease up to 8 months convalescence.
a Representative example with gating strategy to identify SARS-CoV-2 spike and RBD-specific cTfh. b Bar charts show the median frequency of SARS-CoV-2 spike and RBD-specific cTfh from acute disease (full circle) to convalescence (half and open circle) with median. Dots are individual samples color-coded according to peak disease severity. Dotted lines show the median frequency with 95% Cl (gray area) of healthy controls. During acute disease, 9, 22 and 33 individual samples from 9 mild, 14 moderate and 18 severe patients, respectively, were analyzed using two-sided Generalized Estimating Equations (GEE) to account for the intra-person correlations inherent to repeated measures and assess statistically significant differences without adjusting for multiple comparisons. During convalescence, only one sample from each patient was analyzed using two-sided Kruskal–Wallis with Dunn’s multiple comparisons test to assess statistically significant differences. cd Two-sided Spearman correlation for frequency of virus-specific cTfh versus (c) titers of plasma immunoglobulins against the spike and RBD, and versus (d) frequency of plasmablast during acute disease. For patients with longitudinal acute samples, data from the earliest sample was involved as representative in Spearman correlation analysis. e Bar charts show the median concentration of cytokines in supernatants of spike and RBD protein-stimulated PBMCs from COVID-19 patients with acute disease. Dotted lines show the median concentration of cytokines with 95% Cl (gray area) in supernatants from healthy controls. Two-sided GEE was used to account for the intra-person correlations inherent to repeated measures and assess statistically significant differences without adjusting for multiple comparisons. f, g Heatmap summarizing the interrelationship between characteristics of cTfh cells and f clinical parameters, and g levels of plasma cytokines/chemokines from COVID-19 patients with acute disease. Two-sided repeated measures correlations without multiple comparisons were calculated. eg In all, 9, 22, and 33 individual samples from 9 mild, 14 moderate and 18 severe patients, respectively, were analyzed. P < 0.05 was considered to be a significant difference. *P values <0.05 are listed above each comparison and in the heatmaps. Source data are provided as a Source Data file.
Fig. 4
Fig. 4. cTfh isolated from severe COVID-19 patients with acute disease support B cells differentiation and antibody production more efficiently than that from mild COVID-19 patients.
a Blood cTfh, non-cTfh, memory B, and naive B cells were isolated from four severe and mild COVID-19 patients with acute disease, as well as four healthy donors. cTfh or non-cTfh cells were cultured with autologous memory B cells for 6 days, or with autologous naive B cells for 9 days respectively. b Representative example with gating strategy to identify (left) memory B-cell and (right) naive B-cell differentiation. c Bar charts show the number of live B cells in (left) cTfh/non-cTfh co-cultured with memory B cells and (right) cTfh/non-cTfh co-cultured with naive B cells. d Bar charts show the frequency of plasmablast in cTfh-memory/naive B-cell co-cultured. e, f Bar charts show the concentration of (e) IgA and f IgG in supernatant from cTfh/non-cTfh co-cultured with (left) memory B cells and (right) naive B cells. g Bar charts show the concentration of IL-21 in supernatant from cTfh/non-cTfh co-cultured with (left) memory B cells and (right) naive B cells. eg ND means not detectable. Differences were tested with One-Way ANOVA. P < 0.05 was considered to be a significant difference. *P values <0.05 are listed above each comparison. Source data are provided as a Source Data file.
Fig. 5
Fig. 5. Delayed emergence of activated and virus-specific cTfh cells correlated with delayed emergence of high avidity and neutralization plasma antibodies in severe COVID-19 patients compared to mild and moderate patients.
ae Bar charts show the mean frequency of (a) cTfh cells, (b) activated cTfh cells, SARS-CoV-2 spike, and RBD-specific (c) cTfh and (d) CXCR5- memory CD4 T cells, (e) activated CXCR5- memory CD4 T cells in patients with acute COVID-19 according to weeks after symptom onset. f Bar charts show the avidity index of plasma IgG during acute disease against SARS-CoV-2 spike over weeks after symptom onset with mean. g Two-sided Spearman correlation for frequency of activated and virus-specific cTfh versus avidity index of plasma IgG during acute disease. ag In total, 9, 22, and 33 individual samples from 9 mild, 14 moderate, and 18 severe patients, respectively, were analyzed. h, j Bar charts show the (h) neutralization IC100 and j anti-spike IgG neutralization potency index of COVID-19 patient plasma samples across peak disease severity over weeks after symptom onset. i Two-sided Spearman correlation for frequency of activated and virus-specific cTfh versus plasma neutralization IC100 during acute disease. hj Overall, 9, 22, and 31 individual samples from 9 mild, 14 moderate, and 17 severe patients, respectively, were analyzed. Dots are individual samples color-coded according to peak disease severity. The dotted lines show the mean frequency with 95% Cl (gray area) of healthy controls. X axis shows number of patients in each bar. Dots from same patient are linked with line in each bar. The graphical presentations of the different outcomes in (af, h, j) were based on a two-sided Generalized Estimating Equations model with time modeled using a restricted cubic spline with knots at 0, 14, 21, 28, and 53 days, without adjusting for multiple comparisons. g, i One individual sample from each patient was analyzed for Two-sided Spearman correlation during acute disease. For patients with longitudinal acute samples, data from the earliest sample was involved. P < 0.05 was considered to be a significant difference. *P values <0.05 are listed above each comparison. Source data are provided as a Source Data file.

Similar articles

Cited by

References

    1. Zhou F, et al. Clinical course and risk factors for mortality of adult inpatients with COVID-19 in Wuhan, China: a retrospective cohort study. Lancet. 2020;395:1054–1062. doi: 10.1016/S0140-6736(20)30566-3. - DOI - PMC - PubMed
    1. Azkur AK, et al. Immune response to SARS‐CoV‐2 and mechanisms of immunopathological changes in COVID‐19. Allergy. 2020;75:1564–1581. doi: 10.1111/all.14364. - DOI - PMC - PubMed
    1. Brodin P. Immune determinants of COVID-19 disease presentation and severity. Nat. Med. 2021;27:28–33. doi: 10.1038/s41591-020-01202-8. - DOI - PubMed
    1. Mathew D, et al. Deep immune profiling of COVID-19 patients reveals distinct immunotypes with therapeutic implications. Science. 2020;369:eabc8511. doi: 10.1126/science.abc8511. - DOI - PMC - PubMed
    1. Bertoletti A, Tan AT, Le Bert N. The T-cell response to SARS-CoV-2: kinetic and quantitative aspects and the case for their protective role. Oxf. Open Immunol. 2021;2:iqab006. doi: 10.1093/oxfimm/iqab006. - DOI - PMC - PubMed

Publication types