. 2023 Apr 15;14(1):2157.
doi: 10.1038/s41467-023-37928-5.

Transcriptomics of Hirschsprung disease patient-derived enteric neural crest cells reveals a role for oxidative phosphorylation

Affiliations

Transcriptomics of Hirschsprung disease patient-derived enteric neural crest cells reveals a role for oxidative phosphorylation

Zhixin Li et al. Nat Commun. .

Abstract

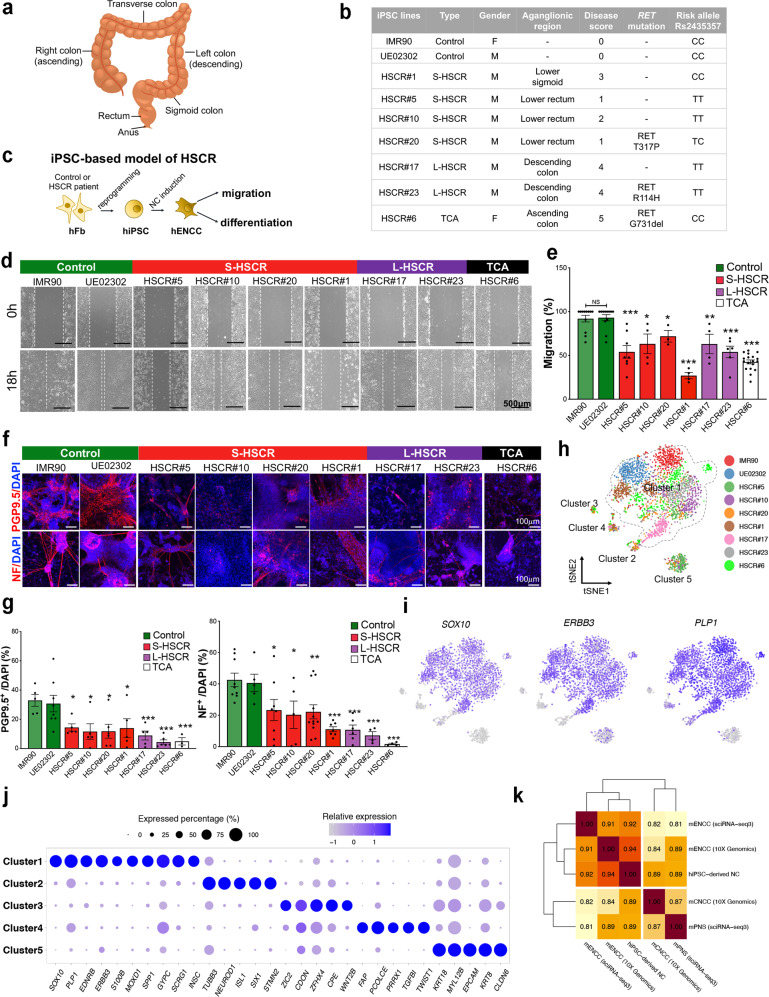
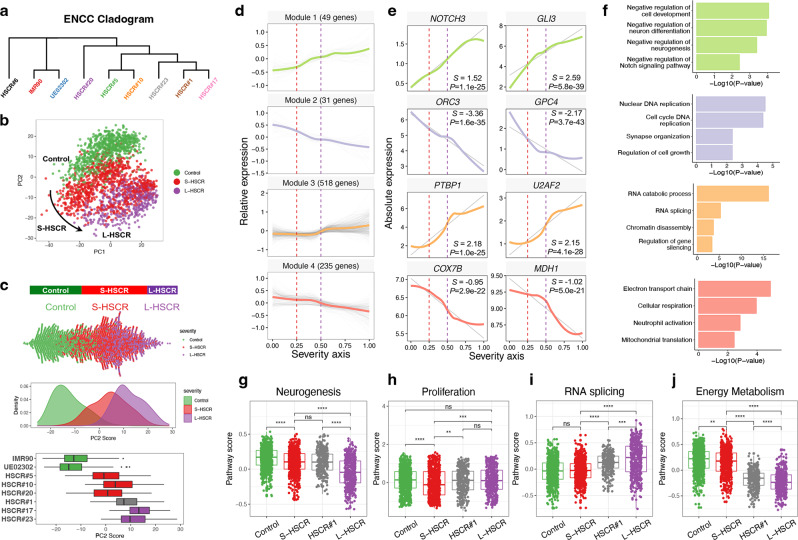
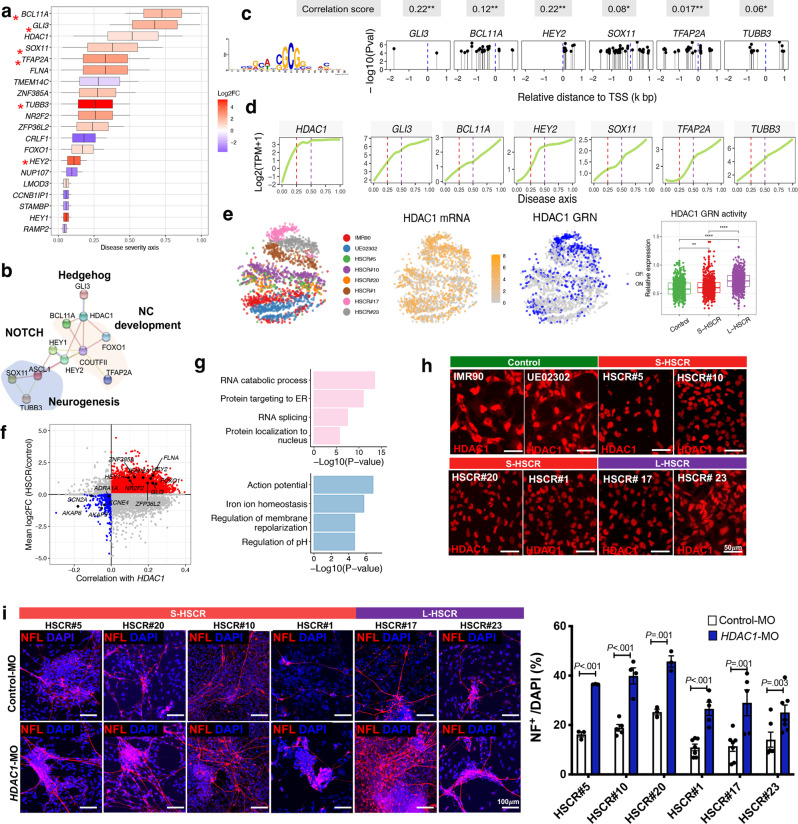
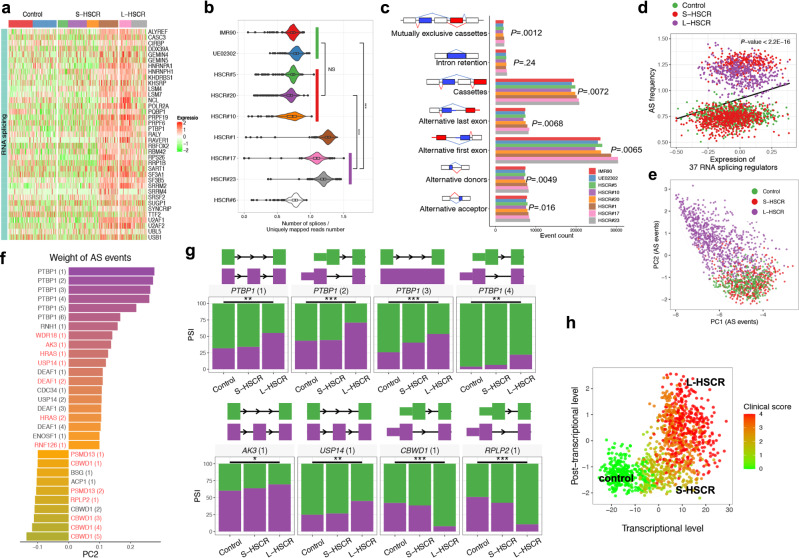
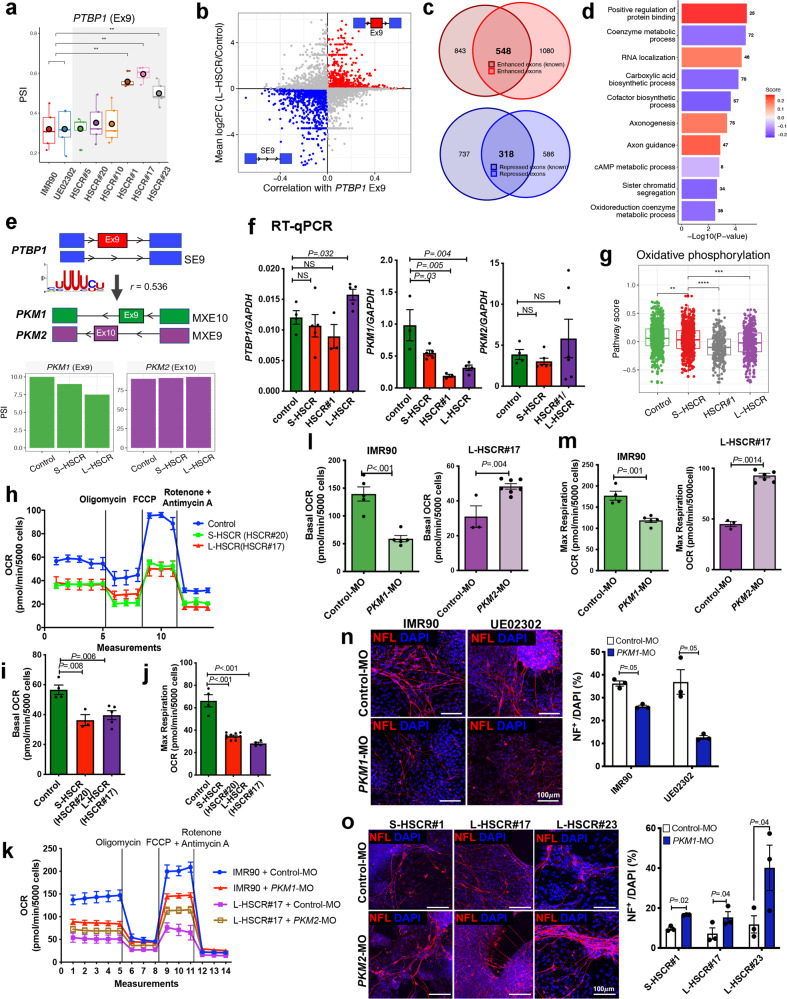
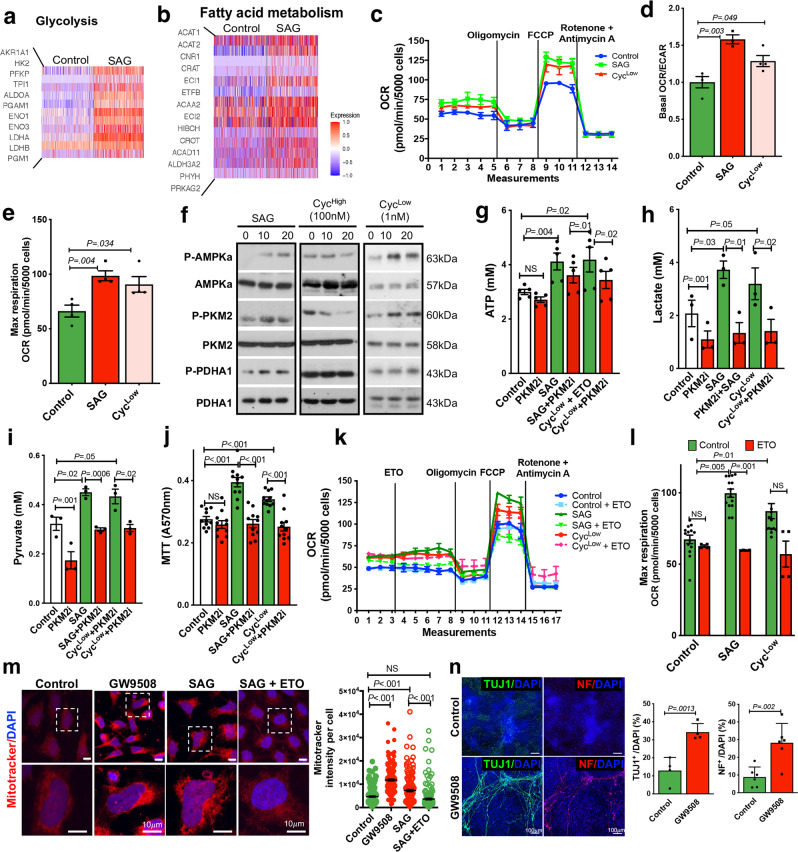
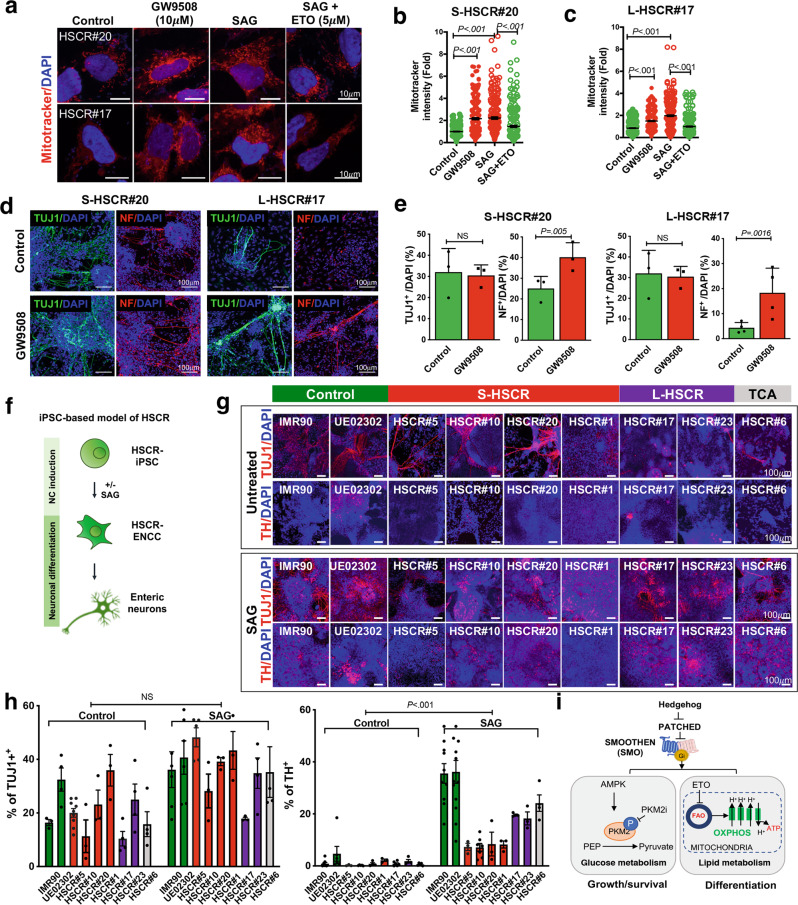
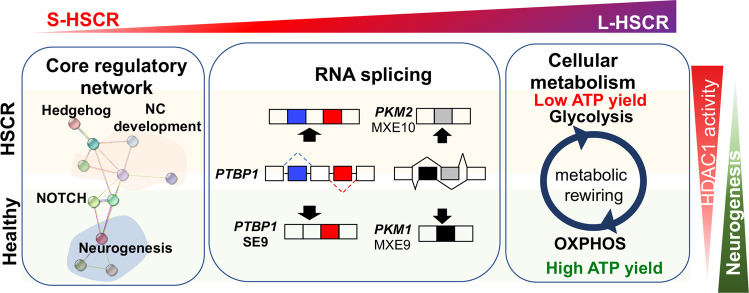
Hirschsprung disease is characterized by the absence of enteric neurons caused by the defects of enteric neural crest cells, leading to intestinal obstruction. Here, using induced pluripotent stem cell-based models of Hirschsprung and single-cell transcriptomic analysis, we identify a gene set of 118 genes commonly dysregulated in all patient enteric neural crest cells, and suggest HDAC1 may be a key regulator of these genes. Furthermore, upregulation of RNA splicing mediators and enhanced alternative splicing events are associated with severe form of Hirschsprung. In particular, the higher inclusion rate of exon 9 in PTBP1 and the perturbed expression of a PTBP1-target, PKM, are significantly enriched in these patient cells, and associated with the defective oxidative phosphorylation and impaired neurogenesis. Hedgehog-induced oxidative phosphorylation significantly enhances the survival and differentiation capacity of patient cells. In sum, we define various factors associated with Hirschsprung pathogenesis and demonstrate the implications of oxidative phosphorylation in enteric neural crest development and HSCR pathogenesis.


Conflict of interest statement

The authors declare no competing interests.

Figures

Fig. 1
Fig. 1. Functional and molecular characterization of an iPSC-based model of HSCR.
a Anatomy of the human colon. b An overview of healthy and HSCR-iPSC lines used in this study. c Schematic shows the recapitulation of disease phenotypes using HSCR-iPSC lines. d In vitro scratch assay. e Bar chart shows the quantitative data of migration. Data were presented as mean values ± SEM from 3–18 independent experiments. f In vitro differentiation assay with two neuronal markers (PGP9.5 and NF) and g the corresponding quantitative analyses. Data are presented as mean values ± SEM from 3–12 independent experiments. e, g One-way ANOVA was used for the statistical analyses. Bars marked by “***”, “**”, and “*” represent they are statistically different from the controls of P values <0.001, <0.01, and <0.05, respectively. NS not significantly different. h t-SNE projection of all 3342 individual cells based on the expression of markers of shared clusters, colored by iPSC lines. Five main clusters are labeled and Cluster 1 is marked with a dotted line. i Canonical markers expressed in Cluster 1. j Dot-plot shows top key markers expressed in each cluster. The color of the dot indicates the relative expression and the size of the dot indicates the expressed percentage. k Correlation heatmap shows the similarities between human iPSC-derived NC cells and mouse in vivo enteric/non-enteric NC cells at E13.5 from two independent datasets. Sequencing platforms of datasets are noted. Source data are provided as a Source Data file.
Fig. 2
Fig. 2. Reconstruction of disease severity axis integrating different HSCR states.
a Hierarchical clustering by average gene expression. b PCA projection of cells in Cluster 1 based on gene expression profile after excluding the TCA-HSCR-iPSC-line (HSCR#6). c Distribution of cells along PC2 is highly associated with disease severity, as shown in beeswarm, density, and boxplots. Colored by type of HSCR. 379 IMR90 cells, 375 UE02302 cells, 161 HSCR#5 cells, 296 HSCR#10 cells, 186 HSCR#20 cells, 306 HSCR#1 cells, 187 HSCR#17 cells, and 246 HSCR#23 cells were included. d The expression dynamics of 833 top DEGs were cataloged into four major modules, colored by modules. Thick lines indicate the average gene expression patterns of each module. All 2136 cells ordered by severity axis were included to fit the expression curve. e Gene signatures and expression dynamics of representative genes in each gene module. The relative expression levels of these genes are shown as a LOESS smooth fit line (colored line) and the best-fit lines (gray lines) in linear regression. S slope, P P value of linear regression. f Gene ontology analyses of each gene module. P value and FDR were calculated by clusterProfiler software. gj Overall pathway scores of neurogenesis, proliferation, RNA splicing, and energy metabolism. A two-sided Wilcoxon rank-sum test was applied to calculate the significance of the difference between the two groups. All samples (two controls with 754 cells, three S-HSCR with 643 cells, intermediated HSCR#1 with 306 cells, and two L-HSCR with 433 cells) were included for comparison and presented as groups. Tests marked by “****”, “***”, “**”, and “*” represent they are statistically different from the controls of P values <0.0001, <0.001, <0.01, and <0.05, respectively. ns not significantly different. In all the boxplots, each box represents the interquartile range (IQR, the range between the 25th and 75th percentile) with the mid-point of the data, whiskers indicate the upper and lower value within 1.5 times the IQR.
Fig. 3
Fig. 3. Identification of a functionally enriched gene set and HDAC1 as a key regulator along HSCR severity axis.
a Anchoring of the functionally enriched gene set to severity axis with 2136 cells, colored by log2 fold-change (Log2FC) and HDAC1 targets are marked by asterisks. Log2FC was calculated by comparing all HSCR cases to two controls. Box indicates the confidence interval of activated (red) or repressed (blue) ‘period’ at the severity axis for each gene. b Protein–protein interaction (PPI) network of the core gene set. NC, neural crest. c Motif enrichment of HDAC1 at the promoter region (−2 to 1 kb relative to TSS) of its target genes. HDAC1 DNA-binding motif is shown in the left panel. TSS transcription start site. P values (Pval) were calculated by meme FIMO software. d Dynamic expression of HDAC1 and its activated target genes along the disease severity axis. Gene expression (log2(TPM + 1)) was used to fit the smooth line using all 2136 cells. TPM, Transcript per million. Correlations between HDAC1 and its target genes are shown at the bottom panel (calculated by the R cor function). The significance of the correlation testing are marked by an asterisk. P values <0.05 and <0.001 are marked by * and **. e t-SNE projection of cells based on GRN analysis. mRNA (yellow) and binary regulon activity (active (blue) or inactive (gray)) inferred by SCENIC are shown. The overall activities of HDAC1 targeted GRN in control and S/L-HSCR are shown in the boxplot. t-SNE was generated based on overall regulon activities from the SCENIC analysis. A two-sided Wilcoxon rank-sum test was applied to calculate the significance of the difference between the two groups. All samples (two controls with 754 cells, four S-HSCR with 949 cells, and two L-HSCR with 433 cells) were included for comparison and presented as groups. Boxplot represents the interquartile range (showing median, 25th and 75th percentile, and 1.5. the interquartile range). Tests marked by “****” and “**” represent they are statistically different from the controls of P values <0.0001 and <0.01, respectively. ns not significantly different. In all the boxplots, each box represents the interquartile range (IQR, the range between the 25th and 75th percentile) with the mid-point of the data, whiskers indicate the upper and lower value within 1.5 times the IQR. f Scatterplot shows putative HDAC1-activated (red) and repressed (blue) targeted genes. Key genes are labeled. The distribution of the correlation between HDAC1 and other genes is shown at the top panel. g Gene ontology (GO) enrichment analyses of HDAC1-activated and repressed targeted genes. P value and FDR were calculated by clusterProfiler software. h Immunocytochemistry shows the reduced cytoplasmic HDAC1 in HSCR-ENCCs. i In vitro differentiation assays in the absence or presence of HDAC1 morpholino (HDAC1-MO, 5 μM). Cells were harvested for immunofluorescence staining on day 5 of neuronal differentiation. Data were presented as mean values ± SEM from 3–7 independent experiments. (Student’s t-test, two-sided). Source data are provided as a Source Data file.
Fig. 4
Fig. 4. Global analysis of RNA alternative splicing (AS) events in control- and HSCR-ENCCs.
a Heatmap shows the top 37 upregulated AS mediator genes enriched in HSCR#1 and L-HSCR. b Normalized number of splices in control- and HSCR-ENCCs. P values (two-sided Mann–Whitney U-test) from comparing ENCCs derived from the two controls with 754 cells and various HSCR groups (three S-HSCR with 643 cells and two L-HSCR with 433 cells) are shown. The splicing frequency of each cell was estimated by the number of splices divided by the uniquely mapped read number. Tests marked by “***” represent they are statistically different from the controls of P values <0.001. ns not significantly different. In the violin plot, each violin represents the kernel probability density of the data at different values. An inner boxplot indicates the interquartile range (IQR, the range between the 25th and 75th percentile) with the mid-point of the data. c Number of different types of RNA splicing events in control- and HSCR-ENCCs. ENCCs at high disease states (HSCR#1, 17 and 23) were compared to those in low disease states (two controls and three S-HSCR-ENCCs) (P < 0.05, two-sided t-test). d The 37 RNA-splicing regulator genes are significantly upregulated and positively correlated with AS frequency in HSCR#1- and two L-HSCR-ENCCs. All 2136 cells were included to fit the linear regression. P value shows the significance of the fitting (calculated by R lm function). e PCA projection of single cells based on AS events reveals that PC2 is highly associated with disease severity. f Top AS events positively and negatively contributed to PC2. Putative targets of PTBP1 (1) (Inclusion of exon 9) are labeled in red. g Significant differentially splicing events between control and S/L-HSCR (two-sided t-test). Two controls, four S-HSCR, and two L-HSCR were included for comparison, where a single PSI value was calculated for each sample. P values <0.05 and <0.001 are marked by ** and ***. h Transcriptional (gene expression) and post-transcriptional (RNA splicing) levels represent two complementary dimensions describing the progression of HSCR disease. PCs described in Figs. 2c and 4f were selected to represent the transcriptional (gene expression) and post-transcriptional (RNA splicing) levels of cells.
Fig. 5
Fig. 5. Inclusion of PTBP1 exon 9 is associated with dysregulation of cellular metabolic pathways in L-HSCR-ENCCs.
a Boxplot shows the percent spliced in (PSI) of exon 9 (Ex9) inclusion rate in PTBP1. Each HSCR-ENCC (HSCR#1 with 306 cells, HSCR#17 with 187 cells, and HSCR#23 with 246 cells) was compared to the merged controls with 754 cells. Each box represents the interquartile range (IQR, the range between the 25th and 75th percentile) with the mid-point of the data, whiskers indicate the upper and lower value within 1.5 times the IQR. Tests marked by “**” represent they are statistically different (two-sided Wilcoxon rank-sum test) from the controls of P values <0.01. ns not significantly different. b Scatterplot shows the enhanced and repressed exons associated with PTBP1 Ex9 enriched in L-HSCR. SE9: skipped exon 9. c Venn plots shows the PTBP1 Ex9 -enhanced and -repressed exons enriched in L-HSCR overlapping with the known PTBP1-target exons. d Gene ontology enrichment analyses of genes enriched with target exons of PTBP1-Ex9 in L-HSCR. P value and FDR were calculated by clusterProfiler software. e Schematic shows the regulation of PKM1/2 splicing regulated by PTBP1-Ex9. SE: skipped exon; MXE mutually exclusion of exon. Differentially splicing of PKM1 and PKM2 between control, S-HSCR, and L-HSCR. Two controls were merged for comparison. f RT-qPCR analyses of PTBP1, PKM1, and PKM2 expressions in ENCCs derived from the control- and various HSCR-iPSC lines. Data were presented as mean values ± SEM from 3–6 independent experiments. (Student’s t-test, two-sided). g Boxplot shows the reduced oxidative phosphorylation pathway scores in HSCR-ENCCs as inferred based on the expression of the genes implicated in these pathways. A two-sided Wilcoxon rank-sum test was applied to calculate the significance of the difference between the two groups. All samples (two controls with 754 cells, three S-HSCR with 643 cells, intermediated HSCR#1 with 306 cells, and two L-HSCR with 433 cells) were included for comparison and presented as groups. Tests marked by “****”, “***”, “**”, and “*” represent they are statistically different from the controls of P values <0.0001, <0.001, <0.01, and <0.05, respectively. ns not significantly different. Seahorse assays show oxygen consumption rate (OCR) in h control (IMR90), S-HSCR, and L-HSCR control and k control (IMR90)- and HSCR-ENCCs treated with control-, PKM1-, or PKM2- morpholinos (MO) (four independent experiments). Quantitative analyses of the i, l basal OCR and j, m maximum respiratory rate in the control and HSCR-ENCCs with or without morpholino treatment. Data were presented as mean values ± SEM from 3–10 independent experiments. (Student’s t-test, two-sided). In vitro differentiation assays show NF+ neurons derived from n control (IMR90 & UE02302)-ENCCs treated with PKM1-MO; and o HSCR-ENCCs treated with PKM2-MO, on day 5 of neuronal differentiation. Data were presented as mean values ± SEM from 3–7 independent experiments. (Student’s t-test, two-sided). Source data are provided as a Source Data file.
Fig. 6
Fig. 6. Hedgehog-induced metabolic shift in ENCCs.
Heatmaps show genes implicated in a glycolysis and b fatty acid metabolism pathways in ENCCs upon the SAG treatment. c Seahorse assays of control-ENCCs treated with SAG or cyclopamine (1 nM, CycLow). (Mean ± SEM, n = 4). Dot plots from three independent experiments show the changes in d the basal oxygen consumption rate (OCR) to extracellular acidification rate (ECAR) ratios and e the maximum respiration rates upon different treatments (mean ± SEM, n = 4, Student’s t-test, two-sided). f Western blot shows the alternations of AMPK-PKM2-PDHA1 pathway in ENCCs subjected to SAG, cyclopamine (100 nM, Cychigh and 1 nM, CycLow) treatments. Representative images from three independent analyses are shown. The samples were derived from the same experiment, and the gels/blots were processed in parallel. Bar charts show g ATP (n = 5), h lactate (n = 3), i pyruvate (n = 3), and j MTT (n = 11) assays in the presence or absence of SAG or CycLow. Bar charts show the mean values ± SEM from independent experiments (Student’s t-test, two-sided). k Seahorse assays of ENCCs treated with SAG and CycLow in the absence or presence of FAO inhibitor (Etomoxir, ETO). Means of OCR ± SEM from three independent experiments are shown. l Bar chart shows the maximum respiration rates (mean ± SEM, n = 4, Student’s t-test, two-sided). m Mitochondria activities in ENCCs were monitored using the Mitotracker assay. The black line marks the mean values ± SEM from four independent experiments. n Immunocytochemistry of TUJ1+ and NF+ neurons in day 5 of neuronal differentiation. Bar charts show the mean values ± SEM from 4–6 independent experiments (Student’s t-test, two-sided). Source data are provided as a Source Data file.
Fig. 7
Fig. 7. Hedgehog-induced OXPHOS rescues the differentiation defect of HSCR-ENCCs.
a Mitochondria activities in HSCR-ENCCs treated with FAO agonist (GW9508), SAG, and SAG in combination with ETO were monitored using the Mitotracker assay. The corresponding quantitative analyses of mitochondria activities in HSCR#20- and HSCR#17-ENCCs from three independent experiments are shown in (b, c). Black lines mark the mean values ± SEM. d Immunocytochemistry of TUJ1+ and NF+ neurons on day 5 of neuronal differentiation. e Bar charts show mean values ± SEM from 3–4 independent experiments (Student’s t-test, two-sided). f Schematic shows the differentiation strategy for the generation of HSCR-ENCCs. g Immunocytochemistry of TUJ1+ and TH+ neurons on day 9 of the neuronal differentiation of control and HSCR-ENCC with or without pretreatment with SAG. h The bar charts show the mean values ± SEM from independent experiments. Data points obtained from independent experiments are shown (two-way ANOVA test). i Schematic shows that Hedgehog-mediated glycolysis and FAO regulate the survival and differentiation of ENCCs. Source data are provided as a Source Data file.
Fig. 8
Fig. 8. Schematic summaries of the key molecular and cellular processes associated with HSCR pathogenesis and severity.
A core gene set associated with the severity of HSCR was identified. Additional alternations in genes implicated in RNA splicing and oxidative phosphorylation (OXPHOS) were found in L-HSCR cases. High HDAC1 activity is associated with defective neuronal differentiation, as observed in HSCR-ENCCs. Only the representative genes/pathways are shown.

Similar articles

Cited by

References

    1. Schuchardt A, D’Agati V, Larsson-Blomberg L, Costantini F, Pachnis V. Defects in the kidney and enteric nervous system of mice lacking the tyrosine kinase receptor Ret. Nature. 1994;367:380–383. doi: 10.1038/367380a0. - DOI - PubMed
    1. Emison ES, et al. Differential contributions of rare and common, coding and noncoding Ret mutations to multifactorial Hirschsprung disease liability. Am. J. Hum. Genet. 2010;87:60–74. doi: 10.1016/j.ajhg.2010.06.007. - DOI - PMC - PubMed
    1. Tang CS, et al. Identification of genes associated with Hirschsprung disease, based on whole-genome sequence analysis, and potential effects on enteric nervous system development. Gastroenterology. 2018;155:1908–1922 e1905. doi: 10.1053/j.gastro.2018.09.012. - DOI - PubMed
    1. Garcia-Barcelo MM, et al. Genome-wide association study identifies NRG1 as a susceptibility locus for Hirschsprung’s disease. Proc. Natl Acad. Sci. USA. 2009;106:2694–2699. doi: 10.1073/pnas.0809630105. - DOI - PMC - PubMed
    1. Le, T. L. et al. Dysregulation of the NRG1/ERBB pathway causes a developmental disorder with gastrointestinal dysmotility in humans. J. Clin. Invest.10.1172/jci145837 (2021). - PMC - PubMed

Publication types

MeSH terms

Substances