

Brainstem neuromelanin and iron MRI reveals a precise signature for idiopathic and LRRK2 Parkinson's disease
- PMID: 37061532
- PMCID: PMC10105708
- DOI: 10.1038/s41531-023-00503-2
Brainstem neuromelanin and iron MRI reveals a precise signature for idiopathic and LRRK2 Parkinson's disease
Abstract
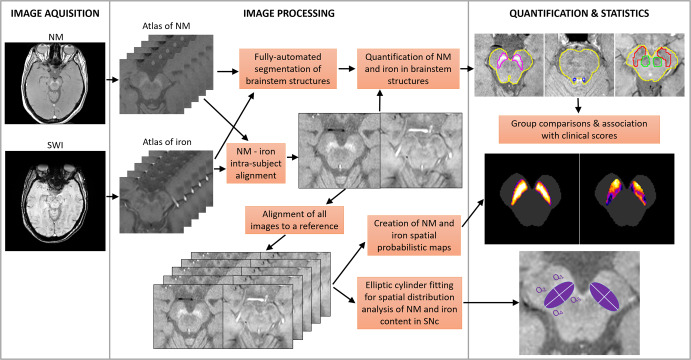
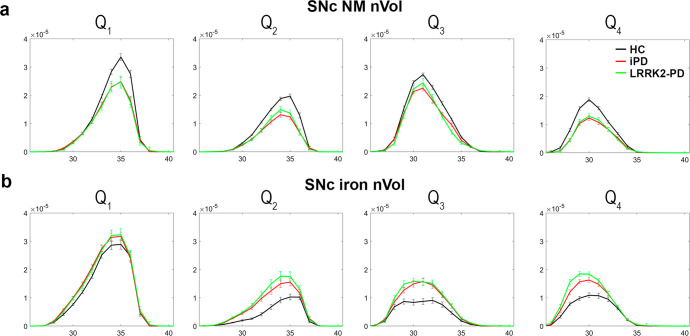
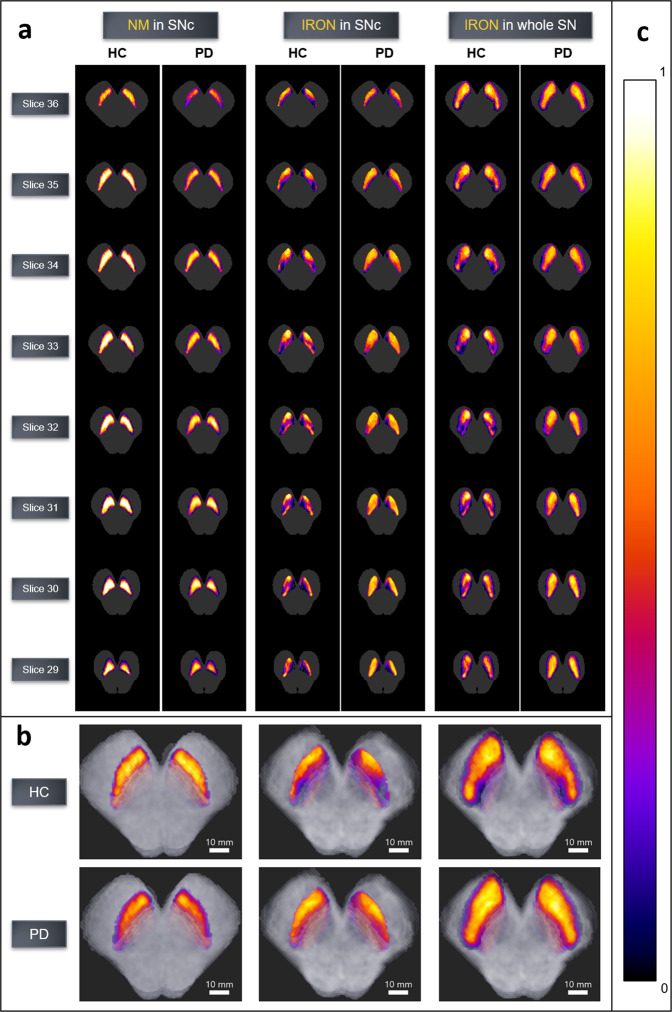
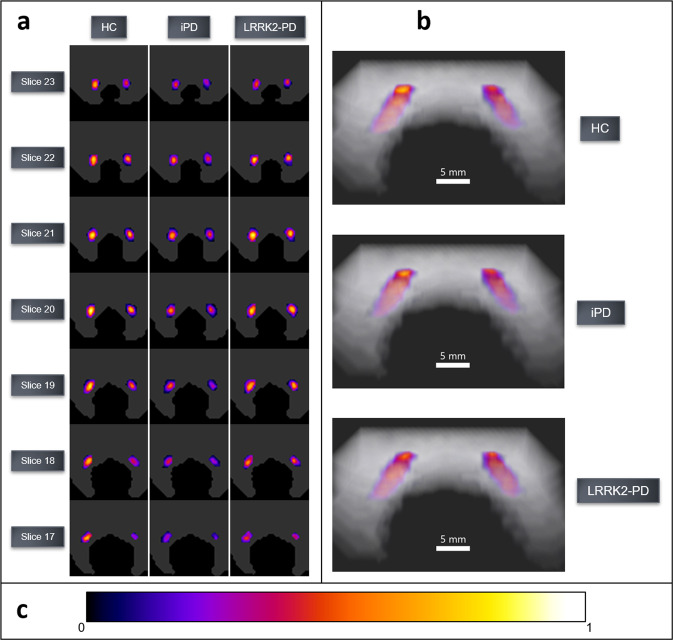
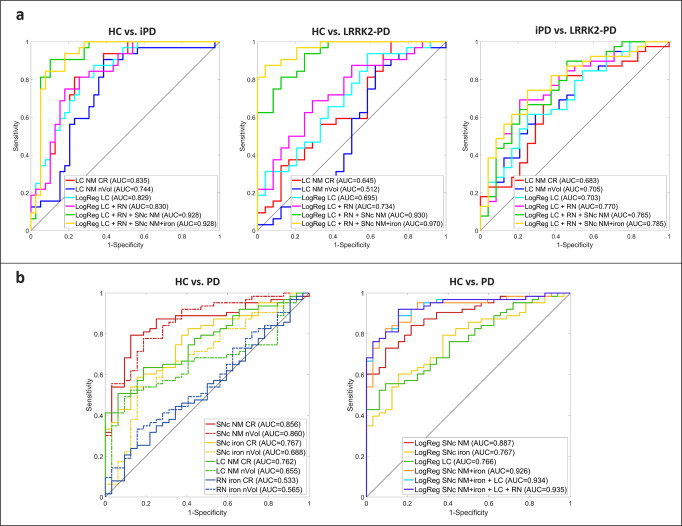
Neuromelanin (NM) loss in substantia nigra pars compacta (SNc) and locus coeruleus (LC) reflects neuronal death in Parkinson's disease (PD). Since genetically-determined PD shows varied clinical expressivity, we wanted to accurately quantify and locate brainstem NM and iron, to discover whether specific MRI patterns are linked to Leucine-rich repeat kinase 2 G2019S PD (LRRK2-PD) or idiopathic Parkinson's disease (iPD). A 3D automated MRI atlas-based segmentation pipeline (3D-ABSP) for NM/iron-sensitive MRI images topographically characterized the SNc, LC, and red nucleus (RN) neuronal loss and calculated NM/iron contrast ratio (CR) and normalized volume (nVol). Left-side NM nVol was larger in all groups. PD had lower NM CR and nVol in ventral-caudal SNc, whereas iron increased in lateral, medial-rostral, and caudal SNc. The SNc NM CR reduction was associated with psychiatric symptoms. LC CR and nVol discriminated better among subgroups: LRRK2-PD had similar LC NM CR and nVol as that of controls, and larger LC NM nVol and RN iron CR than iPD. PD showed higher iron SNc nVol than controls, especially among LRRK2-PD. ROC analyses showed an AUC > 0.92 for most pairwise subgroup comparisons, with SNc NM being the best discriminator between HC and PD. NM measures maintained their discriminator power considering the subgroup of PD patients with less than 5 years of disease duration. The SNc iron CR and nVol increase was associated with longer disease duration in PD patients. The 3D-ABSP sensitively identified NM and iron MRI patterns strongly correlated with phenotypic PD features.
© 2023. The Author(s).
Conflict of interest statement
Pastor P. received honoraria from Ipsen. The remaining authors declare no competing interests.
Figures

Similar articles
-
Automatic Segmentation and Quantification of Nigrosome-1 Neuromelanin and Iron in MRI: A Candidate Biomarker for Parkinson's Disease.J Magn Reson Imaging. 2024 Aug;60(2):534-547. doi: 10.1002/jmri.29073. Epub 2023 Nov 2. J Magn Reson Imaging. 2024. PMID: 37915245
-
Automated neuromelanin imaging as a diagnostic biomarker for Parkinson's disease.Mov Disord. 2015 Jun;30(7):945-52. doi: 10.1002/mds.26201. Epub 2015 Mar 15. Mov Disord. 2015. PMID: 25772492
-
Neuromelanin-sensitive MRI correlates of cognitive and motor function in Parkinson's disease with freezing of gait.medRxiv [Preprint]. 2023 Jul 6:2023.07.04.23292227. doi: 10.1101/2023.07.04.23292227. medRxiv. 2023. PMID: 37461735 Free PMC article. Updated. Preprint.
-
7 Tesla magnetic resonance imaging: a closer look at substantia nigra anatomy in Parkinson's disease.Mov Disord. 2014 Nov;29(13):1574-81. doi: 10.1002/mds.26043. Epub 2014 Oct 12. Mov Disord. 2014. PMID: 25308960 Review.
-
Imaging of Substantia Nigra in Parkinson's Disease: A Narrative Review.Brain Sci. 2021 Jun 9;11(6):769. doi: 10.3390/brainsci11060769. Brain Sci. 2021. PMID: 34207681 Free PMC article. Review.
Cited by
-
Midbrain and pallidal iron changes identify patients with REM sleep behaviour disorder and Parkinson's disease.NPJ Parkinsons Dis. 2025 Apr 23;11(1):84. doi: 10.1038/s41531-025-00916-1. NPJ Parkinsons Dis. 2025. PMID: 40268921 Free PMC article.
-
New Aspects Regarding the Fluorescence Spectra of Melanin and Neuromelanin in Pigmented Human Tissue Concerning Hypoxia.Int J Mol Sci. 2024 Aug 2;25(15):8457. doi: 10.3390/ijms25158457. Int J Mol Sci. 2024. PMID: 39126026 Free PMC article.
-
Diagnostic utility of 7T neuromelanin imaging of the substantia nigra in Parkinson's disease.NPJ Parkinsons Dis. 2024 Jan 8;10(1):13. doi: 10.1038/s41531-024-00631-3. NPJ Parkinsons Dis. 2024. PMID: 38191546 Free PMC article.
-
Increased iron in the substantia nigra pars compacta identifies patients with early Parkinson'sdisease: A 3T and 7T MRI study.Neuroimage Clin. 2024;41:103577. doi: 10.1016/j.nicl.2024.103577. Epub 2024 Feb 17. Neuroimage Clin. 2024. PMID: 38377722 Free PMC article.
-
Regional nigral neuromelanin degeneration in asymptomatic leucine-rich repeat kinase 2 gene carrier using MRI.Sci Rep. 2024 May 9;14(1):10621. doi: 10.1038/s41598-024-59074-8. Sci Rep. 2024. PMID: 38729969 Free PMC article.
References
-
- Zecca L, et al. Neuromelanin can protect against iron‐mediated oxidative damage in system modeling iron overload of brain aging and Parkinson’s disease. J. Neurochem. 2008;106:1483–149. - PubMed
LinkOut - more resources
Full Text Sources
Miscellaneous
