

Neurocomputational mechanisms of food and physical activity decision-making in male adolescents
- PMID: 37061558
- PMCID: PMC10105706
- DOI: 10.1038/s41598-023-32823-x
Neurocomputational mechanisms of food and physical activity decision-making in male adolescents
Abstract
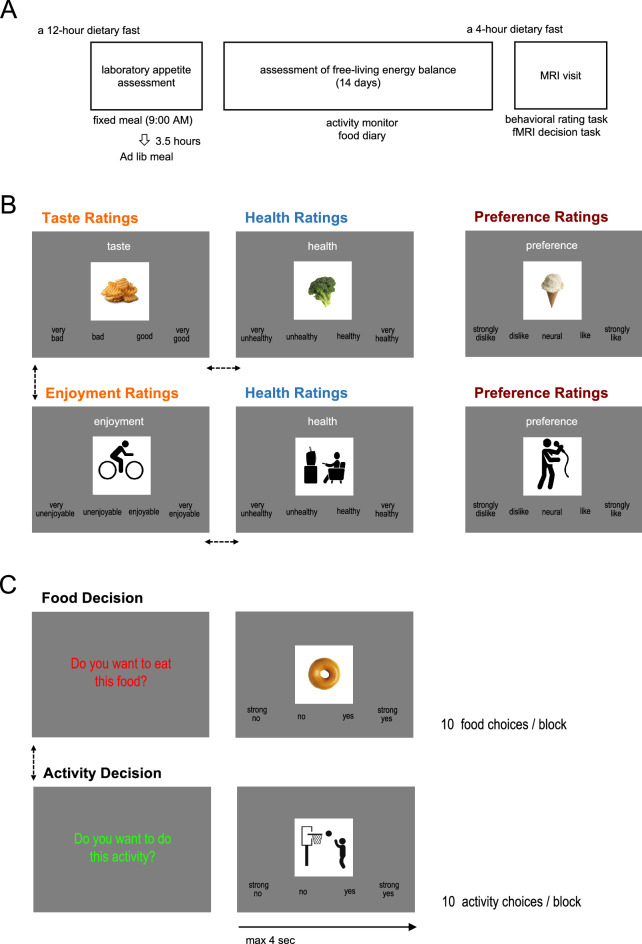
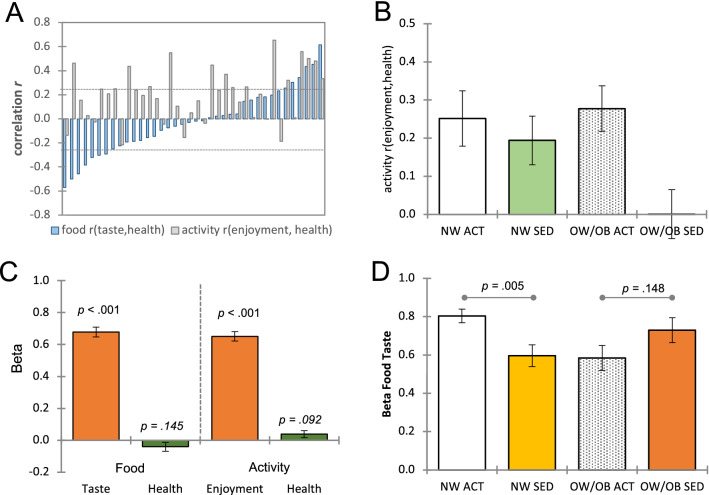
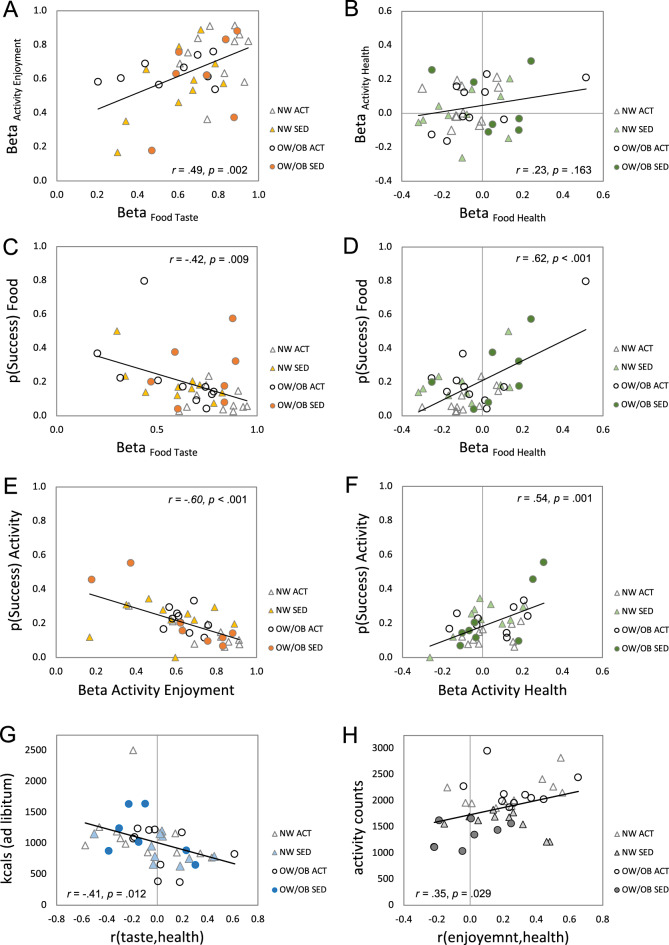
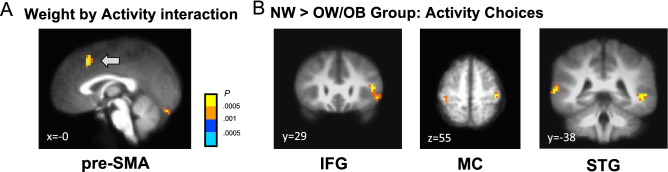
We examined the neurocomputational mechanisms in which male adolescents make food and physical activity decisions and how those processes are influenced by body weight and physical activity levels. After physical activity and dietary assessments, thirty-eight males ages 14-18 completed the behavioral rating and fMRI decision tasks for food and physical activity items. The food and physical activity self-control decisions were significantly correlated with each other. In both, taste- or enjoyment-oriented processes were negatively associated with successful self-control decisions, while health-oriented processes were positively associated. The correlation between taste/enjoyment and healthy attribute ratings predicted actual laboratory food intake and physical activities (2-week activity monitoring). fMRI data showed the decision values of both food and activity are encoded in the ventromedial prefrontal cortex, suggesting both decisions share common reward value-related circuits at the time of choice. Compared to the group with overweight/obese, the group with normal weight showed stronger brain activations in the cognitive control, multisensory integration, and motor control regions during physical activity decisions. For both food and physical activity, self-controlled decisions utilize similar computational and neurobiological mechanisms, which may provide insights into how to promote healthy food and physical activity decisions.
© 2023. The Author(s).
Conflict of interest statement
The authors declare no competing interests.
Figures

Similar articles
-
Real-time fMRI neurofeedback training to improve eating behavior by self-regulation of the dorsolateral prefrontal cortex: A randomized controlled trial in overweight and obese subjects.Neuroimage. 2019 May 1;191:596-609. doi: 10.1016/j.neuroimage.2019.02.033. Epub 2019 Feb 21. Neuroimage. 2019. PMID: 30798010 Clinical Trial.
-
Development and body mass inversely affect children's brain activation in dorsolateral prefrontal cortex during food choice.Neuroimage. 2019 Nov 1;201:116016. doi: 10.1016/j.neuroimage.2019.116016. Epub 2019 Jul 13. Neuroimage. 2019. PMID: 31310861
-
The Influence of Televised Food Commercials on Children's Food Choices: Evidence from Ventromedial Prefrontal Cortex Activations.J Pediatr. 2016 Oct;177:27-32.e1. doi: 10.1016/j.jpeds.2016.06.067. Epub 2016 Aug 12. J Pediatr. 2016. PMID: 27526621 Free PMC article.
-
Volitional regulation of brain responses to food stimuli in overweight and obese subjects: A real-time fMRI feedback study.Appetite. 2017 May 1;112:188-195. doi: 10.1016/j.appet.2017.01.032. Epub 2017 Jan 25. Appetite. 2017. PMID: 28131758
-
Reward activity in satiated overweight women is decreased during unbiased viewing but increased when imagining taste: an event-related fMRI study.Int J Obes (Lond). 2012 May;36(5):627-37. doi: 10.1038/ijo.2011.213. Epub 2011 Nov 8. Int J Obes (Lond). 2012. PMID: 22064161
Cited by
-
The role of emotion in eating behavior and decisions.Front Psychol. 2023 Dec 7;14:1265074. doi: 10.3389/fpsyg.2023.1265074. eCollection 2023. Front Psychol. 2023. PMID: 38130967 Free PMC article. Review.
-
Investigating psychological mechanisms of self-controlled decisions for food and leisure activity.J Behav Med. 2024 Jun;47(3):458-470. doi: 10.1007/s10865-024-00469-3. Epub 2024 Feb 11. J Behav Med. 2024. PMID: 38342789
-
Salience network resting-state functional connectivity predicts self-controlled decision-making.Sci Rep. 2025 May 10;15(1):16332. doi: 10.1038/s41598-025-98673-x. Sci Rep. 2025. PMID: 40348817 Free PMC article.
References
Publication types
MeSH terms
Grants and funding
LinkOut - more resources
Full Text Sources
Medical
