. 2023 Apr 15;13(1):6187.
doi: 10.1038/s41598-023-33283-z.

Vessel noise exposures of harbour seals from the Wadden Sea

Affiliations

Vessel noise exposures of harbour seals from the Wadden Sea

Dominik André Nachtsheim et al. Sci Rep. .

Abstract

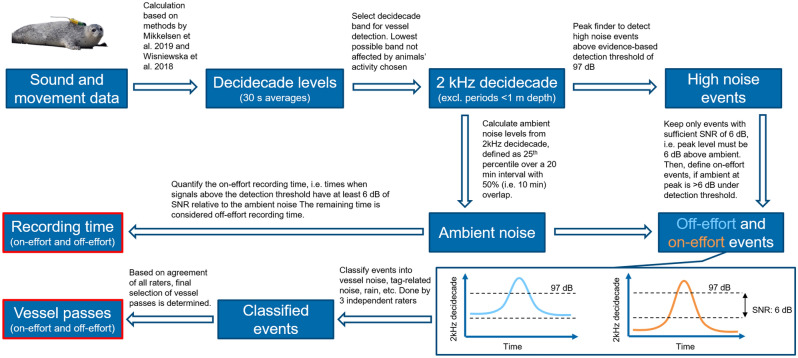
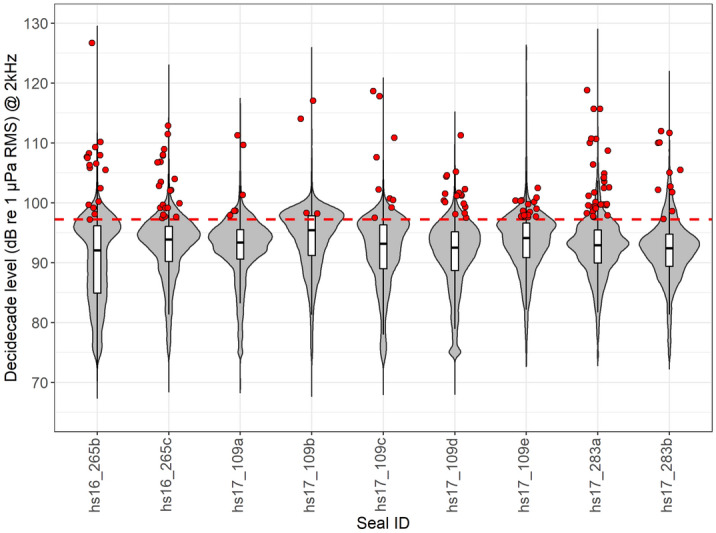
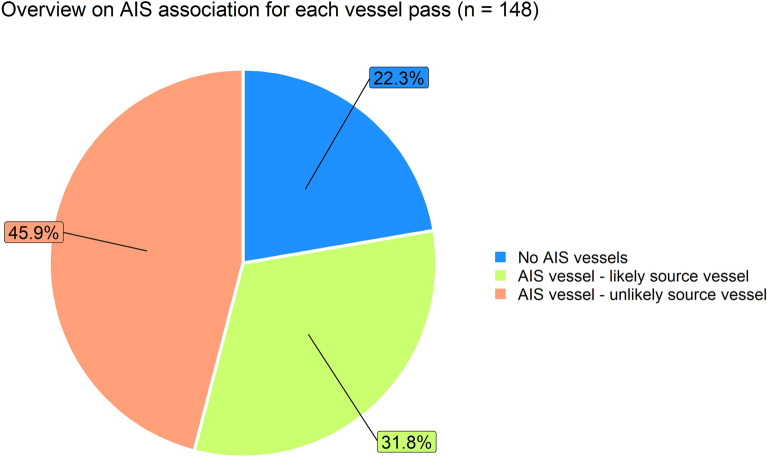
The North Sea faces intense ship traffic owing to increasing human activities at sea. As harbour seals (Phoca vitulina) are abundant top predators in the North Sea, it is hypothesised that they experience repeated, high-amplitude vessel exposures. Here, we test this hypothesis by quantifying vessel noise exposures from deployments of long-term sound and movement tags (DTAGs) on nine harbour seals from the Wadden Sea. An automated tool was developed to detect intervals of elevated noise in the sound recordings. An assessment by multiple raters was performed to classify the source as either vessels or other sounds. A total of 133 vessel passes were identified with received levels > 97 dB re 1µPa RMS in the 2 kHz decidecade band and with ambient noise > 6 dB below this detection threshold. Tagged seals spent most of their time within Marine Protected Areas (89 ± 13%, mean ± SD) and were exposed to high-amplitude vessel passes 4.3 ± 1.6 times per day. Only 32% of vessel passes were plausibly associated with an AIS-registered vessel. We conclude that seals in industrialized waters are exposed repeatedly to vessel noise, even in areas designated as protected, and that exposures are poorly predicted by AIS data.


Conflict of interest statement

The authors declare no competing interests.

Figures

Figure 1
Figure 1
Workflow of the detection and classification of vessel passes, and definition of on-effort and off-effort periods.
Figure 2
Figure 2
Tracks of harbour seals (n = 9) in the North Sea. The red dots illustrate the locations of high level vessel passes during on-effort periods (n = 133). The tagging site Lorenzensplate is indicated by a black star. Harbour seals were tagged in three catches over two consecutive years. The map was created using ESRI ArcGIS, version 10.5.
Figure 3
Figure 3
Distribution of 2 kHz decidecade levels (dB re 1 µPa RMS), i.e., the RMS sound pressure level in the 2 kHz decidecade band, for each seal shown as violin plots. The small boxplots within the violins indicate the median and interquartile range of the distributions. The red dashed line illustrates the threshold (97 dB re 1 µPa) for vessel detections. The red points represent the maximum received levels of each vessel pass during on-effort periods (n = 133); the points are randomly spread horizontally to increase visibility.
Figure 4
Figure 4
Vessel pass with the highest maximum 2 kHz decidecade received level in the study. The top image shows a spectrogram of the power spectral density (PSD, i.e., power per 1 Hz band). The vessel noise in the recording is interrupted multiple times due to surfacing of the seal. The bottom image shows the corresponding 2 kHz decidecade band levels (blue line), computed as 30 s averages as described in the text, as well as broadband weighted sound pressure levels (SPL; orange line) from 500 Hz to 20 kHz following the frequency weighting for phocid seals in water (PCW) by Southall et al.. The red dashed line illustrates the 97 dB detection threshold used to detect high noise events in the 2 kHz decidecade band.
Figure 5
Figure 5
Overview of the association between recorded vessel noise exposures (n = 148) and AIS data. Blue shows the proportion in which either no AIS vessel or only stationary vessels were present in a 20 km radius. Light green illustrates the proportion of exposures in which an AIS registered vessel was likely the actual source of the noise exposure based on consistent shape parameters, whereas orange indicates the proportion of exposures where the recorded noise exposure cannot be attributed to any of the present AIS vessels.
Figure 6
Figure 6
Pie chart of ship types based on those vessel passes where the likely source vessels could be identified from the AIS data (n = 47).

References

    1. Frisk GV. Noiseonomics: The relationship between ambient noise levels in the sea and global economic trends. Sci. Rep. 2012;2:437. doi: 10.1038/srep00437. - DOI - PMC - PubMed
    1. Tournadre J. Anthropogenic pressure on the open ocean: The growth of ship traffic revealed by altimeter data analysis. Geophys. Res. Lett. 2014;41:7924–7932. doi: 10.1002/2014GL061786. - DOI
    1. Sertlek HÖ, Slabbekoorn H, ten Cate C, Ainslie MA. Source specific sound mapping: Spatial, temporal and spectral distribution of sound in the Dutch North Sea. Environ. Pollut. 2019;247:1143–1157. doi: 10.1016/j.envpol.2019.01.119. - DOI - PubMed
    1. Hildebrand JA. Anthropogenic and natural sources of ambient noise in the ocean. Mar. Ecol. Prog. Ser. 2009;395:5–20. doi: 10.3354/meps08353. - DOI
    1. Halpern BS, et al. A global map of human impact on marine ecosystems. Science. 2008;319:948–952. doi: 10.1126/science.1149345. - DOI - PubMed

Publication types