A proof-of-concept assay for quantitative and optical assessment of drug-induced toxicity in renal organoids
- PMID: 37061575
- PMCID: PMC10105743
- DOI: 10.1038/s41598-023-33110-5
A proof-of-concept assay for quantitative and optical assessment of drug-induced toxicity in renal organoids
Abstract
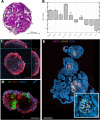
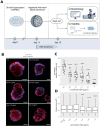
Kidneys are complex organs, and reproducing their function and physiology in a laboratory setting remains difficult. During drug development, potential compounds may exhibit unexpected nephrotoxic effects, which imposes a significant financial burden on pharmaceutical companies. As a result, there is an ongoing need for more accurate model systems. The use of renal organoids to simulate responses to nephrotoxic insults has the potential to bridge the gap between preclinical drug efficacy studies in cell cultures and animal models, and the stages of clinical trials in humans. Here we established an accessible fluorescent whole-mount approach for nuclear and membrane staining to first provide an overview of the organoid histology. Furthermore, we investigated the potential of renal organoids to model responses to drug toxicity. For this purpose, organoids were treated with the chemotherapeutic agent doxorubicin for 48 h. When cell viability was assessed biochemically, the organoids demonstrated a significant, dose-dependent decline in response to the treatment. Confocal microscopy revealed visible tubular disintegration and a loss of cellular boundaries at high drug concentrations. This observation was further reinforced by a dose-dependent decrease of the nuclear area in the analyzed images. In contrast to other approaches, in this study, we provide a straightforward experimental framework for drug toxicity assessment in renal organoids that may be used in early research stages to assist screen for potential adverse effects of compounds.
© 2023. The Author(s).
Conflict of interest statement
The authors declare no competing interests.
Figures


Similar articles
-
Formation and optimization of three-dimensional organoids generated from urine-derived stem cells for renal function in vitro.Stem Cell Res Ther. 2020 Jul 22;11(1):309. doi: 10.1186/s13287-020-01822-4. Stem Cell Res Ther. 2020. PMID: 32698872 Free PMC article.
-
Three-Dimensional Renal Organoids from Whole Kidney Cells: Generation, Optimization, and Potential Application in Nephrotoxicology In Vitro.Cell Transplant. 2020 Jan-Dec;29:963689719897066. doi: 10.1177/0963689719897066. Cell Transplant. 2020. PMID: 32166969 Free PMC article.
-
Unravelling Mechanisms of Doxorubicin-Induced Toxicity in 3D Human Intestinal Organoids.Int J Mol Sci. 2022 Jan 24;23(3):1286. doi: 10.3390/ijms23031286. Int J Mol Sci. 2022. PMID: 35163210 Free PMC article.
-
The "3Ds" of Growing Kidney Organoids: Advances in Nephron Development, Disease Modeling, and Drug Screening.Cells. 2023 Feb 8;12(4):549. doi: 10.3390/cells12040549. Cells. 2023. PMID: 36831216 Free PMC article. Review.
-
Drug discovery through stem cell-based organoid models.Adv Drug Deliv Rev. 2014 Apr;69-70:19-28. doi: 10.1016/j.addr.2014.02.006. Epub 2014 Feb 26. Adv Drug Deliv Rev. 2014. PMID: 24582599 Review.
Cited by
-
Landscape of human organoids: Ideal model in clinics and research.Innovation (Camb). 2024 Apr 1;5(3):100620. doi: 10.1016/j.xinn.2024.100620. eCollection 2024 May 6. Innovation (Camb). 2024. PMID: 38706954 Free PMC article. Review.
-
Progress of Induced Pluripotent Stem Cell-Derived Renal Organoids in Clinical Application.Kidney Dis (Basel). 2024 Nov 11;11(1):1-10. doi: 10.1159/000541919. eCollection 2025 Jan-Dec. Kidney Dis (Basel). 2024. PMID: 40093027 Free PMC article. Review.
-
Exploring the promising potential of induced pluripotent stem cells in cancer research and therapy.Mol Cancer. 2023 Nov 28;22(1):189. doi: 10.1186/s12943-023-01873-0. Mol Cancer. 2023. PMID: 38017433 Free PMC article. Review.
References
-
- Lancaster, M. A. et al. Cerebral organoids model human brain development and microcephaly. https://www.nature.com/articles/nature12517 (2013). - PMC - PubMed
Publication types
MeSH terms
Substances
LinkOut - more resources
Full Text Sources
Medical
Research Materials
Miscellaneous

