

Novel superpixel method to visualize fundus blood flow resistivity in healthy adults
- PMID: 37061579
- PMCID: PMC10105763
- DOI: 10.1038/s41598-023-33450-2
Novel superpixel method to visualize fundus blood flow resistivity in healthy adults
Abstract
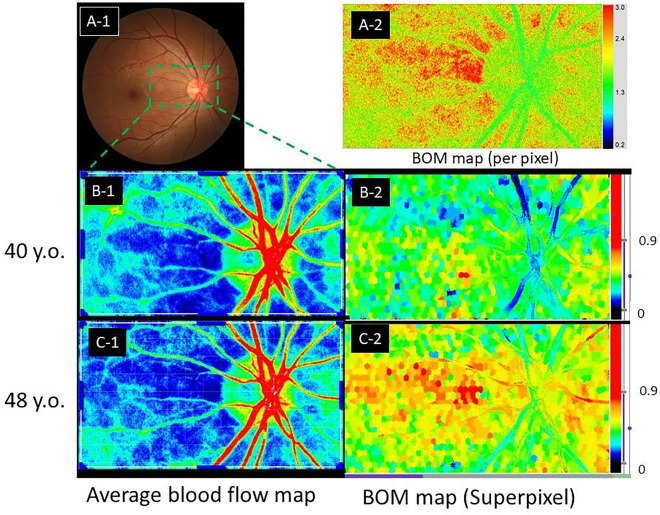
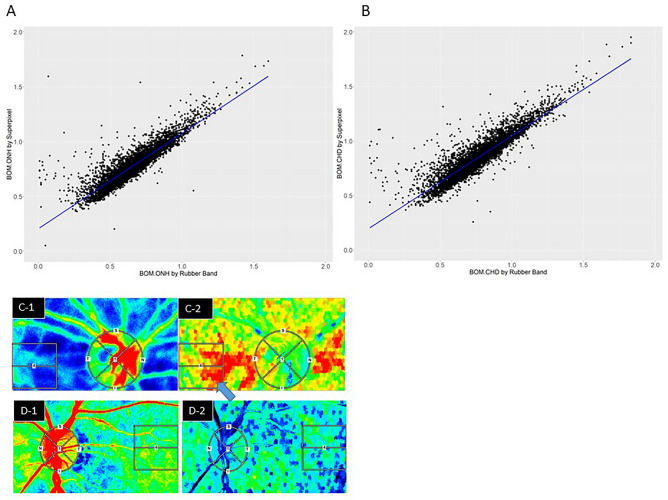
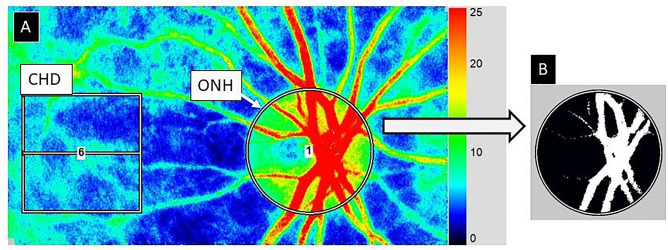
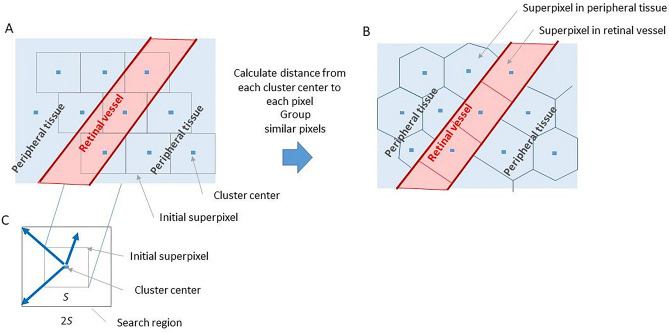
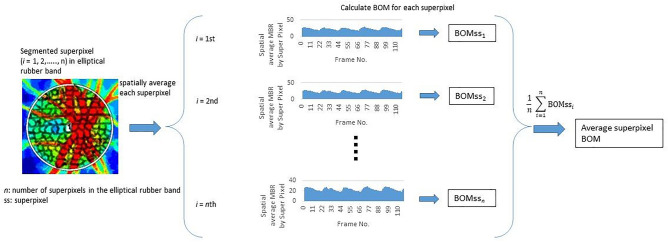
We aimed to perform superpixel segmentation of ocular blood flow maps obtained using laser speckle flowgraphy (LSFG) and investigate the effects of systemic parameters such as body weight, height, and sex on ocular blood flow resistivity. We studied 757 healthy participants (583 men, 174 women). We calculated the average beat strength over mean blur rate (BOM) as a LSFG resistivity index, as a function of age and sex using ordinary regions of interest (ROI) centered on the optic nerve head (ONH), the retinal vessels region and tissue around the ONH, and the choroid (CHD). We compared the ROI and superpixel-based methods, which are segmented based on image processing, for calculating the BOM. The sex differences in the BOM for the ONH, retinal-vessels region and tissue region of the ONH and CHD were significant for individuals aged ≤ 50 years (P < 0.01) but not those > 50 years old (P > 0.05). The average BOMs calculated using the ROI and superpixel methods were strongly correlated in the ONH (coefficient = 0.87, R2 = 0.8, P < 0.0001, n = 5465). In summary, a superpixel-segmented BOM map is suitable for two-dimensional visualization of ocular blood flow resistivity.
© 2023. The Author(s).
Conflict of interest statement
KO, NT, and HF are employed by Softcare Co., Ltd. TK, TS and YH declare no potential conflict of interest.
Figures

Similar articles
-
The Impact of Intraocular Pressure Elevation on Optic Nerve Head and Choroidal Blood Flow.Invest Ophthalmol Vis Sci. 2018 Jul 2;59(8):3488-3496. doi: 10.1167/iovs.18-23872. Invest Ophthalmol Vis Sci. 2018. PMID: 30025080
-
Relationship between laser speckle flowgraphy and optical coherence tomography angiography measurements of ocular microcirculation.Graefes Arch Clin Exp Ophthalmol. 2017 Aug;255(8):1633-1642. doi: 10.1007/s00417-017-3627-8. Epub 2017 May 1. Graefes Arch Clin Exp Ophthalmol. 2017. PMID: 28462456
-
Recent Clinical Applications of Laser Speckle Flowgraphy in Eyes with Retinal Disease.Asia Pac J Ophthalmol (Phila). 2016 Mar-Apr;5(2):151-8. doi: 10.1097/APO.0000000000000160. Asia Pac J Ophthalmol (Phila). 2016. PMID: 26649761
-
Use of the laser speckle flowgraphy in posterior fundus circulation research.Chin Med J (Engl). 2011 Dec;124(24):4339-44. Chin Med J (Engl). 2011. PMID: 22340410 Review.
-
[In vivo measurement of ocular circulation with the laser speckle method--development of apparatus and application in ophthalmological research].Nippon Ganka Gakkai Zasshi. 1999 Dec;103(12):871-909. Nippon Ganka Gakkai Zasshi. 1999. PMID: 10643292 Review. Japanese.
Cited by
-
Choroidal blood flow velocity and resistance in inferior posterior staphyloma using a novel superpixel technique in laser speckle flowgraphy.Sci Rep. 2025 Mar 26;15(1):10487. doi: 10.1038/s41598-025-88998-y. Sci Rep. 2025. PMID: 40140463 Free PMC article.
-
A Superpixel-Based Algorithm for Detecting Optical Density Changes in Choroidal Optical Coherence Tomography Images of Diabetic Patients.Sensors (Basel). 2025 Jun 9;25(12):3619. doi: 10.3390/s25123619. Sensors (Basel). 2025. PMID: 40573506 Free PMC article.
References
Publication types
MeSH terms
Associated data
- Actions
LinkOut - more resources
Full Text Sources
