. 2023 Jul;17(7):976-983.
doi: 10.1038/s41396-023-01410-3. Epub 2023 Apr 15.

Biogeographic patterns of biosynthetic potential and specialized metabolites in marine sediments

Affiliations

Biogeographic patterns of biosynthetic potential and specialized metabolites in marine sediments

Alexander B Chase et al. ISME J. 2023 Jul.

Abstract

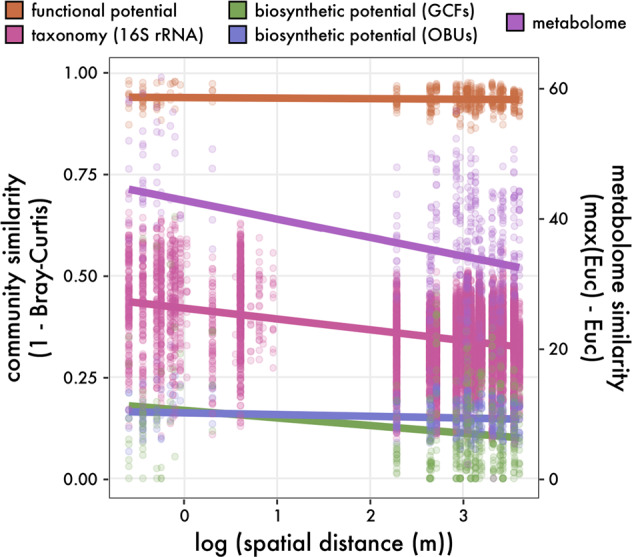
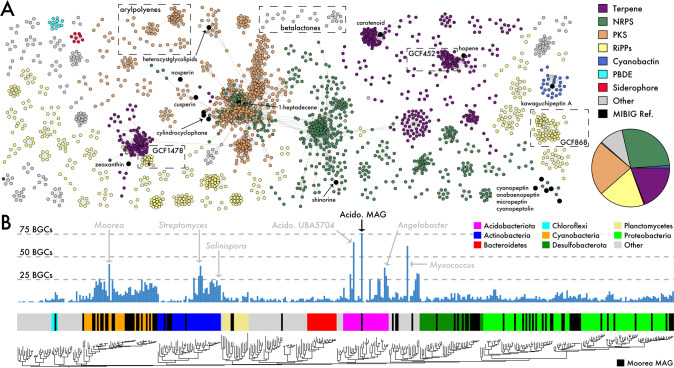
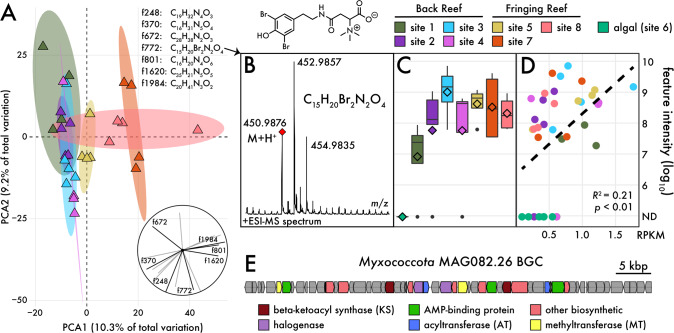
While the field of microbial biogeography has largely focused on the contributions of abiotic factors to community patterns, the potential influence of biotic interactions in structuring microbial communities, such as those mediated by the production of specialized metabolites, remains largely unknown. Here, we examined the relationship between microbial community structure and specialized metabolism at local spatial scales in marine sediment samples collected from the Long-Term Ecological Research (LTER) site in Moorea, French Polynesia. By employing a multi-omic approach to characterize the taxonomic, functional, and specialized metabolite composition within sediment communities, we find that biogeographic patterns were driven by local scale processes (e.g., biotic interactions) and largely independent of dispersal limitation. Specifically, we observed high variation in biosynthetic potential (based on Bray-Curtis dissimilarity) between samples, even within 1 m2 plots, that reflected uncharacterized chemical space associated with site-specific metabolomes. Ultimately, connecting biosynthetic potential to community metabolomes facilitated the in situ detection of natural products and revealed new insights into the complex metabolic dynamics associated with sediment microbial communities. Our study demonstrates the potential to integrate biosynthetic genes and metabolite production into assessments of microbial community dynamics.


Conflict of interest statement

The authors declare no competing interests.

Figures

Fig. 1
Fig. 1. Biogeography of microbial community structure in reef-associated marine sediments.
Solid lines denote the least squares linear regression across spatial scales for taxonomic, functional, biosynthetic potential (assessed based on both operational biosynthetic units (OBUs) of ketosynthase/condensation domains and gene cluster families (GCFs)), and community metabolomes. Each point represents a pairwise comparison between community samples with distances derived from Bray-Curtis metrics for all measurements except for metabolomes, which used Euclidean distances.
Fig. 2
Fig. 2. Biosynthetic potential across marine sediment communities.
A Similarity network of identified biosynthetic gene clusters (BGCs) clustered into gene cluster families (GCFs), colored by BGC classification. Inset pie chart depicts relative proportion of BGC classes. Black nodes indicate known reference BGCs from the MIBIG database. Singleton and doubleton GCFs not shown. B BGC distributions across the bacterial phylogeny colored by phyla. Moorea MAGs denoted in black. A subset of reference genomes/MAGs indicated in light gray.
Fig. 3
Fig. 3. Community metabolomes and candidate producers.
A Principal Component Analysis (PCA) showing differences in community metabolomes. Colored ellipses represent 75% confidence intervals around each site. Inset depicts contributions of the top molecular features to the principal dimensions with black lines denoting features with predicted molecular formulas shown above. B MS2 fragmentation of feature772 with diagnostic bromination signature, calculated mass, and probable molecular structure. C Abundance of feature772 across sites based on feature intensity in MS1 chromatograms. Black bars represent medians, diamonds represent means. D Linear regression of feature772 with the abundance of Myxococcota MAG082.26 (assessed by reads per kilobase mapped, RPKM). E Candidate BGC for feature772. Arrows represent individual genes and colored by predicted function.

References

    1. Martiny JBH, Bohannan BJM, Brown JH, Colwell RK, Fuhrman JA, Green JL, et al. Microbial biogeography: putting microorganisms on the map. Nat Rev Microbiol. 2006;4:102–12. doi: 10.1038/nrmicro1341. - DOI - PubMed
    1. Hanson CA, Fuhrman JA, Horner-Devine MC, Martiny JBH. Beyond biogeographic patterns: processes shaping the microbial landscape. Nat Rev Microbiol. 2012;10:497–506. doi: 10.1038/nrmicro2795. - DOI - PubMed
    1. Martiny JBH, Eisen JA, Penn K, Allison SD, Horner-Devine MC. Drivers of bacterial β-diversity depend on spatial scale. Proc Natl Acad Sci USA. 2011;108:7850–4. doi: 10.1073/pnas.1016308108. - DOI - PMC - PubMed
    1. Atkinson S, Williams P. Quorum sensing and social networking in the microbial world. J R Soc Interface. 2009;6:959–78. doi: 10.1098/rsif.2009.0203. - DOI - PMC - PubMed
    1. Milke F, Wagner-Doebler I, Wienhausen G, Simon M. Selection, drift and community interactions shape microbial biogeographic patterns in the Pacific Ocean. ISME J. 2022;16:2653–65. doi: 10.1038/s41396-022-01318-4. - DOI - PMC - PubMed

Publication types