

Identification of novel biomarkers linking depressive disorder and Alzheimer's disease based on an integrative bioinformatics analysis
- PMID: 37061663
- PMCID: PMC10105463
- DOI: 10.1186/s12863-023-01120-x
Identification of novel biomarkers linking depressive disorder and Alzheimer's disease based on an integrative bioinformatics analysis
Abstract
Background: Previous reports revealed that a history of major depressive disorder (MDD) increased the risk of Alzheimer's disease (AD). The immune disorder is associated with MDD and AD pathophysiology. We aimed to identify differentially expressed immune-related genes (DEIRGs) that are involved in the pathogenesis of MDD and AD.
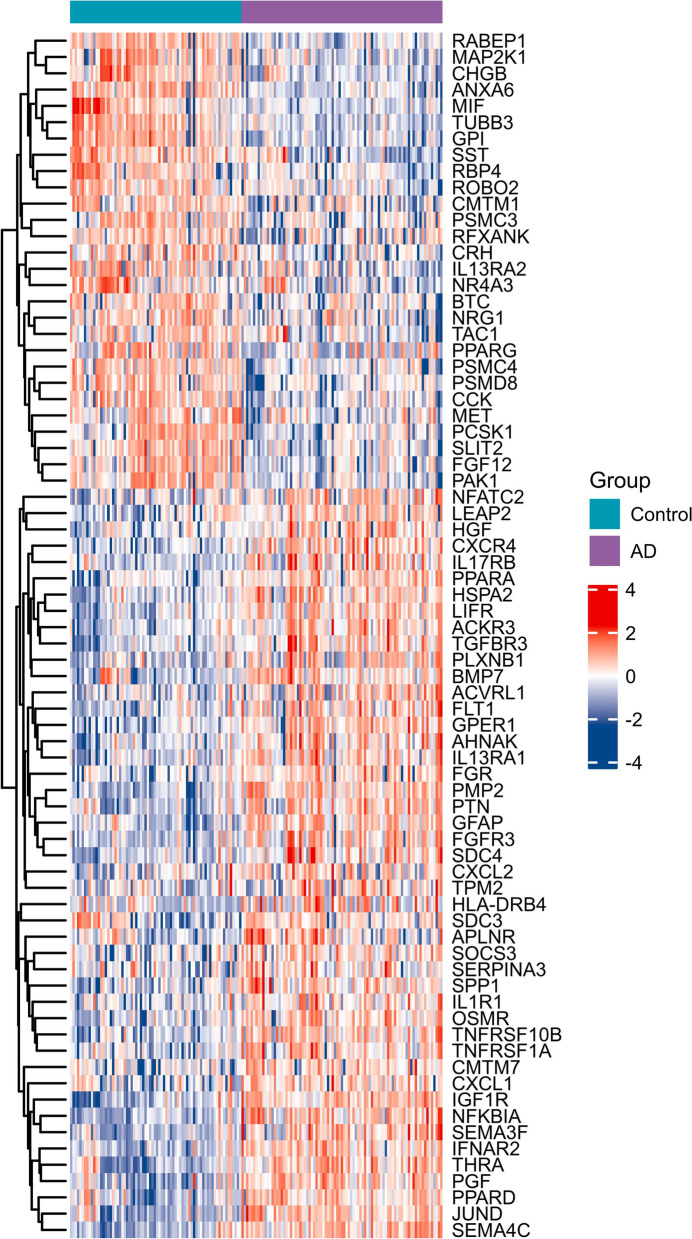
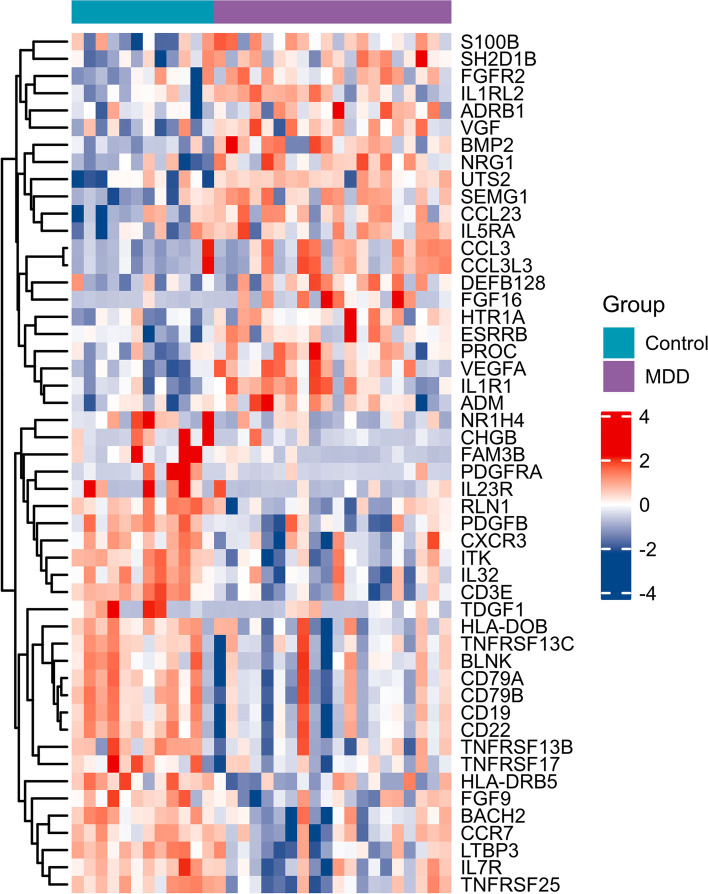
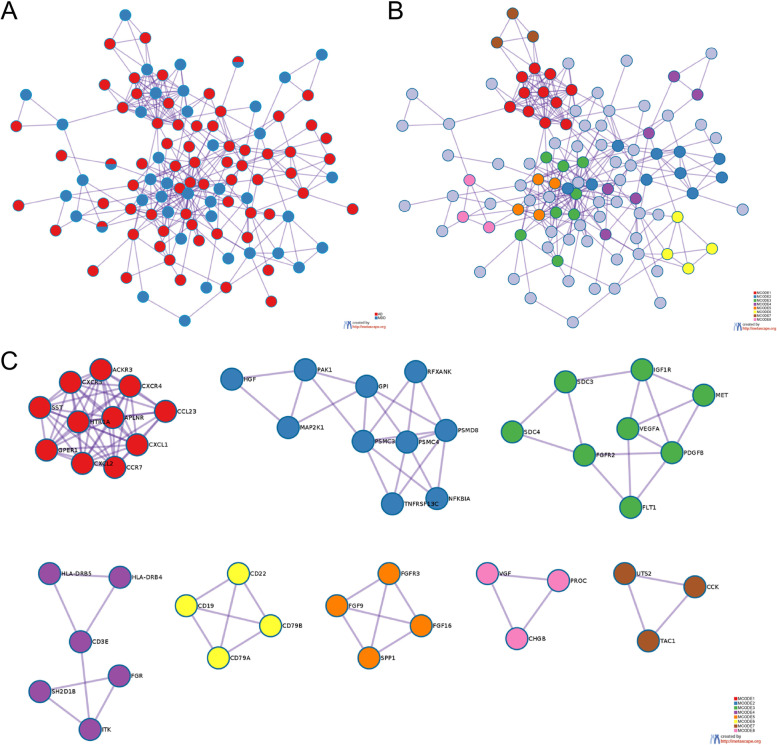
Methods: We downloaded mRNA expression profiles (GSE76826 and GSE5281) from the Gene Expression Omnibus (GEO) database. The R software was used to identify DEIRGs for the two diseases separately. Functional enrichment analysis and PPI network of DEIRGs were performed. Finally, the relationship between shared DEIRGs and immune infiltrates of AD and MDD were analyzed, respectively.
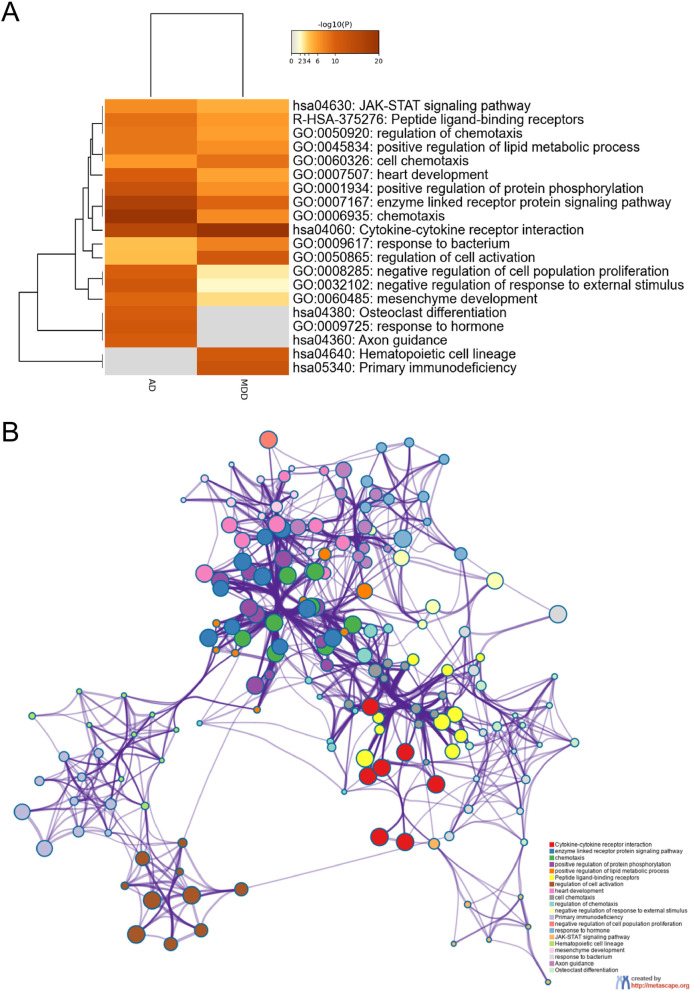
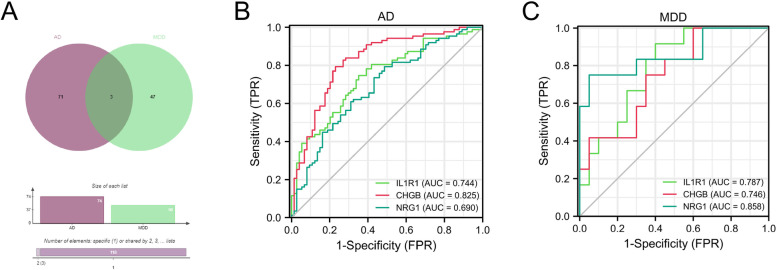
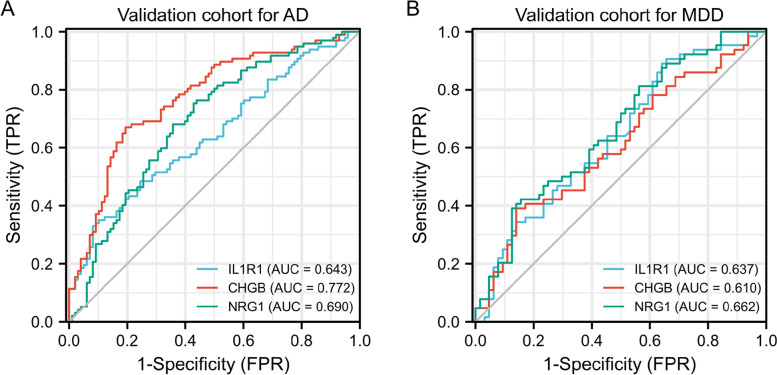
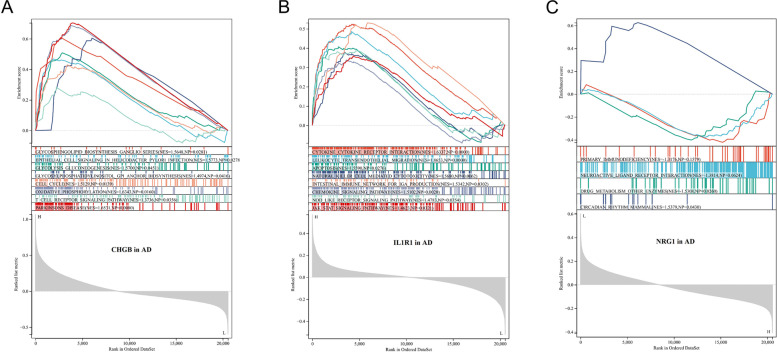
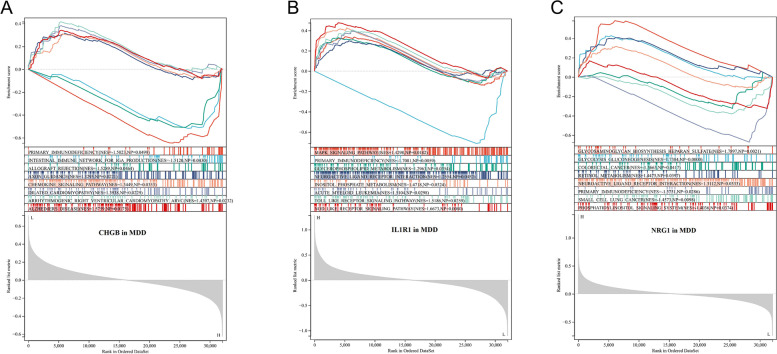
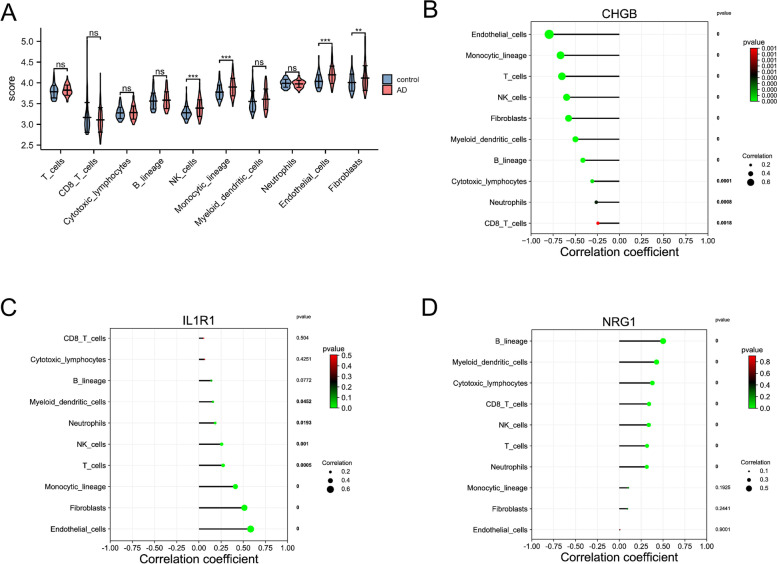
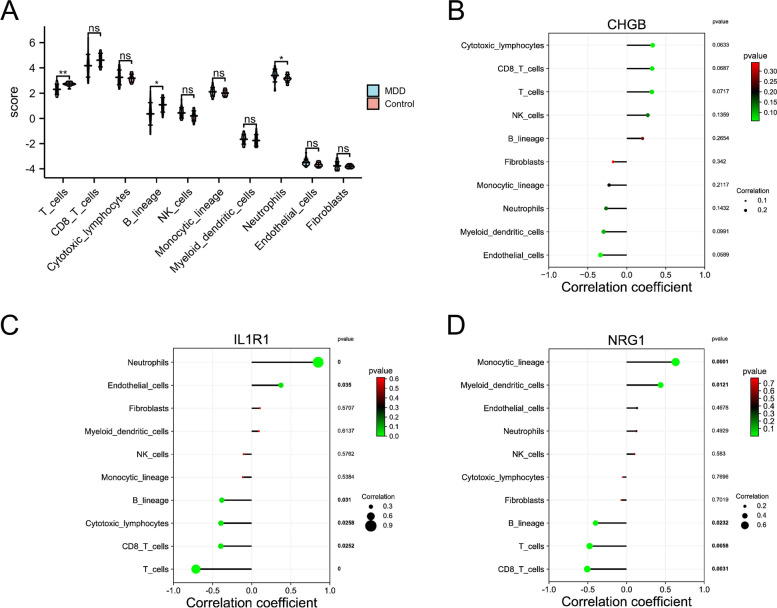
Results: A total of 121 DEIRGs linking AD and MDD were identified. These genes were significantly enriched in immune-related pathways, such as the JAK-STAT signaling pathway, regulation of chemotaxis, chemotaxis, cytokine-cytokine receptor interaction, and primary immunodeficiency. Furthermore, three shared DEIRGs (IL1R1, CHGB, and NRG1) were identified. Correlation analysis between DEIRGs and immune cells revealed that IL1R1 and NRG1 had a negative or positive correlation with some immune cells both in AD and MDD.
Conclusion: Both DEIRGs and immune cell infiltrations play a vital role in the pathogenesis of AD and MDD. Our findings indicated that there are common genes and biological processes between MDD and AD, which provides a theoretical basis for the study of the comorbidity of MDD and AD.
Keywords: Alzheimer’s disease; Bioinformatics; Depressive; Immune cells; Immune-related genes.
© 2023. The Author(s).
Conflict of interest statement
The authors declare no competing interests.
Figures
Similar articles
-
Identification of Hub Genes Related to Alzheimer's Disease and Major Depressive Disorder.Am J Alzheimers Dis Other Demen. 2021 Jan-Dec;36:15333175211046123. doi: 10.1177/15333175211046123. Am J Alzheimers Dis Other Demen. 2021. PMID: 34732058 Free PMC article.
-
Parallel molecular alteration between Alzheimer's disease and major depressive disorder in the human brain dorsolateral prefrontal cortex: an insight from gene expression and methylation profile analyses.Genes Genet Syst. 2023 Apr 18;97(6):311-324. doi: 10.1266/ggs.22-00022. Epub 2023 Mar 16. Genes Genet Syst. 2023. PMID: 36928034
-
Shared peripheral blood biomarkers for Alzheimer's disease, major depressive disorder, and type 2 diabetes and cognitive risk factor analysis.Heliyon. 2023 Mar 17;9(3):e14653. doi: 10.1016/j.heliyon.2023.e14653. eCollection 2023 Mar. Heliyon. 2023. PMID: 36994393 Free PMC article.
-
Integrated identification of key immune related genes and patterns of immune infiltration in calcified aortic valvular disease: A network based meta-analysis.Front Genet. 2022 Sep 21;13:971808. doi: 10.3389/fgene.2022.971808. eCollection 2022. Front Genet. 2022. PMID: 36212153 Free PMC article.
-
The shared molecular mechanisms underlying aging of the brain, major depressive disorder, and Alzheimer's disease: The role of circadian rhythm disturbances.Prog Neuropsychopharmacol Biol Psychiatry. 2023 Apr 20;123:110721. doi: 10.1016/j.pnpbp.2023.110721. Epub 2023 Jan 23. Prog Neuropsychopharmacol Biol Psychiatry. 2023. PMID: 36702452 Review.
Cited by
-
Alzheimer's Disease Mortality Rate: Correlation with Socio-Economic and Environmental Factors.Toxics. 2024 Aug 13;12(8):586. doi: 10.3390/toxics12080586. Toxics. 2024. PMID: 39195688 Free PMC article.
-
Integrated network pharmacology and transcriptomics to reveal the mechanism of Passiflora against depressive disorder: An observational study.Medicine (Baltimore). 2024 Oct 11;103(41):e39309. doi: 10.1097/MD.0000000000039309. Medicine (Baltimore). 2024. PMID: 39465851 Free PMC article.
-
A review and analysis of key biomarkers in Alzheimer's disease.Front Neurosci. 2024 Feb 20;18:1358998. doi: 10.3389/fnins.2024.1358998. eCollection 2024. Front Neurosci. 2024. PMID: 38445255 Free PMC article. Review.
-
Exploring the diagnostic potential of IL1R1 in depression and its association with lipid metabolism.Front Pharmacol. 2025 Apr 24;16:1519287. doi: 10.3389/fphar.2025.1519287. eCollection 2025. Front Pharmacol. 2025. PMID: 40343008 Free PMC article.
References
-
- GBD 2017 Disease and Injury Incidence and Prevalence Collaborators. Global, regional, and national incidence, prevalence, and years lived with disability for 354 diseases and injuries for 195 countries and territories, 1990–2017: a systematic analysis for the Global Burden of Disease Study 2017. Lancet (London, England). 2018;392(10159):1789–858. - PMC - PubMed
MeSH terms
Substances
LinkOut - more resources
Full Text Sources
Medical
Miscellaneous