. 2023 Apr 15;21(1):258.
doi: 10.1186/s12967-023-04078-7.

Compensatory remodeling of a septo-hippocampal GABAergic network in the triple transgenic Alzheimer's mouse model

Affiliations

Compensatory remodeling of a septo-hippocampal GABAergic network in the triple transgenic Alzheimer's mouse model

Connor M Wander et al. J Transl Med. .

Abstract

Background: Alzheimer's disease (AD) is characterized by a progressive loss of memory that cannot be efficiently managed by currently available AD therapeutics. So far, most treatments for AD that have the potential to improve memory target neural circuits to protect their integrity. However, the vulnerable neural circuits and their dynamic remodeling during AD progression remain largely undefined.

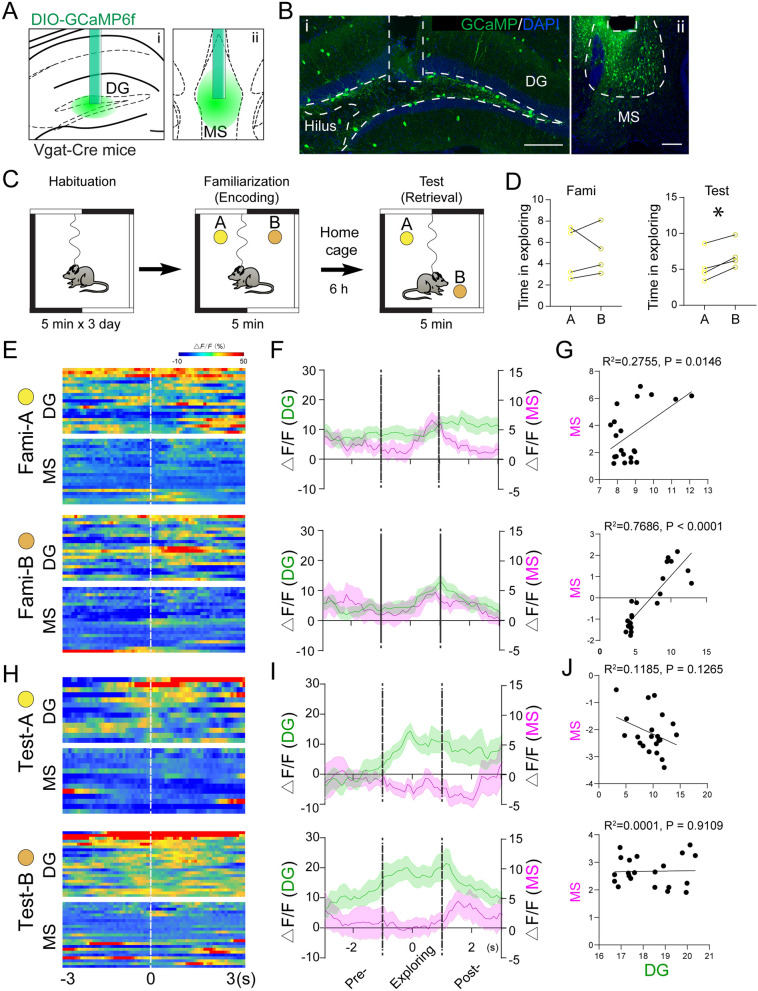
Methods: Circuit-based approaches, including anterograde and retrograde tracing, slice electrophysiology, and fiber photometry, were used to investigate the dynamic structural and functional remodeling of a GABAergic circuit projected from the medial septum (MS) to the dentate gyrus (DG) in 3xTg-AD mice during AD progression.

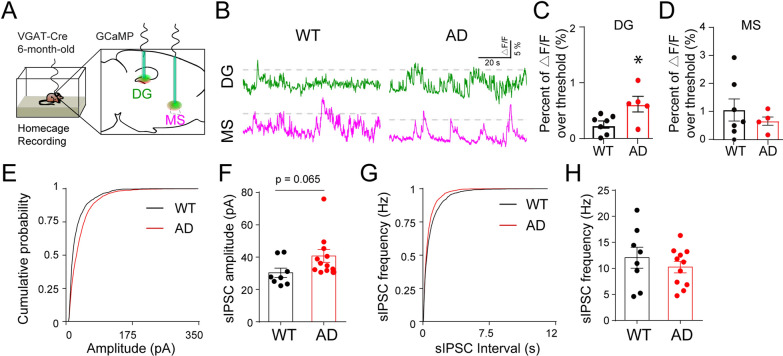
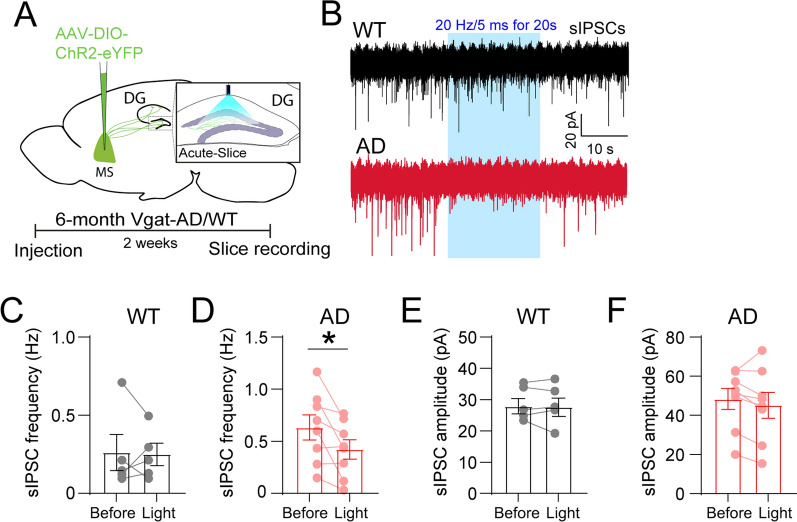
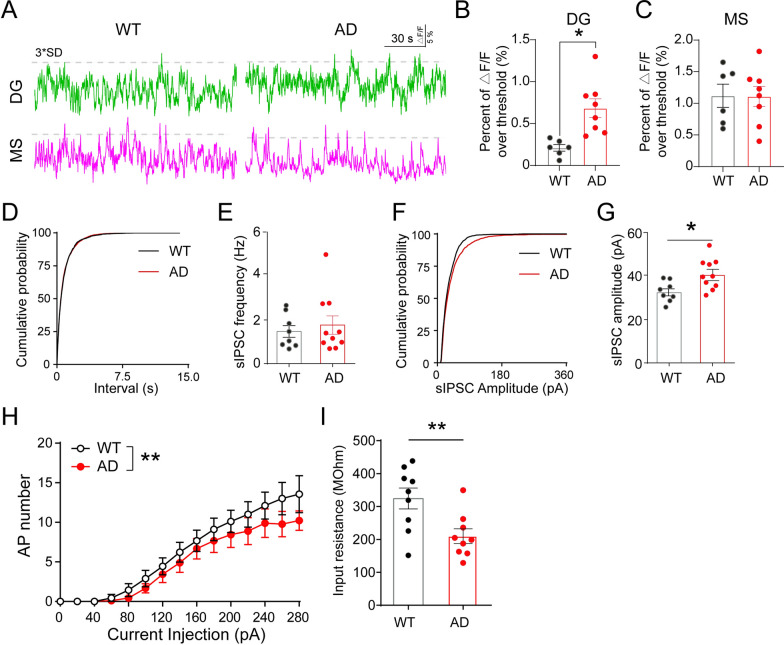
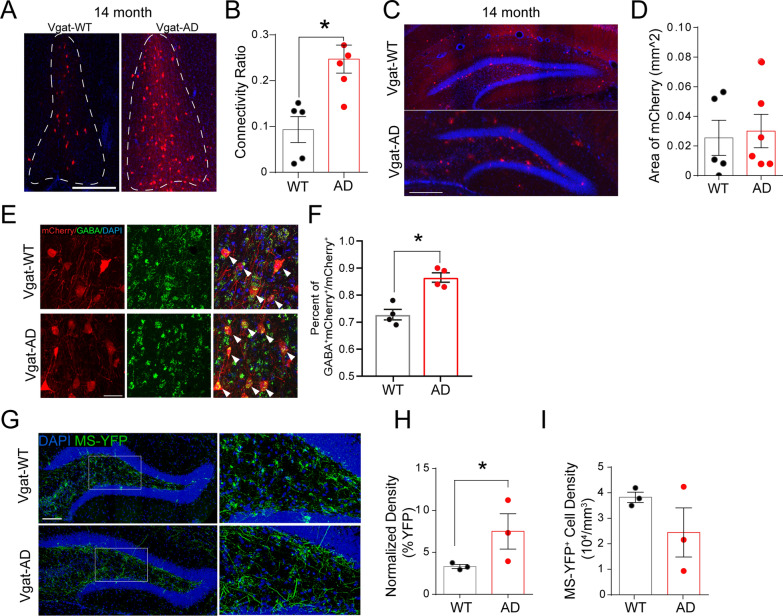
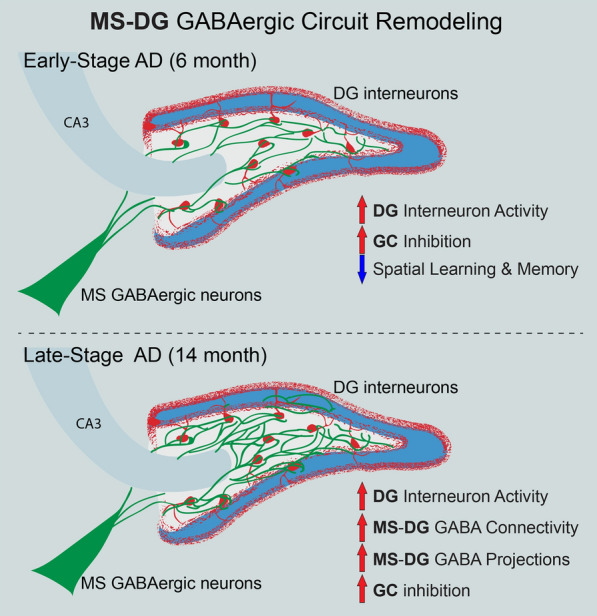
Results: We identified a long-distance GABAergic circuit that couples highly connected MS and DG GABAergic neurons during spatial memory encoding. Furthermore, we found hyperactivity of DG interneurons during early AD, which persisted into late AD stages. Interestingly, MS GABAergic projections developed a series of adaptive strategies to combat DG interneuron hyperactivity. During early-stage AD, MS-DG GABAergic projections exhibit increased inhibitory synaptic strength onto DG interneurons to inhibit their activities. During late-stage AD, MS-DG GABAergic projections form higher anatomical connectivity with DG interneurons and exhibit aberrant outgrowth to increase the inhibition onto DG interneurons.

Conclusion: We report the structural and functional remodeling of the MS-DG GABAergic circuit during disease progression in 3xTg-AD mice. Dynamic MS-DG GABAergic circuit remodeling represents a compensatory mechanism to combat DG interneuron hyperactivity induced by reduced GABA transmission.

Keywords: Alzheimer’s disease; Dentate gyrus; Medial septum; Septo-hippocampal GABAergic network.


Conflict of interest statement

The authors declare no competing interests.

Figures

Fig. 1
Fig. 1
DG interneurons are highly connected with MS GABAergic neurons. A Schematic for monosynaptic retrograde tracing of GABAergic neurons in the DG of Vgat-Cre mice. B Representative images of mCherry-Rabies virus labeling in the DG of Vgat-Cre (scale bar = 200 μm). C Representative images of mCherry and GFP labeling in the starter cells from the retrograde tracing of DG GABAergic neurons (scale bar = 50 μm). D Representative images of mCherry labelied input cells in the MS and DB of 5 month Vgat-Cre mice. E Quantification of Vgat-Cre connectivity in 5 month Vgat-Cre mice. Data from 4 Vgat-WT mice. DB Diagonal band of Broca, MS Medial Septum, VTA Ventral Tegmental Area, cCA contralateral Cornu Ammonis, cDG contralateral Dentate Gyrus, HY  Hypothalamus, ENT Entorhinal cortex, DR Dorsal raphe, LS Lateral Septum, TH Thalamus, SUB Subiculum, PIR Piriform cortex, mPFC medial Prefrontal Cortex, LC Locus coeruleus. F Representative images of mCherry-labeled input cells in the MS co-labeled with anti-GABA antibodies (Yellow arrows indicate co-localization) in 5 month Vgat-Cre mice. (scale bar = 25 μm). GH Quantification of mCherry+, mCherry+GABA+ cells and percentage of mCherry+GABA+ in total mCherry+ cells in retrograde labeling of MS neurons in 5 month Vgat-Cre mice. 3 mice and 3 slices/mouse were counted
Fig. 2
Fig. 2
Activities of MS and DG GABAergic neurons correlate during spatial memory encoding. A VGAT-Cre animals with dual injection of AAV5-DIO-GCaMP6f and optical fiber implantation to the DG and MS. Enlarged implantation region schematics in the DG (i) and MS (ii). 4 Vgat-WT mice were included in analysis. B Representative images of GCaMP6f expression in the DG (i, scale bar = 200 μm) and MS (ii, scale bar = 100 μm). C Diagram of Vgat-Cre animals trained and tested in the NPR. D Time spent in exploring object-A and object-B during familiarization and test phase in the NPR test. n = 4 mice, paired t-test, *p < 0.05. E Scaled heat maps of DG and MS GABA neuron activity distribution when approaching objects A and B during the familiarization phase of the NPR test. F Averaged calcium activity of DG (green, left) and MS (magenta, right) GABA neuron activity pre, during, and post exploration of objects A and B during the familiarization phase of the NPR test. G Pearson correlation analysis of MS and DG GABA neuron calcium activity during interactions with objects A and B during the familiarization phase of the NPR test. Data points represent time-locked exploration events during NPR trials. H Scaled heat maps of DG and MS GABA neuron activity distribution when approaching objects A and B during the retrieval phase of the NPR test. I Averaged calcium activity of DG (green, left) and MS (magenta, right) GABA neuron activity pre, during, and post exploration of objects A and B during the test phase of the NPR trial. J Pearson correlation analysis of MS and DG interneuron calcium activity during interactions with objects A and B during the retrieval phase of the NPR test. Data points represent time-locked exploration events during NPR trials
Fig. 3
Fig. 3
DG interneurons exhibit hyperactivity during early-stage AD. A Scheme of AAV injection and optical fiber implantation in the DG and MS of 6 month Vgat-WT and Vgat-AD mice. B Representative calcium activity traces of DG (green) and MS (magenta) GABAergic neurons in Vgat-WT and Vgat-AD mice during home cage recording. The dotted lines indicated the 3 SD thresholds. C Quantification of calcium activity in DG interneurons during home cage recordings in Vgat-WT and Vgat-AD mice. p < 0.05, n = 7, 5 mice. D Quantification of calcium activity in MS GABA during home cage recordings in Vgat-WT and Vgat-AD mice. n.s., n = 7, 5 mice. E Cumulative distribution of GC sIPSC amplitude in Vgat-WT and Vgat-AD mice. F Mean amplitude of GC sIPSCs in Vgat-WT and Vgat-AD. p = 0.065, n = 8, 12 cells. G Cumulative distribution of GC sIPSC interval in Vgat-WT and Vgat-AD mice. H Mean frequency of GC sIPSCs in Vgat-WT and Vgat-AD. p = 0.43, n = 8, 11 cells
Fig. 4
Fig. 4
Structural remodeling of MS-DG GABAergic projections during early-stage AD. A Injection scheme and 3D reconstruction example for anterograde tracing of MS GABAergic projections to the hilus of 6 month Vgat-WT and Vgat-AD mice. Scale bar = 100 μm. B Representative images of YFP + neurons in the MS. Scale bar = 100 μm. C Quantification of YFP-labeled cell density in the medial septum of Vgat-WT and Vgat-AD mice at 6 months of age. p = 0.90, n = 5, 3 mice. D Representative images of MS-GABA projections to the DG of 6 month Vgat-WT and Vgat-AD mice. Scale bar = 100 μm. E Quantification of YFP + GABAergic septo-DG projections in the hilus of 6 month Vgat-WT and Vgat-AD mice. n = 5, 3 mice, p = 0.06. F Quantification of % DG GABA+ cells contacted by YFP+ GABAergic septo-DG projections in the hilus of 6 month Vgat-WT and Vgat-AD mice, n = 3, 3 mice, p = 0.6325. G Representative images of mCherry+ input cells in MS of 5 months old Vgat-WT and Vgat-AD mice. Scale bar = 300 μm. H Quantification of mCherry+ input cells in highlighted regions of interest in 5 month Vgat-WT and Vgat-AD mice. n = 4, 6 mice, p = 0.463. I Representative images of retrograde tracing injection sites (DG) in 5 month Vgat-WT and Vgat-AD mice. Scale bar = 300 μm. J mCherry+ area within the injection site ROI (hilus) in 5 month Vgat-WT and Vgat-AD mice. p = 0.647
Fig. 5
Fig. 5
Activation of MS-DG GABAergic projections alters the inhibitory inputs onto GCs during early-stage AD. A Schematic of viral injection of ChR2 and blue light stimulation of septo-DG circuit projections to the hilus. B Representative traces of GC sIPSCs before, during (blue frame), and after blue light stimulation. C Quantification of sIPSC frequency in GCs before and during light stimulation in Vgat-WT mice, n = 5 cells. D Quantification of sIPSC frequency in GCs before and during light stimulation in Vgat-AD mice, n = 8 cells. E Quantification of sIPSC amplitude in GCs before and during light stimulation in Vgat-WT mice, n = 5 cells. F Quantification of sIPSC amplitude in GCs before and during light stimulation in Vgat-AD mice, n = 8 cells. *p < 0.05 by paired t-test. Error bars indicate SEM
Fig. 6
Fig. 6
DG interneuron hyperactivity persists in late-stage AD and coincides with increased inhibition of dentate GCs. A Representative fiber photometry calcium activity traces of MS (magenta) and DG (green) GABA neurons in 14 months old Vgat-WT and Vgat-AD mice during home-cage recording. B Quantification of cumulative activity of DG interneurons in 14 months old Vgat-WT and Vgat-AD mice during home cage recordings. n = 6, 8 mice, p < 0.05. C Quantification of cumulative activity of MS GABA neurons in 14 month Vgat-WT and Vgat-AD mice during home cage recording. n = 6, 8 mice. D Cumulative distribution of sIPSC interval in GCs of Vgat-WT and Vgat-AD mice, p = 0.462. E Mean frequency of GC sIPSCs in Vgat-WT and Vgat-AD. p = 0.59, n = 8, 9 cells. F Cumulative distribution of sIPSC amplitude in GCs of Vgat-WT and Vgat-AD mice during acute slice electrophysiology, p < 0.0001. G Mean amplitude of GC sIPSCs in Vgat-WT and Vgat-AD mice. p = 0.01, n = 8, 9 cells. H Action potential distribution with various current steps in GCs of Vgat-WT and Vgat-AD mice. Two-way ANOVA, p = 0.003. I Quantification of GC input resistance in 14 month Vgat-WT and Vgat-AD mice. p = 0.009, n = 9, 9 cells
Fig. 7
Fig. 7
Compensatory structural remodeling of the MS-DG circuit in late-stage AD. A Representative immunofluorescence images showing mCherry input neurons in the MS of aged Vgat-WT and Vgat-AD mice. Scale bar = 300 μm. B Quantification of MS-DG connectivity ratio in 14 month Vgat-WT and Vgat-AD mice. n = 5, 5 mice. p = 0.002. C Representative images of retrograde tracing injection sites (DG) in 14 month Vgat-WT and Vgat-AD mice. Scale bar = 300 μm. D mCherry+ area within the injection site ROI (hilus) in 14 month Vgat-WT and Vgat-AD mice. n = 5, 6 mice. p = 0.96. E Representative dual immunofluorescence confocal images of the MS of aged Vgat-WT and Vgat-AD mice showing co-localization of mCherry input neurons co-localized with GABA staining. White arrows indicate co-localization. Scale bar = 30 μm. F Quantification of GABA+/mCherry+ neurons over total mCherry+ neurons in 14 month Vgat-WT and Vgat-AD mice. n = 4, 4 mice. p = 0.124. G Representative images of MS-GABA projections to the DG of 14 month Vgat-WT and Vgat-AD mice. Scale bar = 100 µm. H Quantification of MS GABA YFP+ process density in the hilus of 14 month Vgat-WT and Vgat-AD mice. n = 3, 3 mice, p = 0.0047. I Quantification of YFP-labeled cell density in the MS of Vgat-WT and Vgat-AD mice at 14 months of age. n = 3, 3 mice, p = 0.244
Fig. 8
Fig. 8
Dynamic remodeling of the MS-DG GABAergic network during AD progression. Distal MS GABAergic neurons develop a series of adaptive remodeling strategies to compensate for hyperactive DG interneurons during both early- and late-stage AD

References

    1. Hurd MD, Martorell P, Delavande A, Mullen KJ, Langa KM. Monetary costs of dementia in the United States. N Engl J Med. 2013;368:1326–34. doi: 10.1056/NEJMsa1204629. - DOI - PMC - PubMed
    1. Bakker A, Albert MS, Krauss G, Speck CL, Gallagher M. Response of the medial temporal lobe network in amnestic mild cognitive impairment to therapeutic intervention assessed by fMRI and memory task performance. Neuroimage Clin. 2015;7:688–98. doi: 10.1016/j.nicl.2015.02.009. - DOI - PMC - PubMed
    1. Zhu CW, Livote EE, Scarmeas N, Albert M, Brandt J, Blacker D, Sano M, Stern Y. Long-term associations between cholinesterase inhibitors and memantine use and health outcomes among patients with Alzheimer’s disease. Alzheimers Dement. 2013;9:733–40. doi: 10.1016/j.jalz.2012.09.015. - DOI - PMC - PubMed
    1. Laxton AW, Tang-Wai DF, McAndrews MP, Zumsteg D, Wennberg R, Keren R, Wherrett J, Naglie G, Hamani C, Smith GS, Lozano AM. A phase I trial of deep brain stimulation of memory circuits in Alzheimer’s disease. Ann Neurol. 2010;68:521–34. doi: 10.1002/ana.22089. - DOI - PubMed
    1. Roy DS, Arons A, Mitchell TI, Pignatelli M, Ryan TJ, Tonegawa S. Memory retrieval by activating engram cells in mouse models of early Alzheimer’s disease. Nature. 2016;531:508–12. doi: 10.1038/nature17172. - DOI - PMC - PubMed

Publication types