

Early detection and metabolic pathway identification of T cell activation by in-process intracellular mass spectrometry
- PMID: 37061898
- PMCID: PMC10524195
- DOI: 10.1016/j.jcyt.2023.03.010
Early detection and metabolic pathway identification of T cell activation by in-process intracellular mass spectrometry
Abstract
Background aims: In-process monitoring and control of biomanufacturing workflows remains a significant challenge in the development, production, and application of cell therapies. New process analytical technologies must be developed to identify and control the critical process parameters that govern ex vivo cell growth and differentiation to ensure consistent and predictable safety, efficacy, and potency of clinical products.
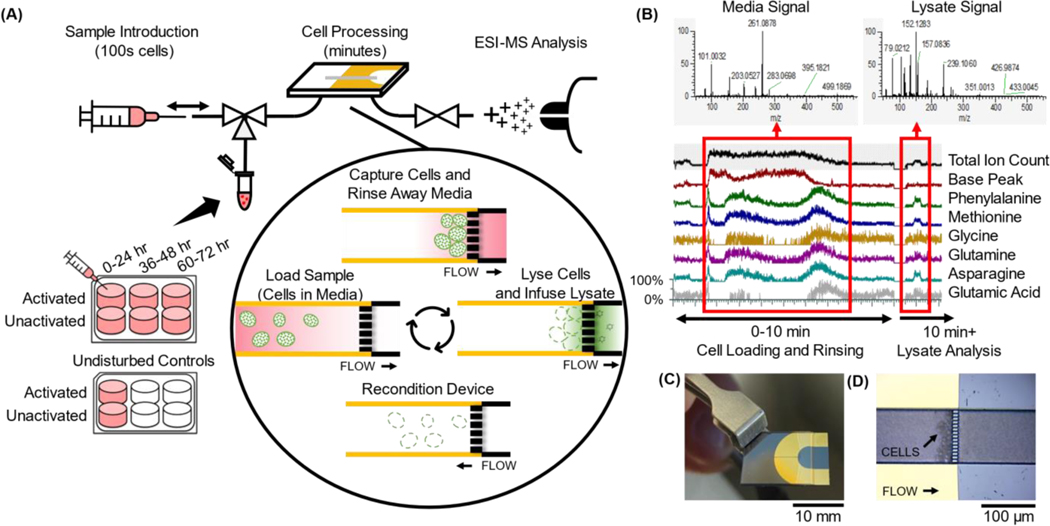
Methods: This study demonstrates a new platform for at-line intracellular analysis of T-cells. Untargeted mass spectrometry analyses via the platform are correlated to conventional methods of T-cell assessment.
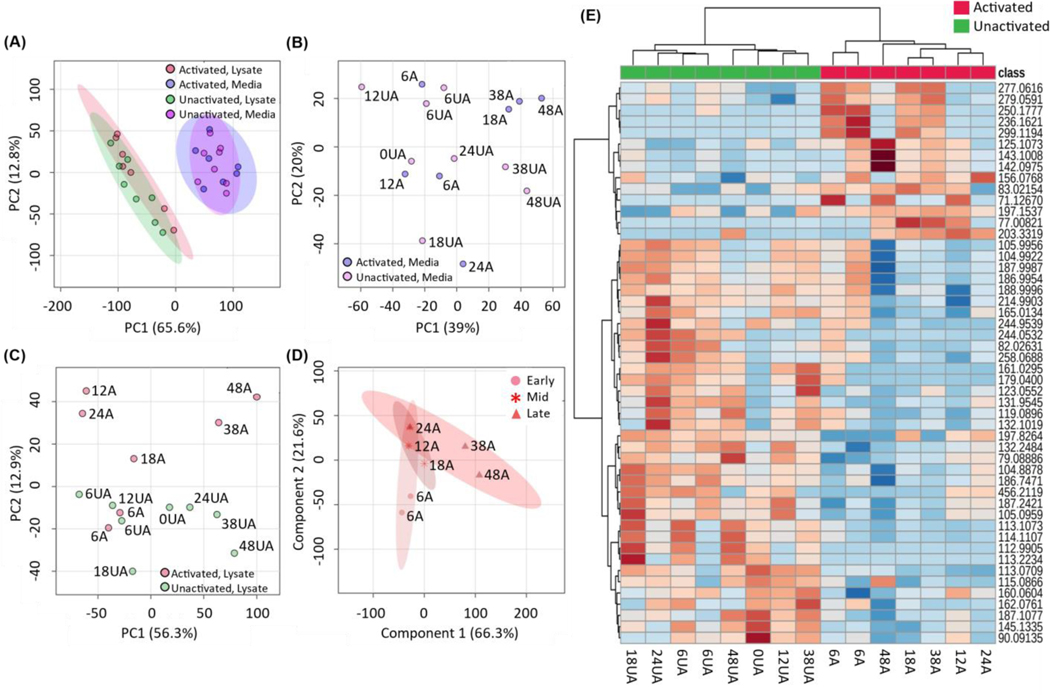
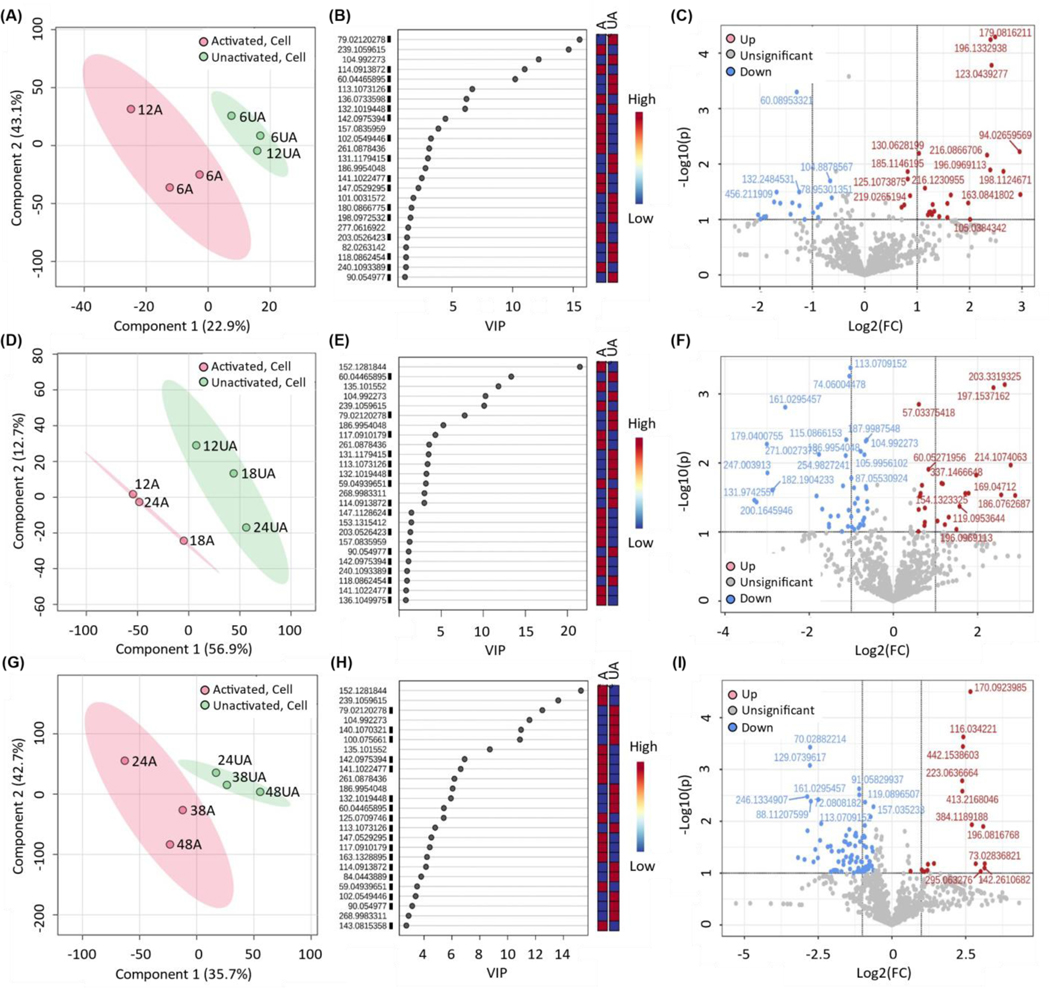
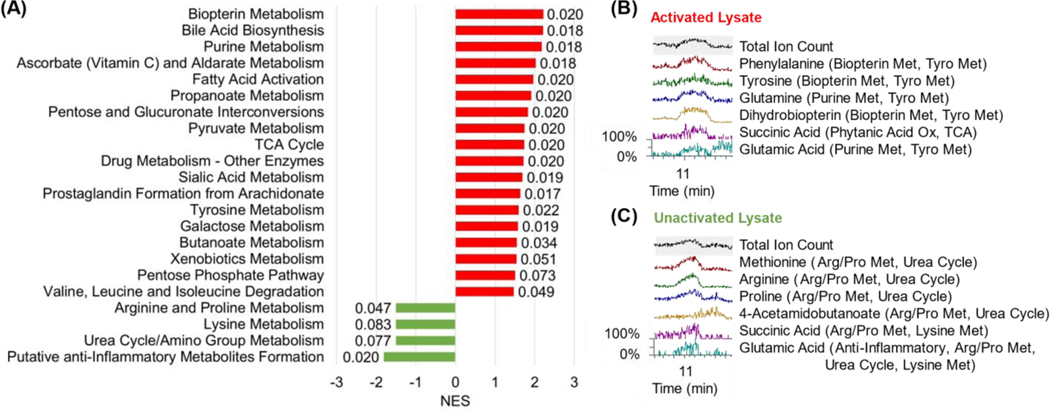
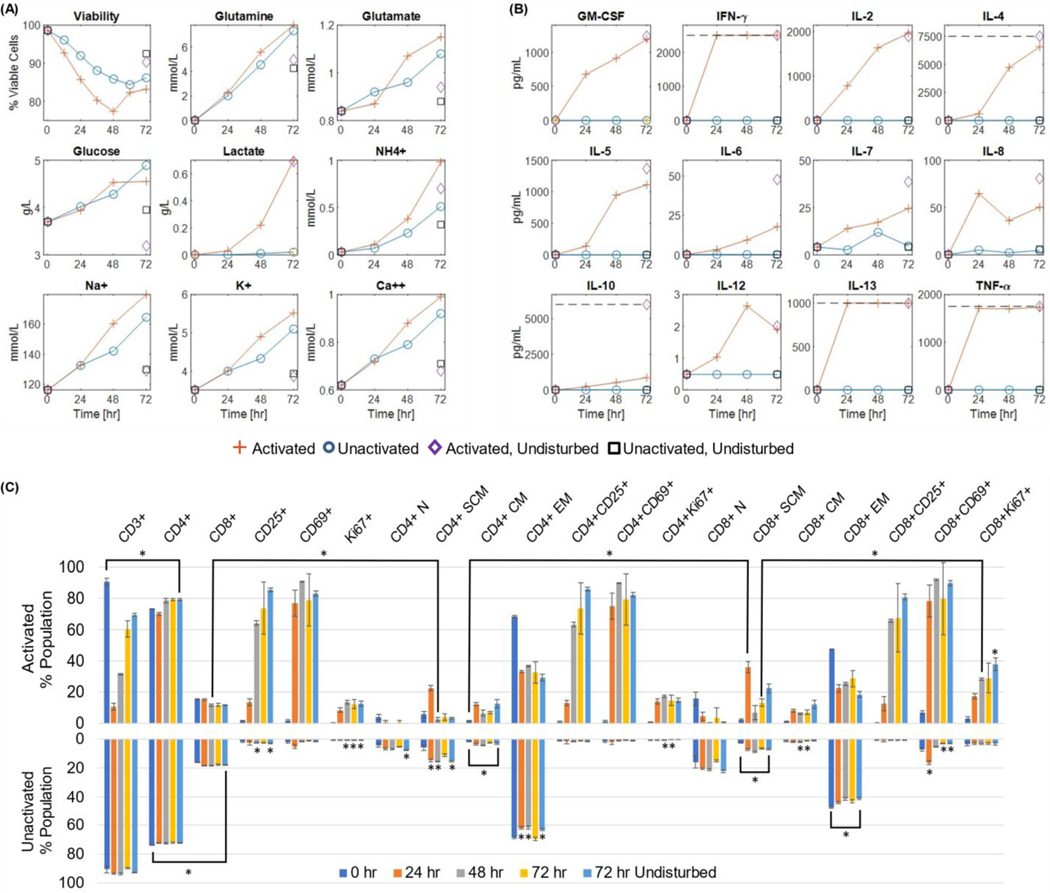
Results: Spectral markers and metabolic pathways correlated with T-cell activation and differentiation are detected at early time points via rapid, label-free metabolic measurements from a minimal number of cells as enabled by the platform. This is achieved while reducing the analytical time and resources as compared to conventional methods of T-cell assessment.
Conclusions: In addition to opportunities for fundamental insight into the dynamics of T-cell processes, this work highlights the potential of in-process monitoring and dynamic feedback control strategies via metabolic modulation to drive T-cell activation, proliferation, and differentiation throughout biomanufacturing.
Keywords: cell therapy; lab-on-a-chip; metabolic pathway; process analytical technology.
Copyright © 2023 International Society for Cell & Gene Therapy. Published by Elsevier Inc. All rights reserved.
Conflict of interest statement
Declaration of Competing Interest ALC, AGF and PAK are inventors of the sample-to-analysis platform for intracellular analysis (PCT/US2022/77220). AGF is pursuing commercialization of this and related technologies. The terms of this arrangement have been reviewed and approved by Georgia Tech in accordance with its conflict-of-interest policies. The remaining authors declare no competing interests.
Figures
Similar articles
-
Sample-to-analysis platform for rapid intracellular mass spectrometry from small numbers of cells.Lab Chip. 2021 Nov 25;21(23):4696-4706. doi: 10.1039/d1lc00884f. Lab Chip. 2021. PMID: 34751694 Free PMC article.
-
Monitoring the dynamics of primary T cell activation and differentiation using long term live cell imaging in microwell arrays.Lab Chip. 2012 Dec 7;12(23):5007-15. doi: 10.1039/c2lc40808b. Lab Chip. 2012. PMID: 23072772
-
Quantitative analysis of how Myc controls T cell proteomes and metabolic pathways during T cell activation.Elife. 2020 Feb 5;9:e53725. doi: 10.7554/eLife.53725. Elife. 2020. PMID: 32022686 Free PMC article.
-
Influence of Inflammation in the Process of T Lymphocyte Differentiation: Proliferative, Metabolic, and Oxidative Changes.Front Immunol. 2018 Mar 1;9:339. doi: 10.3389/fimmu.2018.00339. eCollection 2018. Front Immunol. 2018. PMID: 29545794 Free PMC article. Review.
-
Mass Spectrometry-Based Phosphoproteomics and Systems Biology: Approaches to Study T Lymphocyte Activation and Exhaustion.J Mol Biol. 2021 Dec 3;433(24):167318. doi: 10.1016/j.jmb.2021.167318. Epub 2021 Oct 24. J Mol Biol. 2021. PMID: 34687714 Review.
Cited by
-
Toward Machine Learning Electrospray Ionization Sensitivity Prediction for Semiquantitative Lipidomics in Stem Cells.J Chem Inf Model. 2025 Feb 24;65(4):1826-1836. doi: 10.1021/acs.jcim.4c02040. Epub 2025 Feb 5. J Chem Inf Model. 2025. PMID: 39907635 Free PMC article.
-
Microfluidics enabled multi-omics triple-shot mass spectrometry for cell-based therapies.Biomicrofluidics. 2024 Jan 23;18(1):011302. doi: 10.1063/5.0175178. eCollection 2024 Jan. Biomicrofluidics. 2024. PMID: 38268742 Free PMC article.
References
-
- Approved Cellular and Gene Therapy Products, 2022. https://www.fda.gov/vaccines-bloodbiologics/cellular-gene-therapy-produc....(Accessed November 11 2022).
-
- Castella M, Caballero-Baños M, Ortiz-Maldonado V, González-Navarro EA, Suñé G, Antoñana-Vidósola A, Boronat A, Marzal B, Millán L, Martín-Antonio B, Cid J, Lozano M, García E, Tabera J, Trias E, Perpiña U, Canals JM, Baumann T, Benítez-Ribas D, Campo E, Yagüe J, Urbano-Ispizua Á, Rives S, Delgado J, Juan M, Point-Of-Care CAR T-Cell Production (ARI-0001) Using a Closed Semi-automatic Bioreactor: Experience From an Academic Phase I Clinical Trial, Front Immunol 11 (2020). 10.3389/fimmu.2020.00482 - DOI - PMC - PubMed
-
- Wang B, Bowles-Welch AC, Yeago C, Roy K, Process analytical technologies in cell therapy manufacturing: State-of-the-art and future directions, Journal of Advanced Manufacturing and Processing 4(1) (2022) e10106. 10.1002/amp2.10106 - DOI
Publication types
MeSH terms
Grants and funding
LinkOut - more resources
Full Text Sources
Miscellaneous
