. 2023 Apr 25;42(4):112396.
doi: 10.1016/j.celrep.2023.112396. Epub 2023 Apr 15.

AMPK activation protects against prostate cancer by inducing a catabolic cellular state

Affiliations

AMPK activation protects against prostate cancer by inducing a catabolic cellular state

Lucy Penfold et al. Cell Rep. .

Abstract

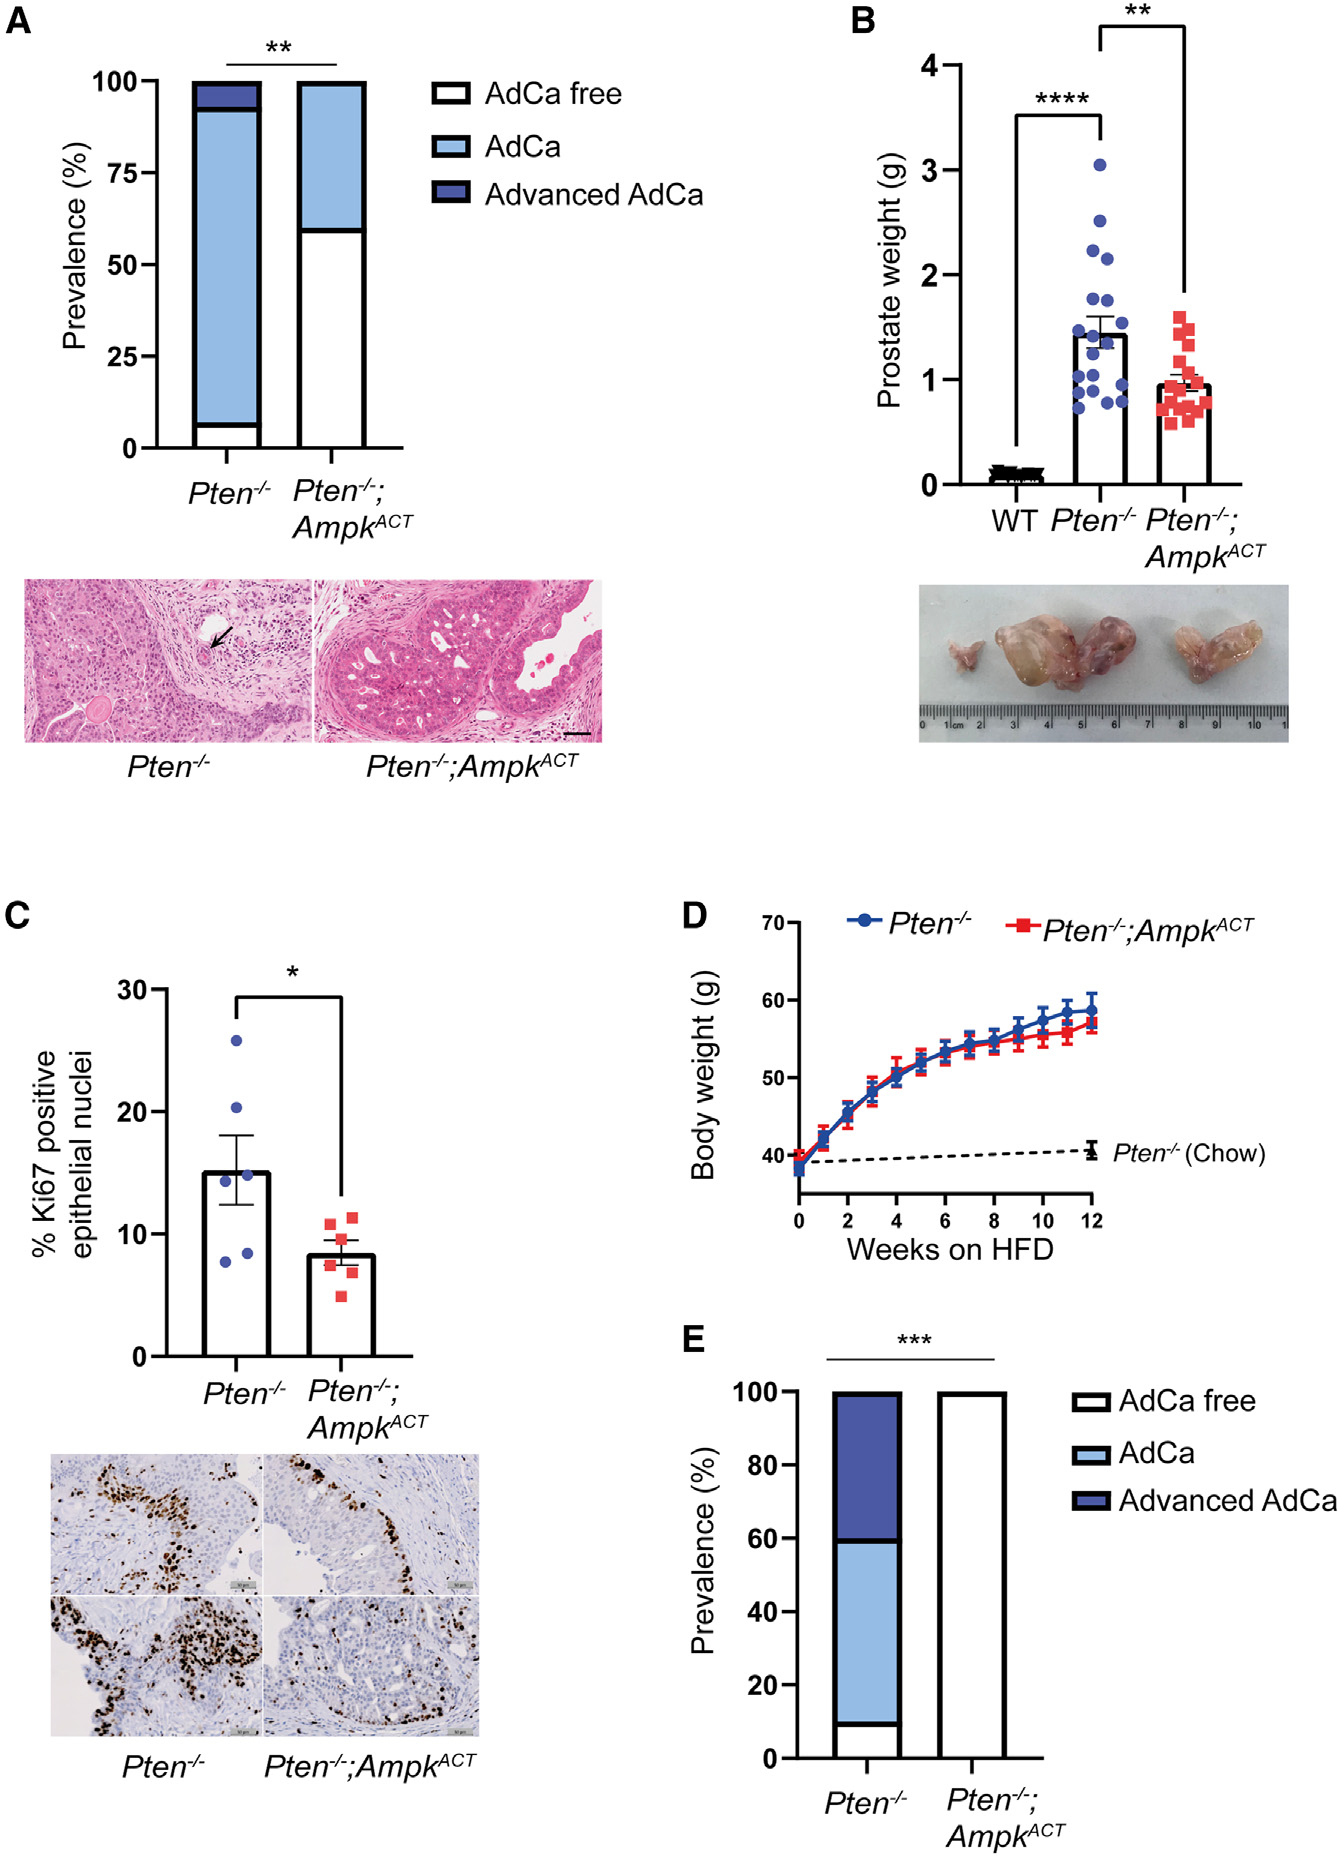
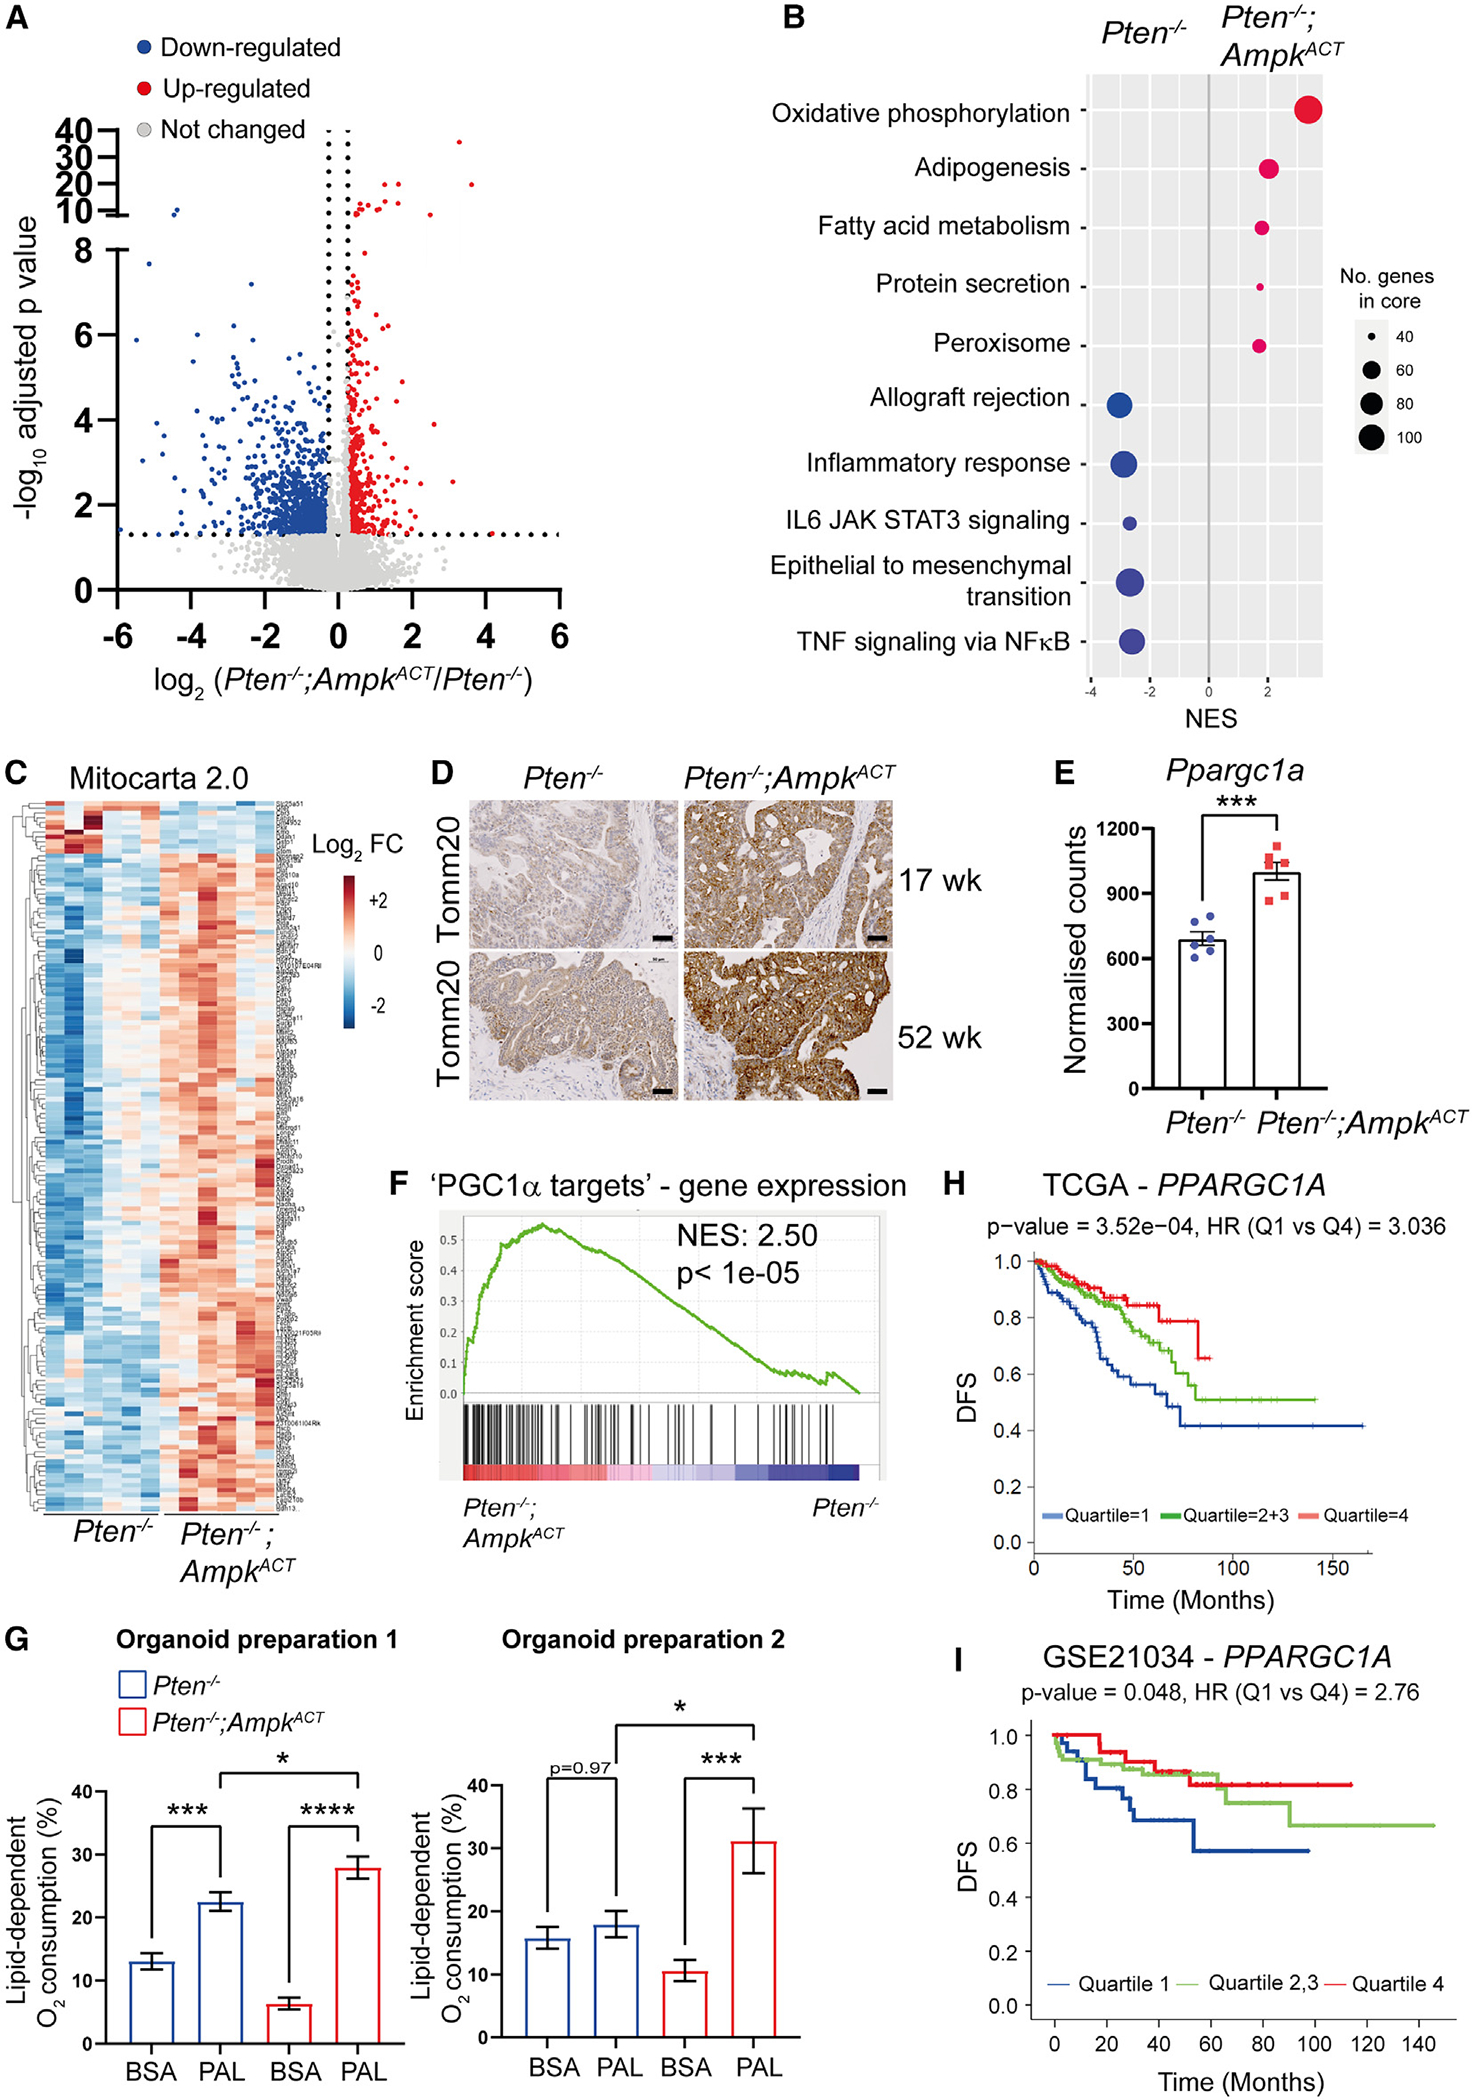
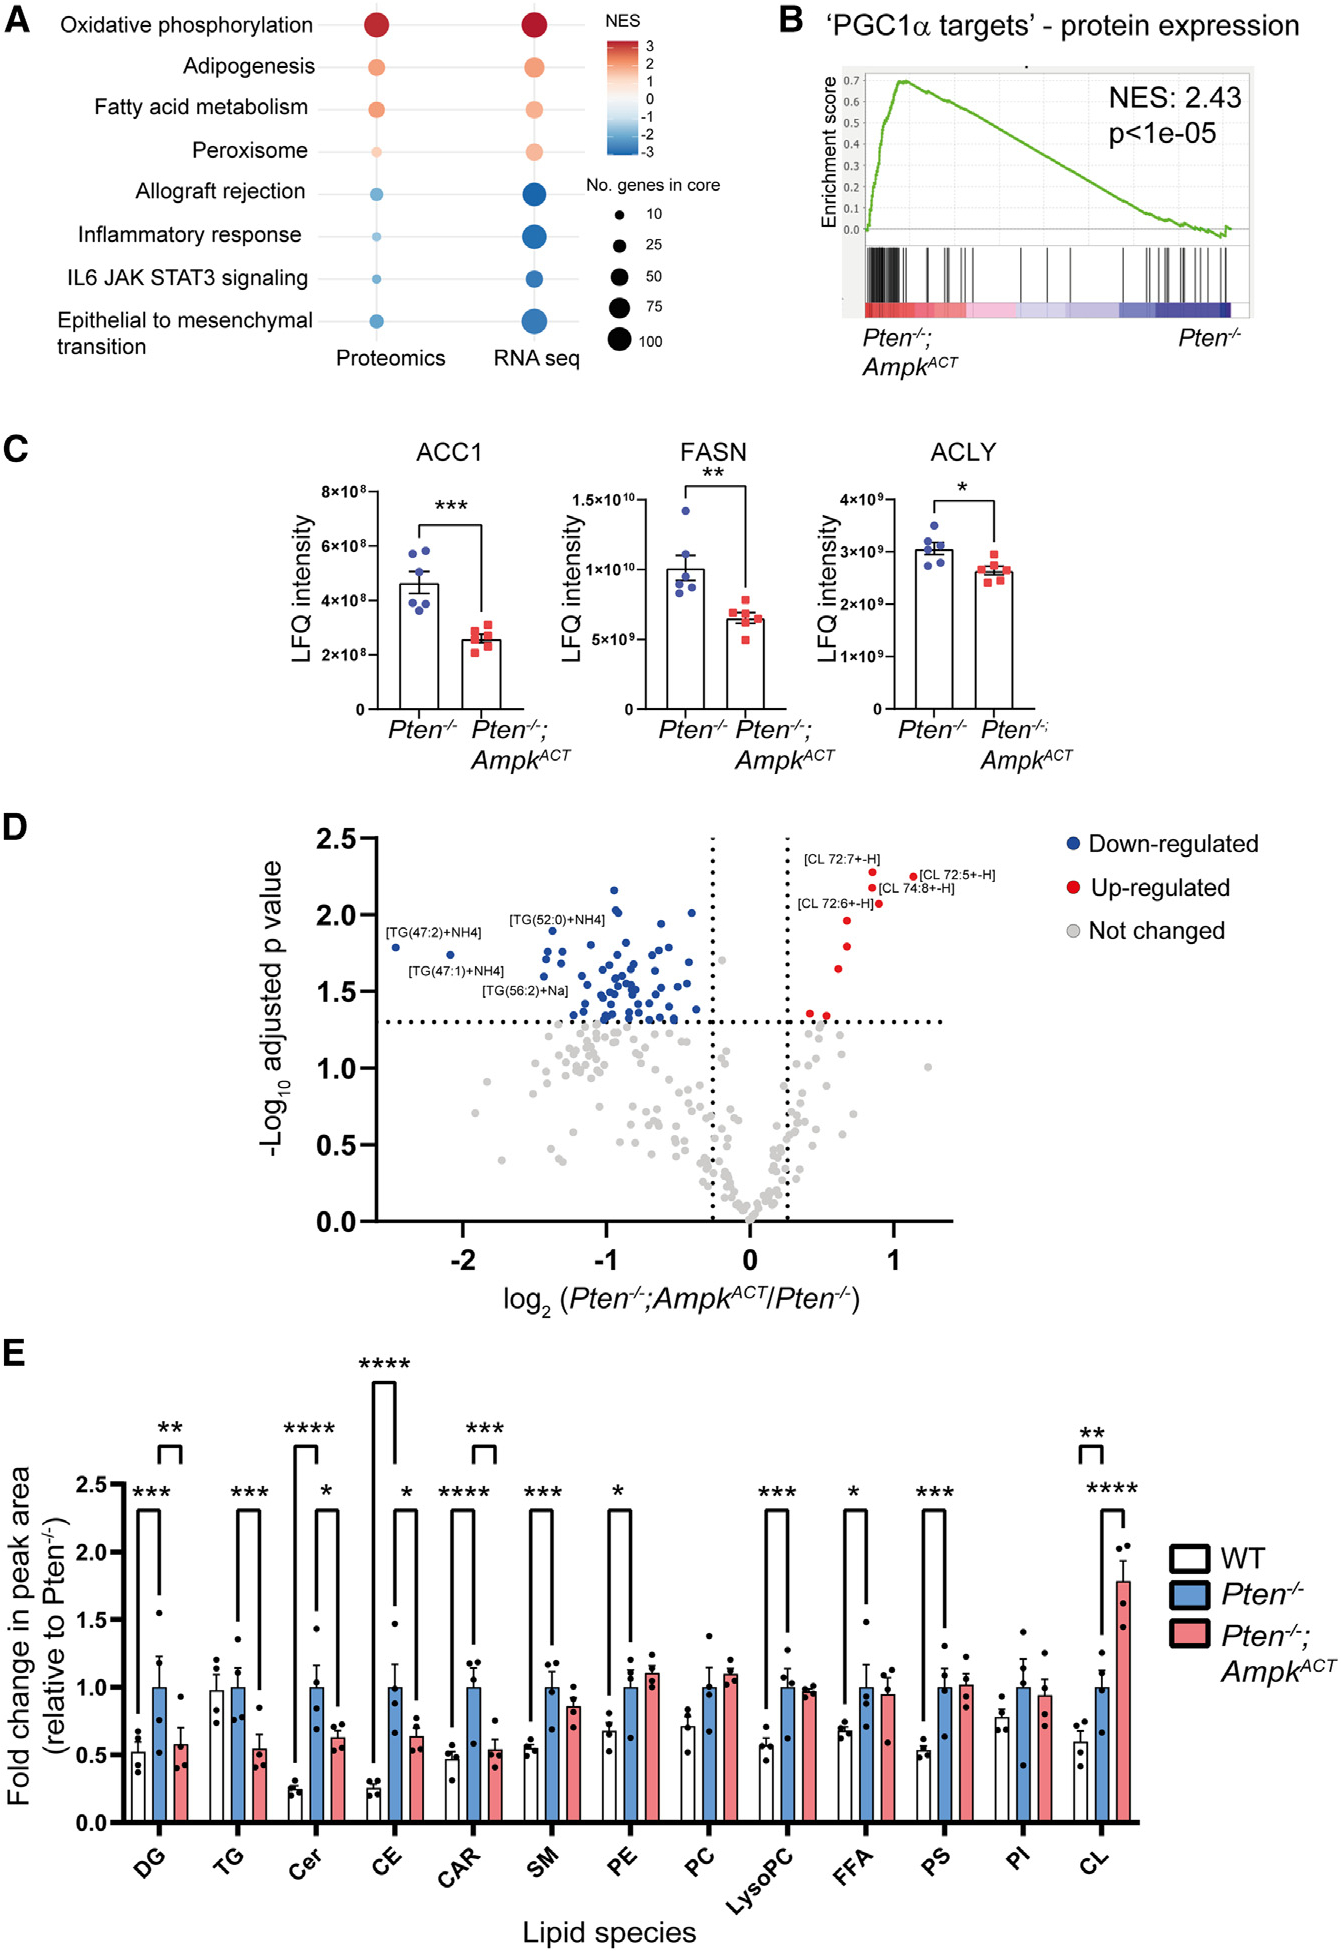
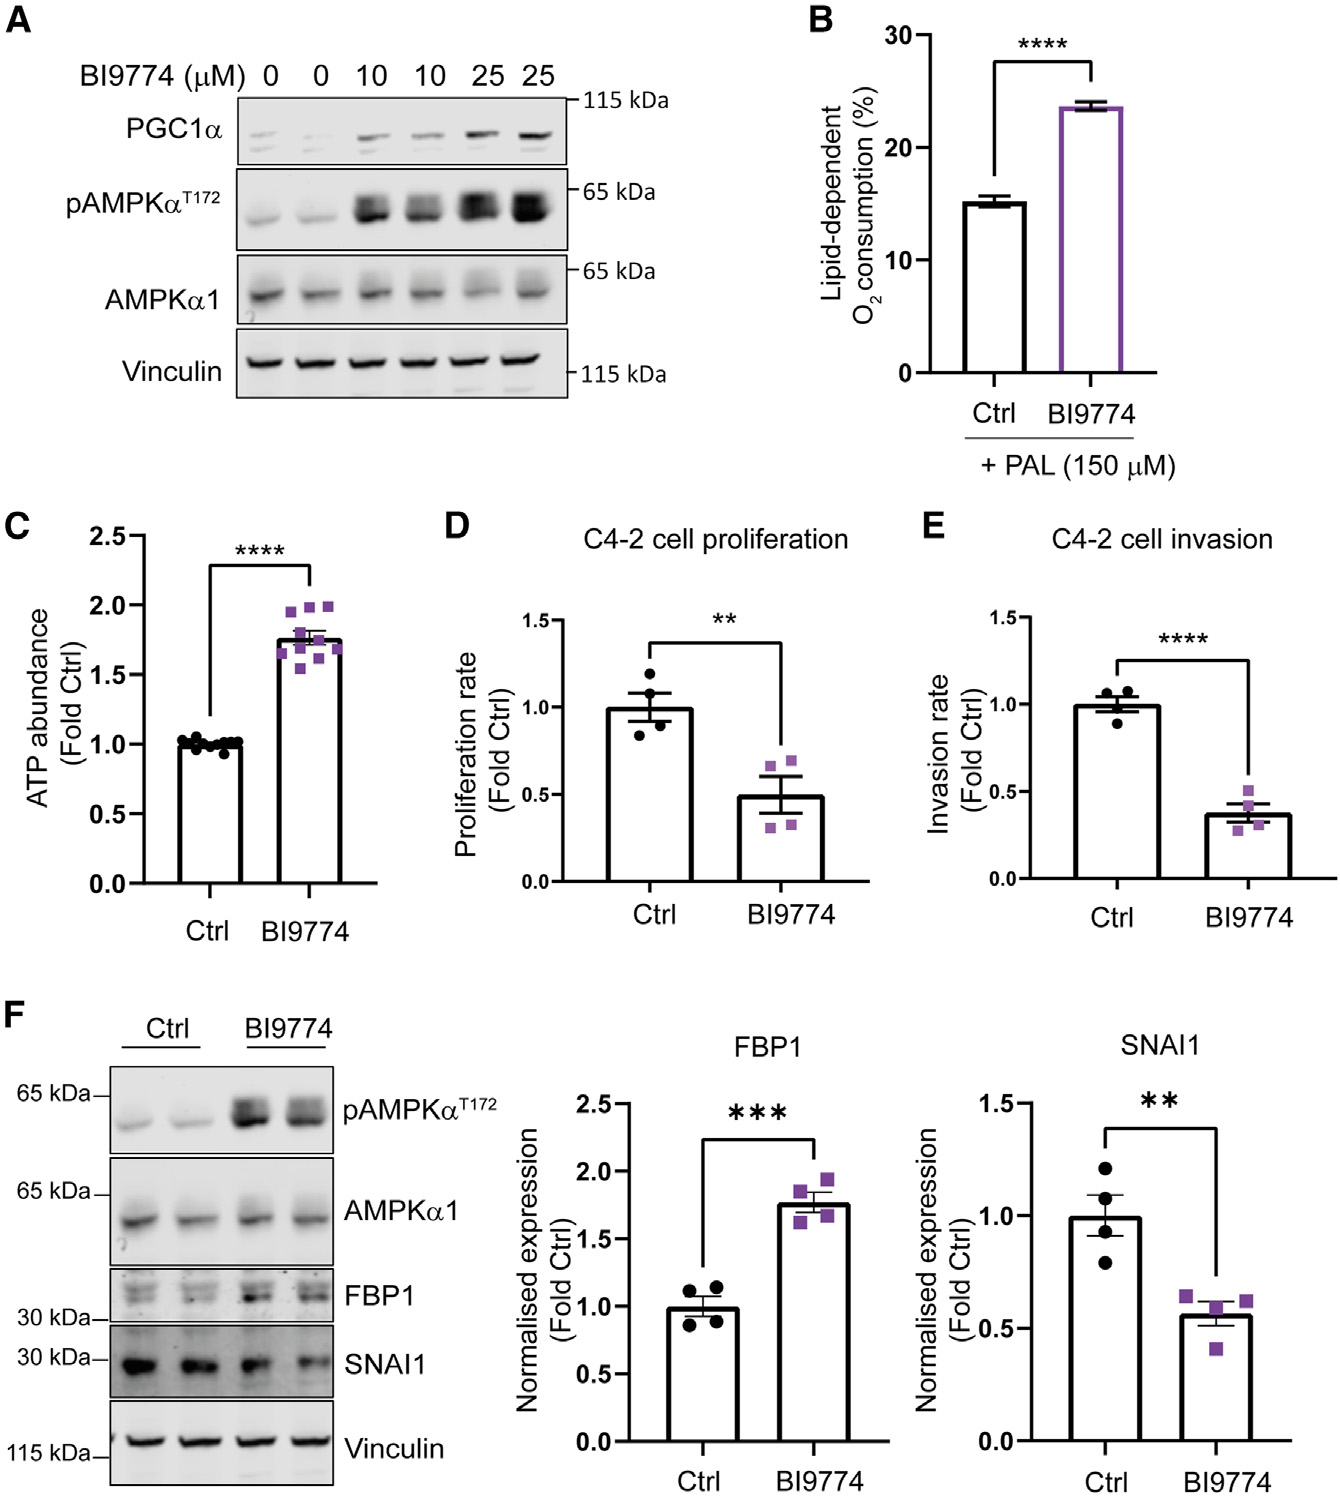
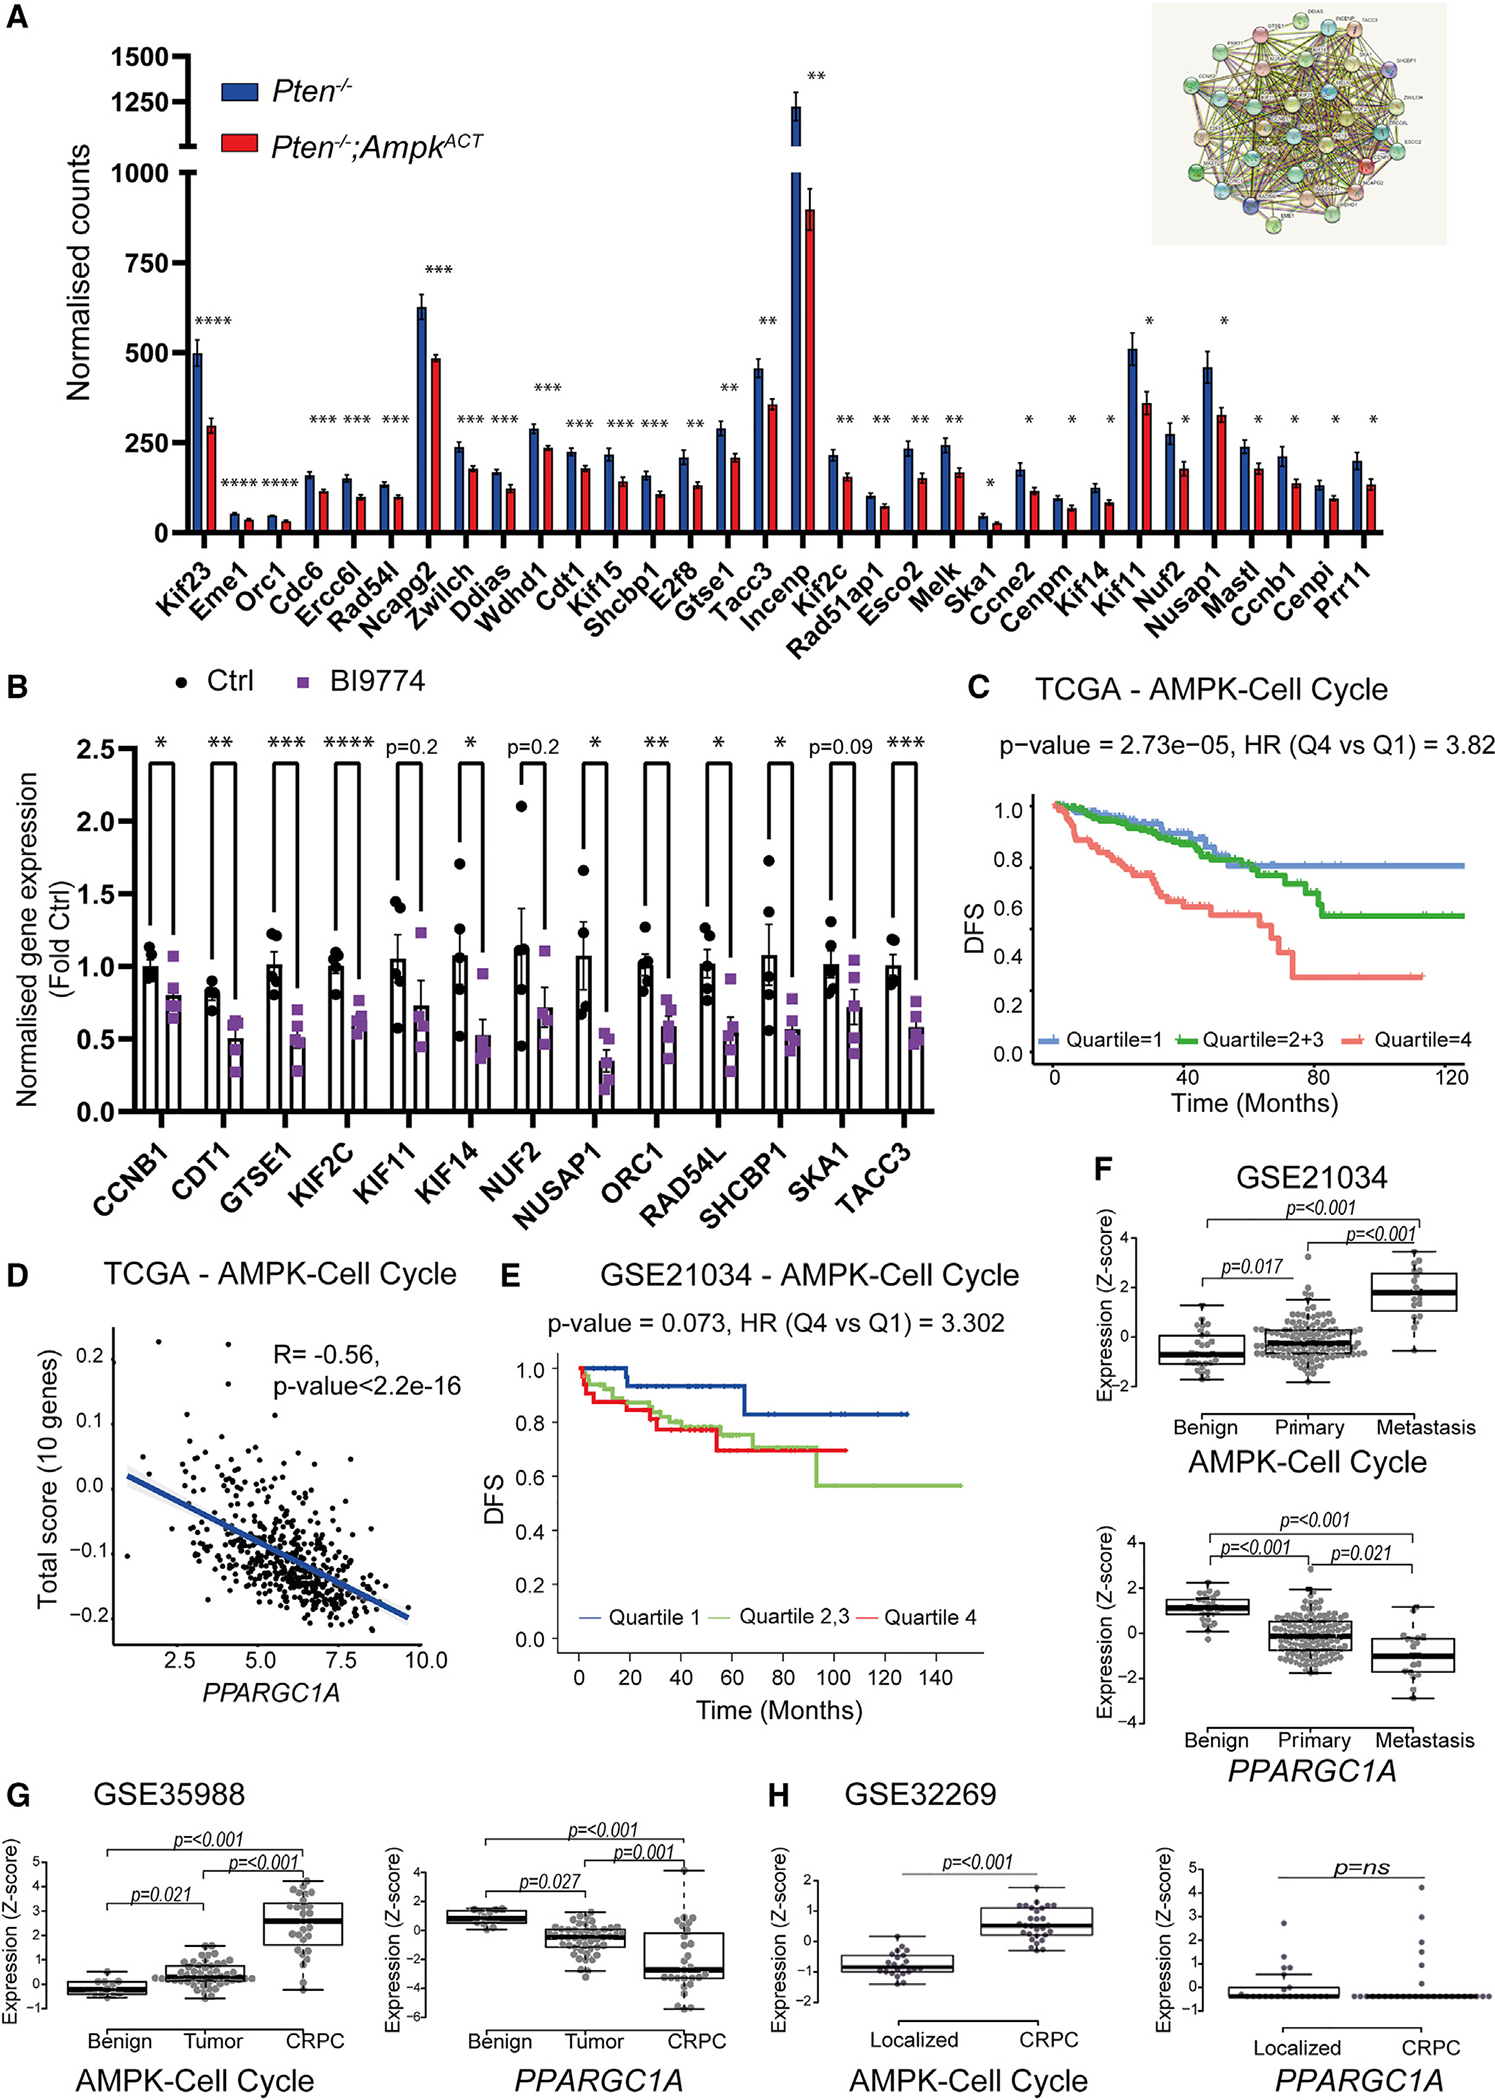
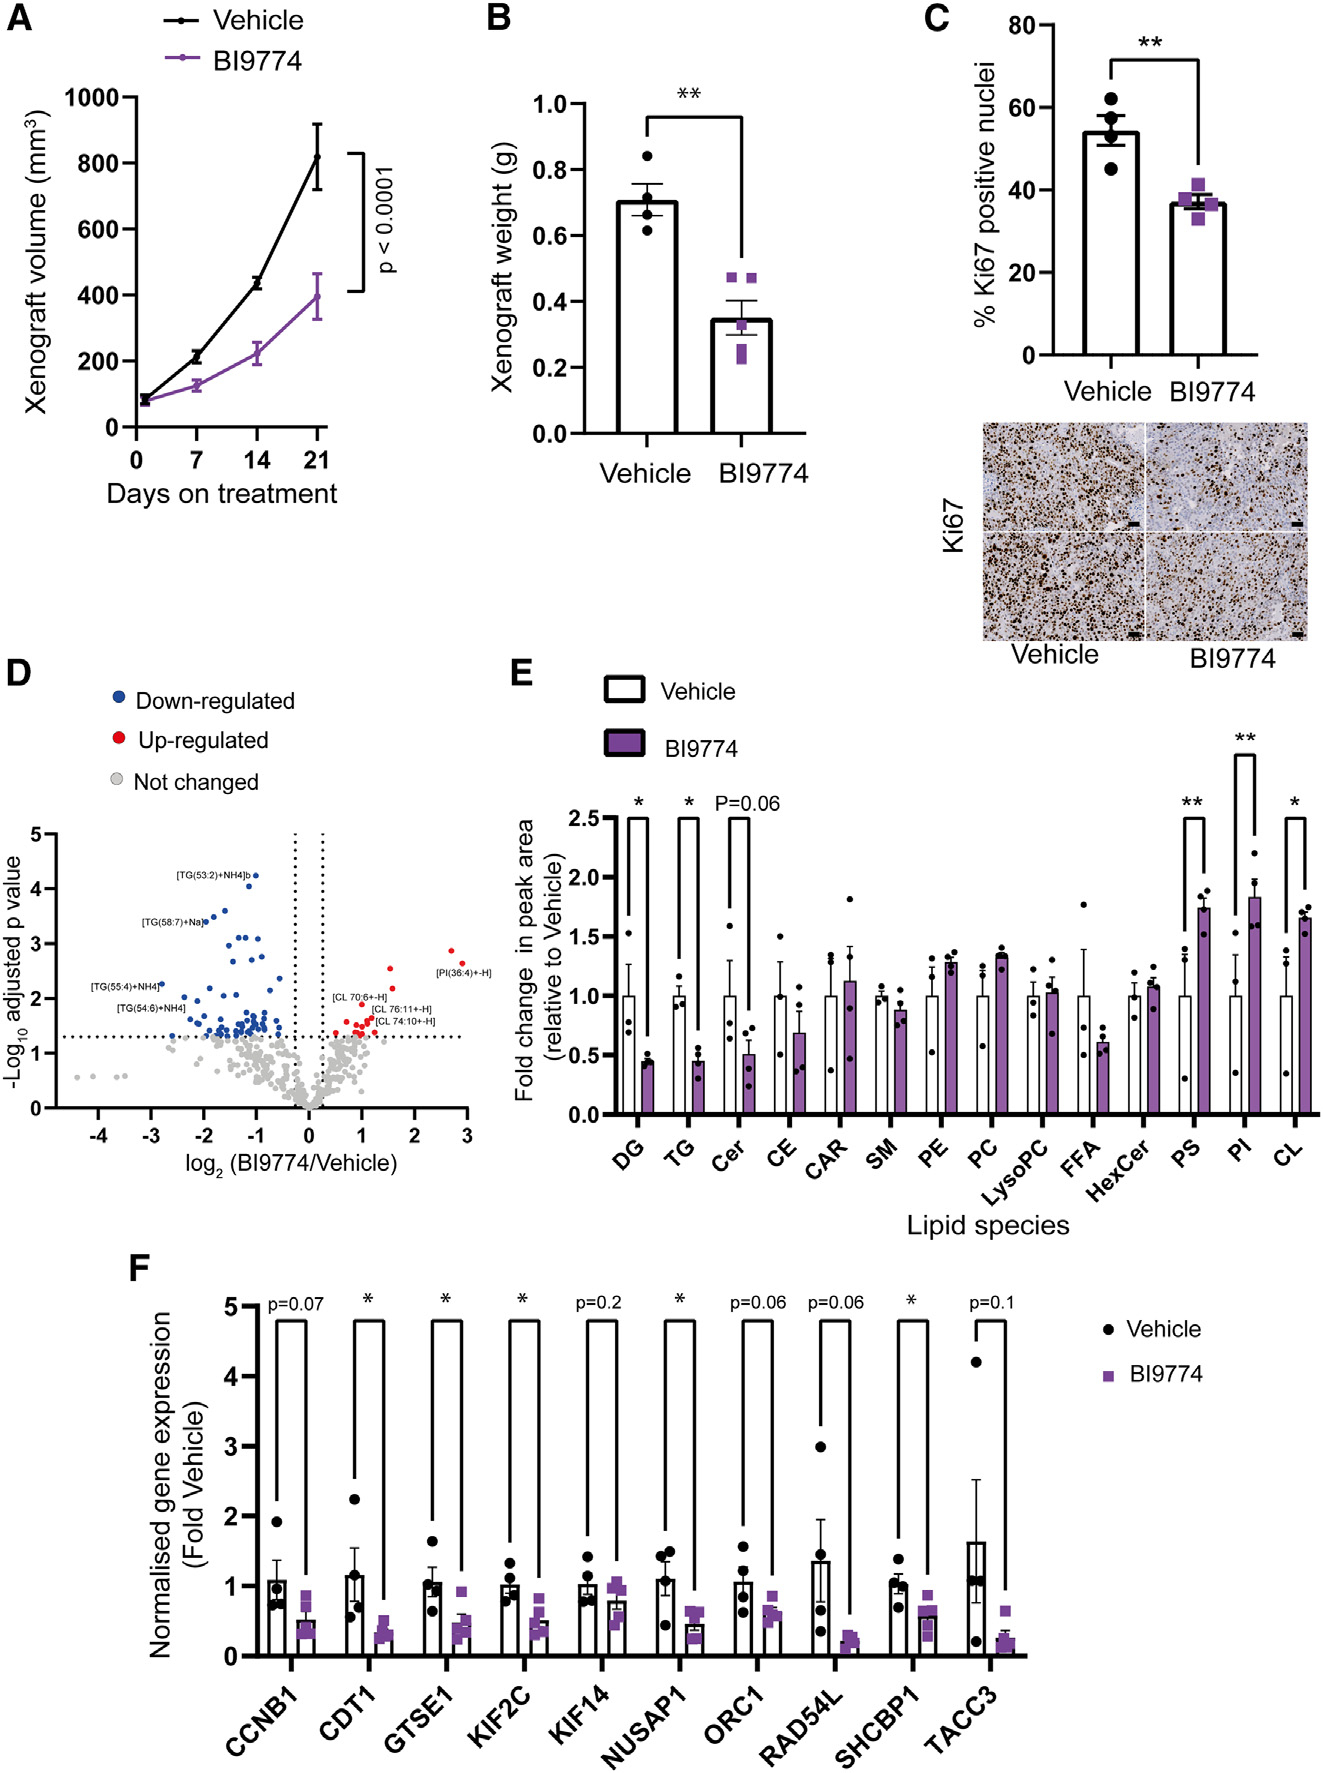
Emerging evidence indicates that metabolic dysregulation drives prostate cancer (PCa) progression and metastasis. AMP-activated protein kinase (AMPK) is a master regulator of metabolism, although its role in PCa remains unclear. Here, we show that genetic and pharmacological activation of AMPK provides a protective effect on PCa progression in vivo. We show that AMPK activation induces PGC1α expression, leading to catabolic metabolic reprogramming of PCa cells. This catabolic state is characterized by increased mitochondrial gene expression, increased fatty acid oxidation, decreased lipogenic potential, decreased cell proliferation, and decreased cell invasiveness. Together, these changes inhibit PCa disease progression. Additionally, we identify a gene network involved in cell cycle regulation that is inhibited by AMPK activation. Strikingly, we show a correlation between this gene network and PGC1α gene expression in human PCa. Taken together, our findings support the use of AMPK activators for clinical treatment of PCa to improve patient outcome.

Keywords: AMPK; CP: Cancer; CP: Metabolism; PGC1α; cell cycle regulation; fatty acid oxidation; high-fat diet; lipogenesis; metabolism; metastasis; mitochondria; prostate cancer.


Conflict of interest statement

Declaration of interests The authors declare no competing interests.

Figures

Figure 1.
Figure 1.. AMPK activation protects against disease progression in a Pten−/− mouse model of prostate cancer
(A) Quantification of pathological grading from H&E-stained sections isolated from the dorsolateral prostate of 1-year-old mice. AdCa, adenocarcinoma. Significant difference between the AdCa-free group vs. AdCa and advanced AdCa is shown using Fisher’s exact test (two-sided p value); **p < 0.01 (n = 15 for Pten−/−, n = 10 for Pten−/−;AmpkACT). A representative H&E-stained prostate section isolated from either a Pten−/− or Pten−/−;AmpkACT mouse is shown below and illustrates AdCa or PIN4, respectively. The area of stromal invasion by AdCa in the section from the Pten−/− mouse is indicated by an arrow. Scale bar, 60 μm. (B) Weight of whole prostate isolated from 1-year-old mice. A representative image of prostates from wild-type (WT), Pten−/−, and Pten−/−;AmpkACT mice is shown. Data are means ± SEM (n = 14–19 per genotype). One-way ANOVA with Tukey’s post hoc test was used to determine difference between genotypes; **p < 0.01, ****p < 0.001. (C) Percentage of Ki-67-positive cells in prostate epithelium of 1-year-old mice. Representative images of Ki-67-stained sections for each genotype are shown. Data are presented as mean ± SEM (n = 6 per genotype). Two equivalently sized regions of interest per lobe (anterior, dorsolateral, and ventral lobes) were quantified, representing at least 10,000 epithelial cells in total per section. Student’s t test was used to determine significant difference between genotypes; *p < 0.05. (D and E) At 40 weeks of age, Pten−/− and Pten−/−;AmpkACT mice were fed a high-fat diet (HFD) for 12 weeks, and prostates were harvested at 1 year of age. (D) Body weight was measured weekly after the start of HFD feeding. Comparable body weights of Pten−/− mice on a chow diet are shown at 40 and 52 weeks of age for reference. (E) Quantification of pathological grading from H&E-stained sections of the dorsolateral lobe. Significant difference between the AdCa-free group vs. all other groups is shown using Fisher’s exact test (two-sided p value); ***p < 0.005 (n = 10 for Pten−/−, n = 7 for Pten−/−;AmpkACT).
Figure 2.
Figure 2.. AMPK activation leads to upregulation of Pgc1α and induction of Pgc1α target gene expression
RNA sequencing (RNA-seq) was performed on whole prostate tissue from Pten−/− and Pten−/−;AmpkACT mice aged 17 weeks (n = 6 per genotype). (A) Volcano plot summarizing effect of AMPK activation in Pten−/− prostates (log2 fold change > 1.2, adjusted p < 0.05). (B) Gene set enrichment analysis (GSEA) was performed, and top significant hits are shown (false discovery rate [FDR] q < 0.005 for all hallmark gene sets shown). (C) Heatmap of differentially expressed mitochondrial genes using MitoCarta 2.0. (D) Representative images of TOMM20 staining in dorsolateral prostate sections taken from Pten−/− and Pten−/−;AmpkACT mice aged to either 17 or 52 weeks. Scale bar, 50 μm. (E) Pgc1α mRNA (Ppargc1a) expression in prostate tissue from Pten−/− and Pten−/−;AmpkACT mice aged 17 weeks. Data are means ± SEM (n = 6 mice per genotype); Student’s t test was used to determine significant differences between genotypes; ***p < 0.005. (F) GSEA plot for the PGC1α target custom gene set (123 genes; Table S1). (G) Lipid-dependent oxygen consumption in prostate organoids generated from Pten−/− and Pten−/−;AmpkACT mice aged 1 year in the presence and absence of exogenous palmitate (PAL; 150 μM). The oxygen consumption rate (OCR) was measured on an Agilent Seahorse XFe96 analyzer before and after addition of etomoxir (100 μM). Lipid-dependent O2 consumption (%) was calculated per well as (baseline OCR − etomoxir OCR)/baseline OCR) × 100. Data from two independent organoid preparations from different mice are shown. Data are means ± SEM. n = 10–14 organoids (wells) per genotype. One-way ANOVA with Tukey’s post hoc test was used to determine significant differences between genotypes; *p < 0.05, ***p < 0.005, ****p < 0.001. (H and I) PGC1α mRNA (PPARGC1A) expression in human PCa separated by disease-free survival (DFS) using the TCGA PRAD (n = 497) dataset (H) and the GSE21034 (n = 150) dataset (I).
Figure 3.
Figure 3.. AMPK activation significantly impacts lipid homeostasis in the Pten−/− prostate
(A) Proteomics analysis was performed on prostate tissue from Pten−/− and Pten−/−;AmpkACT mice aged 17 weeks (n = 6 per genotype). Comparison between RNA-seq GSEA (FDR q < 0.005) and proteomics (FDR q < 0.1) protein set enrichment analysis is shown. (B) Protein set enrichment analysis plot for PGC1α target proteins derived from the custom gene set (123 genes; Table S1) based on protein expression data for 81 proteins identified for Pten−/−;AmpkACT versus Pten−/−. (C) Protein expression of key enzymes involved in fatty acid synthesis. Data are means ± SEM. Student’s t test was used to determine significant differences between genotypes; *p < 0.05, **p < 0.01, ***p < 0.005. (D) Lipidomics analysis was performed on prostate tissue from WT, Pten−/−, and Pten−/−;AmpkACT mice aged 17 weeks (n = 4 per genotype). A volcano plot summarizing the effect of AMPK activation in the Pten−/− prostate on individual lipid species (fold change > 1.2; adjusted p < 0.05) is shown. (E) Abundance of different lipid classes in WT, Pten−/−, and Pten−/−;AmpkACT prostates. Data are plotted as fold change relative to Pten−/− and are the means ± SEM (n = 4 per genotype). Two-way ANOVA with uncorrected Fisher’s LSD (least significant difference) was used to determine significant differences between groups; *p < 0.05, **p < 0.01, ***p < 0.005, ****p < 0.001. NES, normalized enrichment score; ACC1, acetyl-CoA carboxylase 1; ACLY, ATP-citrate lyase; FASN, fatty acid synthase; DG, diglyceride; TG, triglyceride; Cer, ceramide; CE, cholesteroyl esters; CAR, acylcarnitine; SM, sphingomyelin; PE, phosphatidylethanolamine; PC, phosphatidylcholine; FFA, free fatty acid; PS, phosphatidylserine; PI, phosphatidylinositol; CL, cardiolipin.
Figure 4.
Figure 4.. AMPK activation leads to PGC1α induction in a human CRPC cell model and inhibits PCa cell proliferation and invasion
(A) Castration-resistant prostate cancer (CRPC) C4–2 cells were treated with the AMPK activator (BI9774; 0, 10, and 25 μM) for 1 week, and PGC1α expression was determined by western blotting. (B) Lipid-dependent oxygen consumption for C4–2 cells treated for 1 week with or without 10 μM BI9774 was determined in the presence of exogenous PAL (150 μM). The OCR was measured on an Agilent Seahorse XFe96 analyzer before and after addition of etomoxir (50 μM). Lipid-dependent O2 consumption (%) was calculated per well as (baseline OCR − etomoxir OCR)/baseline OCR) × 100 (n = 11 per group). (C–E) ATP abundance was determined in C4–2 cells cultured with or without BI9774 (10 μM) for 7 days (n = 10 per group). Proliferation rate (D) and invasion rate (E) were determined for C4–2 cells treated as in (C) (n = 4 per group). (F) Western blot analysis of FBP1 and SNAI1 expression in C4–2 cells treated as in (C) and quantification (n = 4 per group). In all cases, data shown are means ± SEM, and statistical significance was determined using Student’s t test. **p < 0.01, ***p < 0.005, ****p < 0.001.
Figure 5.
Figure 5.. AMPK activation leads to downregulation of a transcriptional network required for PCa progression
(A) Expression of 32 genes negatively correlated with DFS in prostate tissue from Pten−/− and Pten−/−;AmpkACT mice aged 17 weeks (mean ± SEM, n = 6 per genotype). Statistical significance was determined using Student’s t test. *p < 0.05, **p < 0.01, ***p < 0.005, ****p < 0.001. The inset shows the interacting network of the 32 genes using STRING. (B) Quantification of mRNA expression using qRT-PCR for a subset of 13 “cell cycle” genes in human CRPC C4–2 cells treated with or without BI9774 (10 μM) for 7 days. Expression is normalized to UBC expression and shown as fold change relative to untreated cells. Data shown are means ± SEM (n = 4, 5), and statistical significance was determined using Student’s t test. *p < 0.05, **p < 0.01, ***p < 0.005, ****p < 0.001. (C) Gene expression of an “AMPK-cell cycle” curated gene set (10 genes) in human PCa separated by disease free survival (DFS) using the TCGA PRAD (n = 497) dataset. The inset shows tabulated data for hazard ratio (HR) between Q4 and Q1 and p value. (D) Correlation of gene expression with PGC1α (PPARGC1A) gene expression using the TCGA PRAD (n = 497). The inset shows tabulated data for rank correlation coefficient (R) value and p value. (E–H) AMPK-cell cycle gene expression in human PCa separated by DFS using the GSE21034 (n = 150) dataset. (F–H) Z scores comparing mRNA expression of AMPK-cell cycle gene signature and PPARGC1A between benign tissue, localized cancer, and either metastatic or CRPC from the (F) GSE21034 (benign, n = 29; localized cancer, n = 131; metastasis, n = 19), (G) GSE35988 (benign, n = 12; tumor, n = 49; CRPC, n = 27), and (H) GSE32269 (localized, n = 22; CRPC, n = 29) datasets. Data are presented as Z score of log2 expression values. Significance was tested using Kruskal-Wallis non-parametric test.
Figure 6.
Figure 6.. Pharmacological activation of AMPK inhibits tumor growth in a xenograft model of CRPC
(A) Average tumor volume during 21-day treatment with the AMPK activator BI9774 (30 mg/kg, daily oral gavage) or vehicle control. Significant differences in growth rate were calculated using linear regression analysis. (B) Xenograft weight was determined upon harvest. Data are means ± SEM (n = 4–5 mice per group). (C) Percentage of Ki-67-positive cells in xenograft tumors from mice treated with or without BI9774 (n = 4 per condition, at least 10,000 cells counted per section). Below, representative images of Ki-67-stained sections taken from xenografts isolated from mice treated with either vehicle or Bi9774 are shown (scale bar, 50 μm). Lipidomics analysis was performed on xenograft tissue from mice treated with either vehicle (n = 3) or BI9774 (n = 4). (D) Volcano plot summarizing the effect of pharmacological AMPK activation in the C4–2b xenograft model on individual lipid species (fold change > 1.2, adjusted p < 0.05). (E) Abundance of different lipid classes in xenografts isolated from vehicle- or BI9774-treated mice. Data are plotted as fold change relative to vehicle and are the means ± SEM (n = 3 (vehicle treated) and 4 (BI9774 treated)). Two-way ANOVA with uncorrected Fisher’s LSD was used to determine significant differences between groups; *p < 0.05, **p < 0.01. (F) Quantification of mRNA expression for a subset of 10 “AMPK-cell cycle” genes in xenografts isolated from vehicle- or BI9774-treated mice. Expression is normalized to UBC expression and shown as fold change relative to xenografts from mice treated with vehicle. Data shown are means ± SEM (n = 3–5 xenografts), and statistical significance was determined using Student’s t test. *p < 0.05, **p < 0.01, ***p < 0.005, ****p < 0.001. HexCer, hexosylceramide.

References

    1. Siegel RL, Miller KD, Fuchs HE, and Jemal A (2022). Cancer statistics, 2022. CA. CA. Cancer J. Clin. 72, 7–33. - PubMed
    1. Litwin MS, and Tan HJ (2017). The diagnosis and treatment of prostate cancer: a Review. JAMA 317, 2532–2542. - PubMed
    1. Sumanasuriya S, and De Bono J (2018). Treatment of advanced prostate cancer—a Review of current therapies and future promise. Cold Spring Harb. Perspect. Med. 8, a030635. - PMC - PubMed
    1. Chen M, Zhang J, Sampieri K, Clohessy JG, Mendez L, Gonzalez-Billalabeitia E, Liu XS, Lee YR, Fung J, Katon JM, et al. (2018). An aberrant SREBP-dependent lipogenic program promotes metastatic prostate cancer. Nat. Genet. 50, 206–218. - PMC - PubMed
    1. Chen J, Guccini I, Di Mitri D, Brina D, Revandkar A, Sarti M, Pasquini E, Alajati A, Pinton S, Losa M, et al. (2018). Compartmentalized activities of the pyruvate dehydrogenase complex sustain lipogenesis in prostate cancer. Nat. Genet. 50, 219–228. - PMC - PubMed

Publication types

MeSH terms

Substances