

MALDI IMS-Derived Molecular Contour Maps: Augmenting Histology Whole-Slide Images
- PMID: 37061946
- PMCID: PMC10787559
- DOI: 10.1021/jasms.2c00370
MALDI IMS-Derived Molecular Contour Maps: Augmenting Histology Whole-Slide Images
Abstract
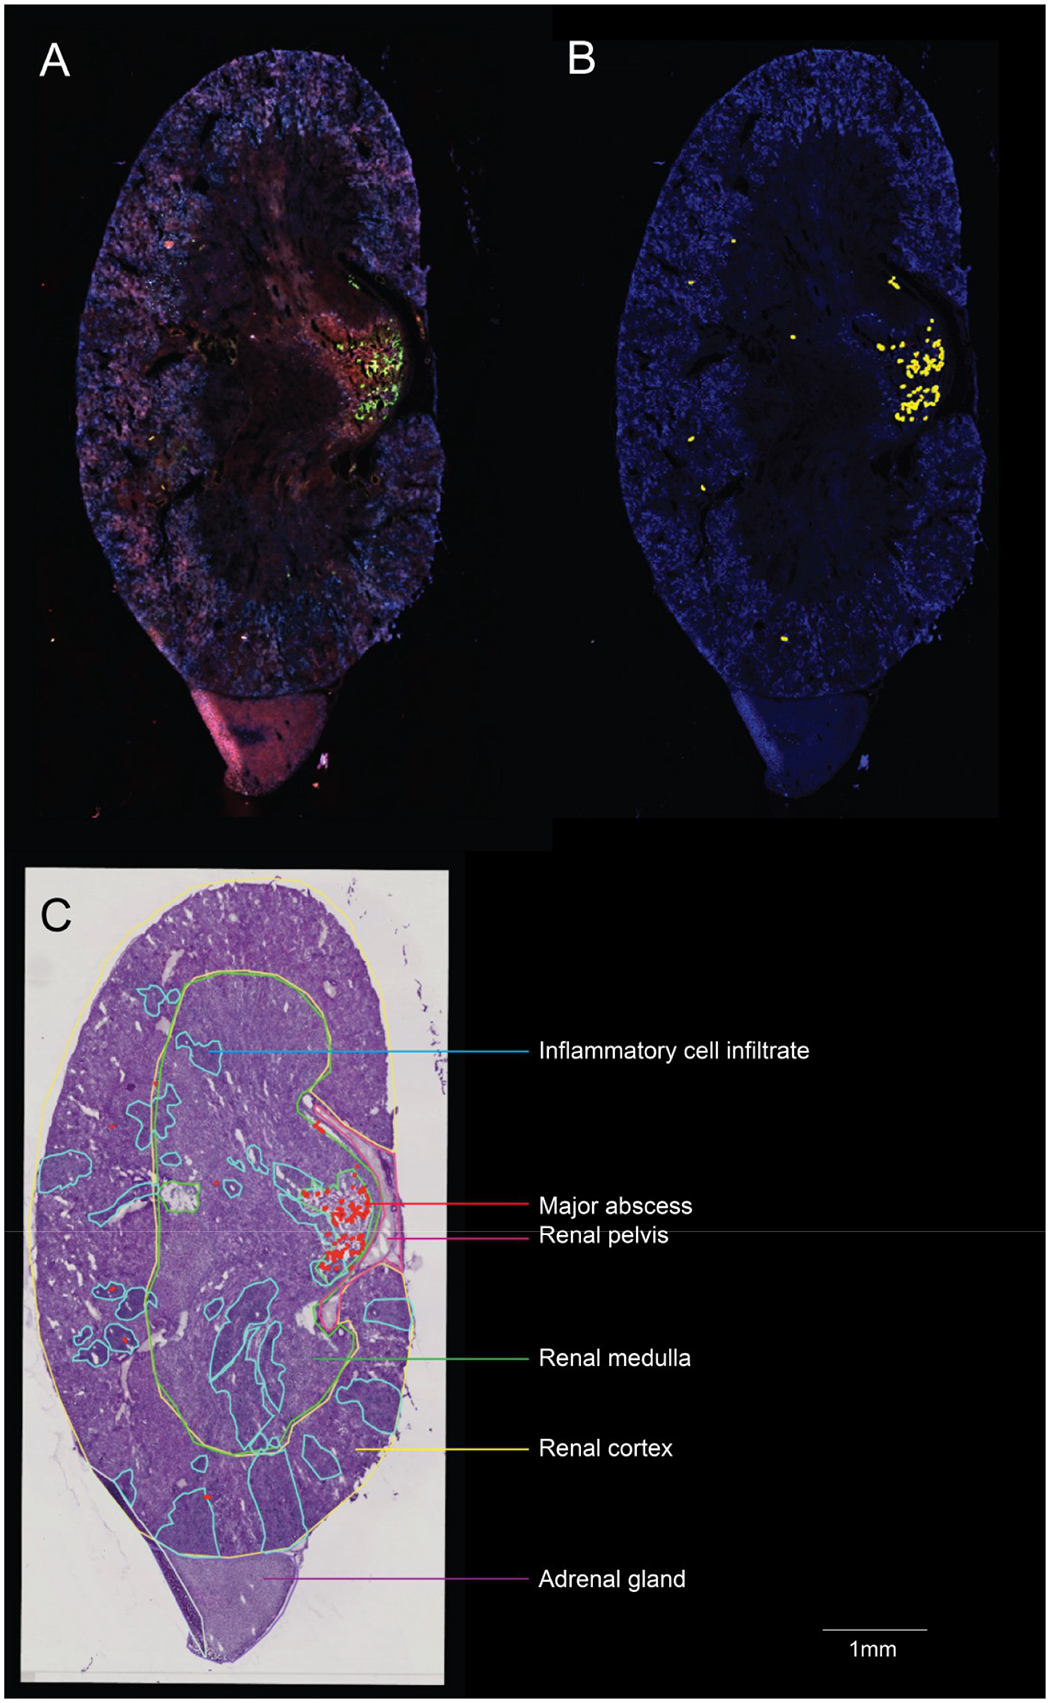
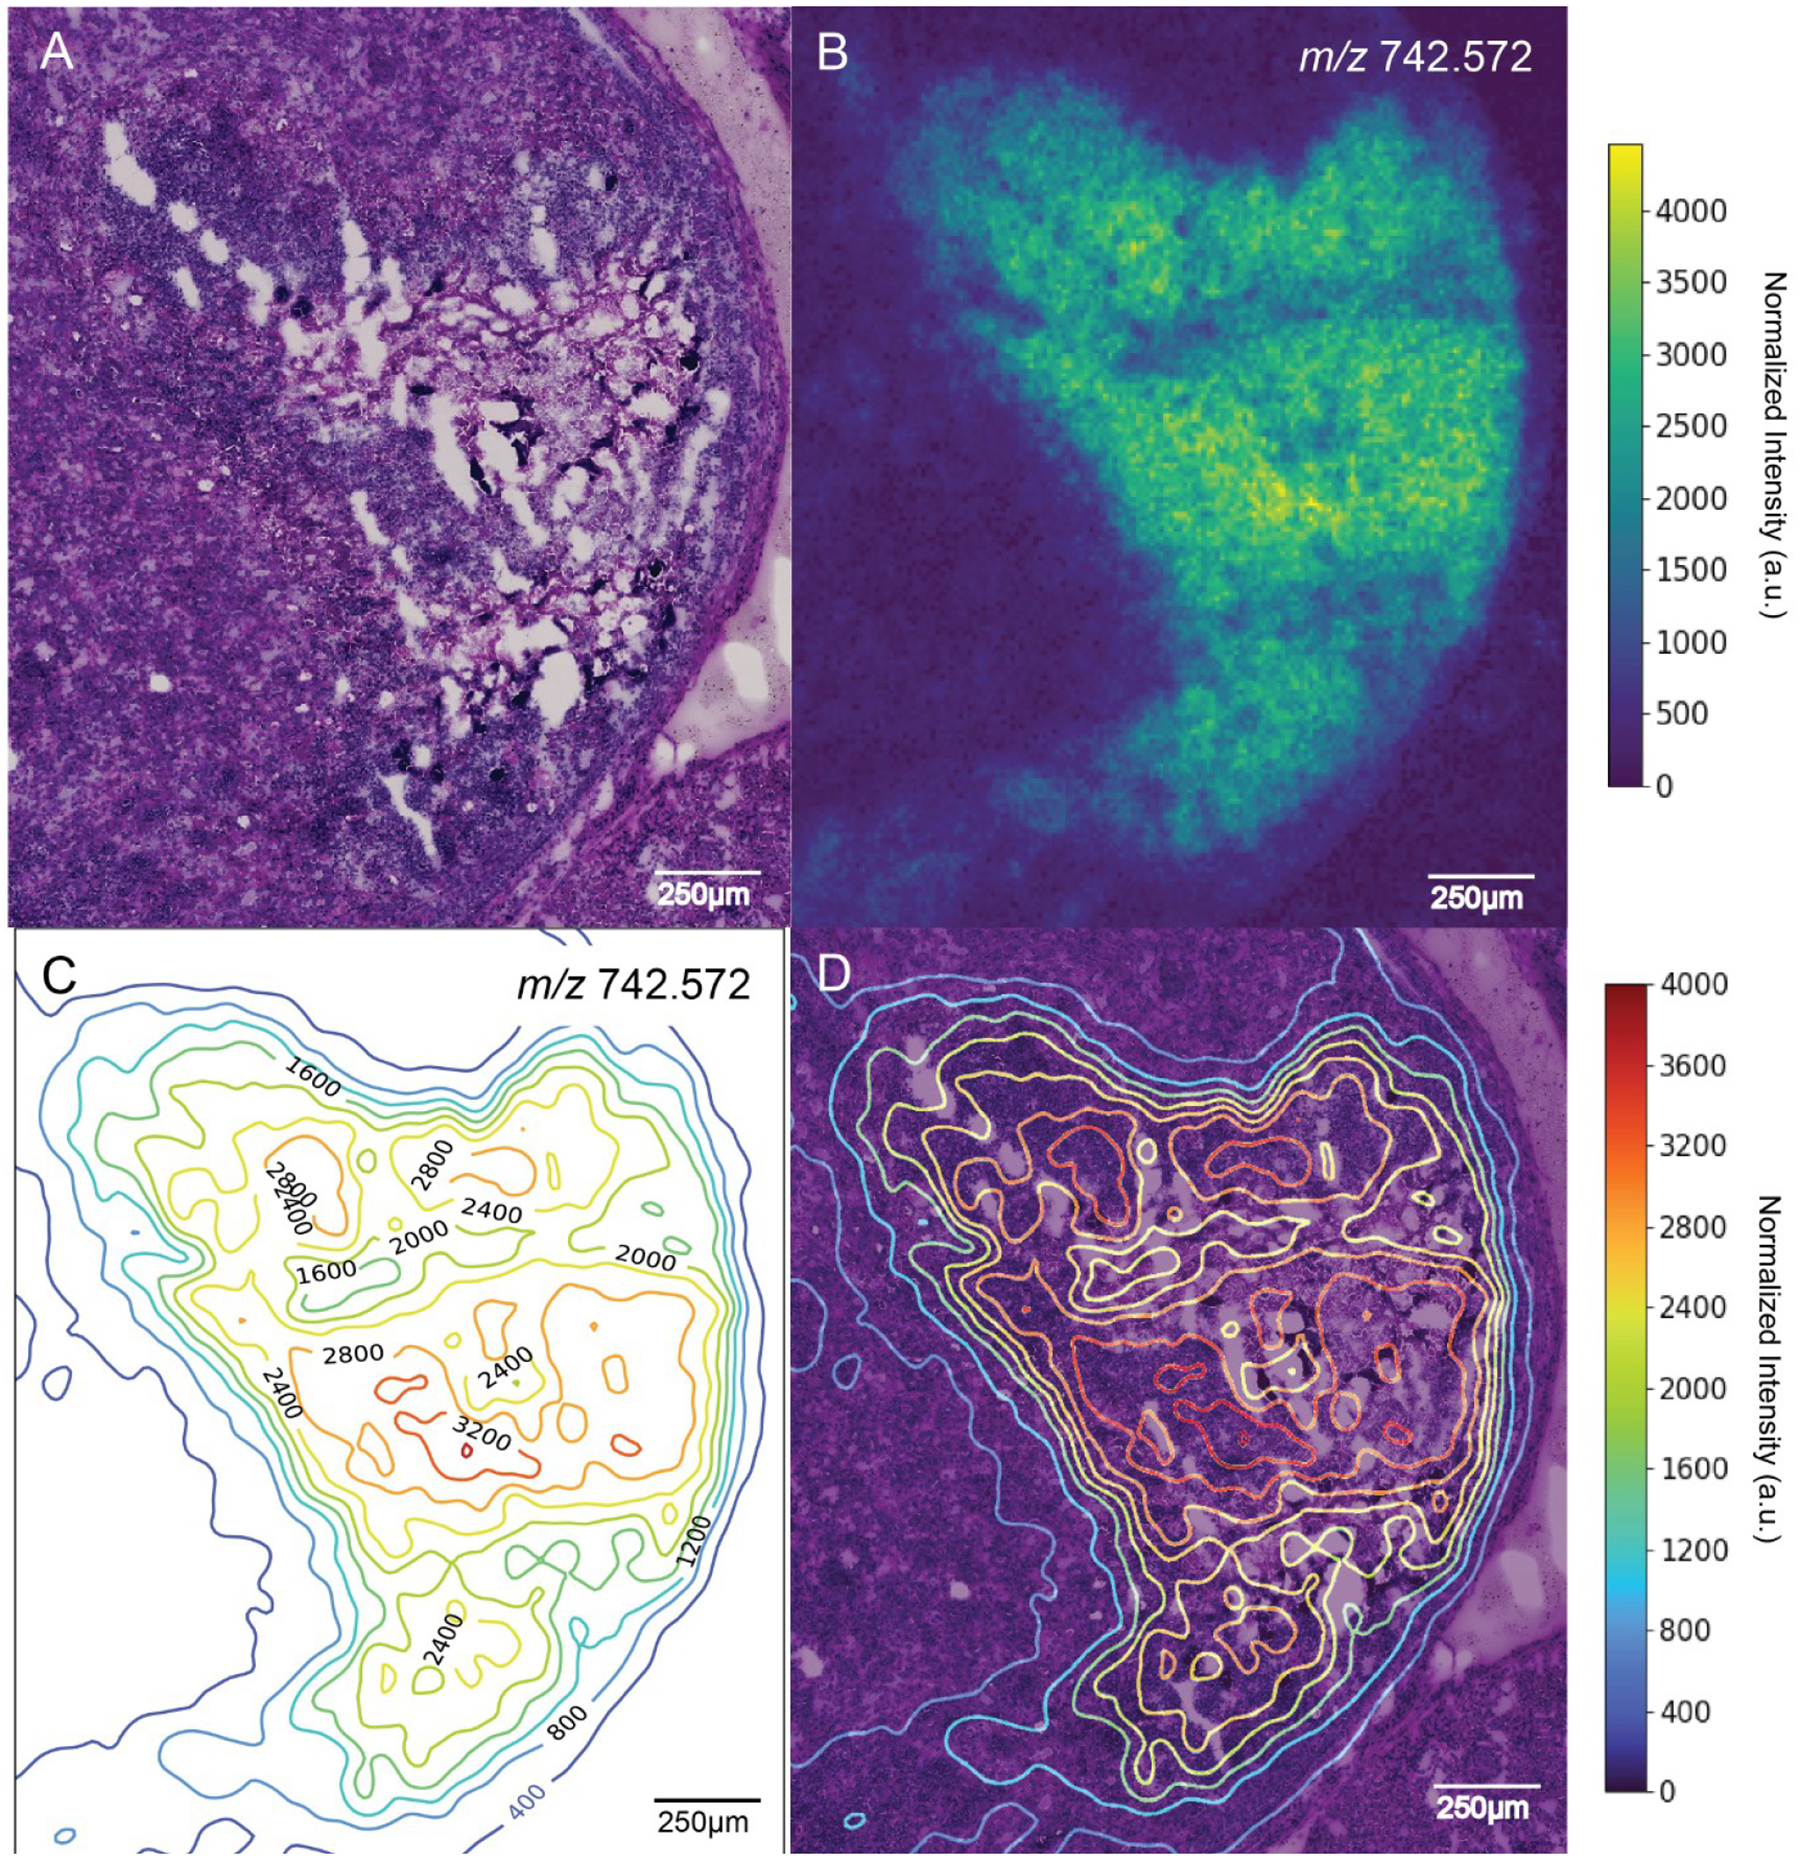
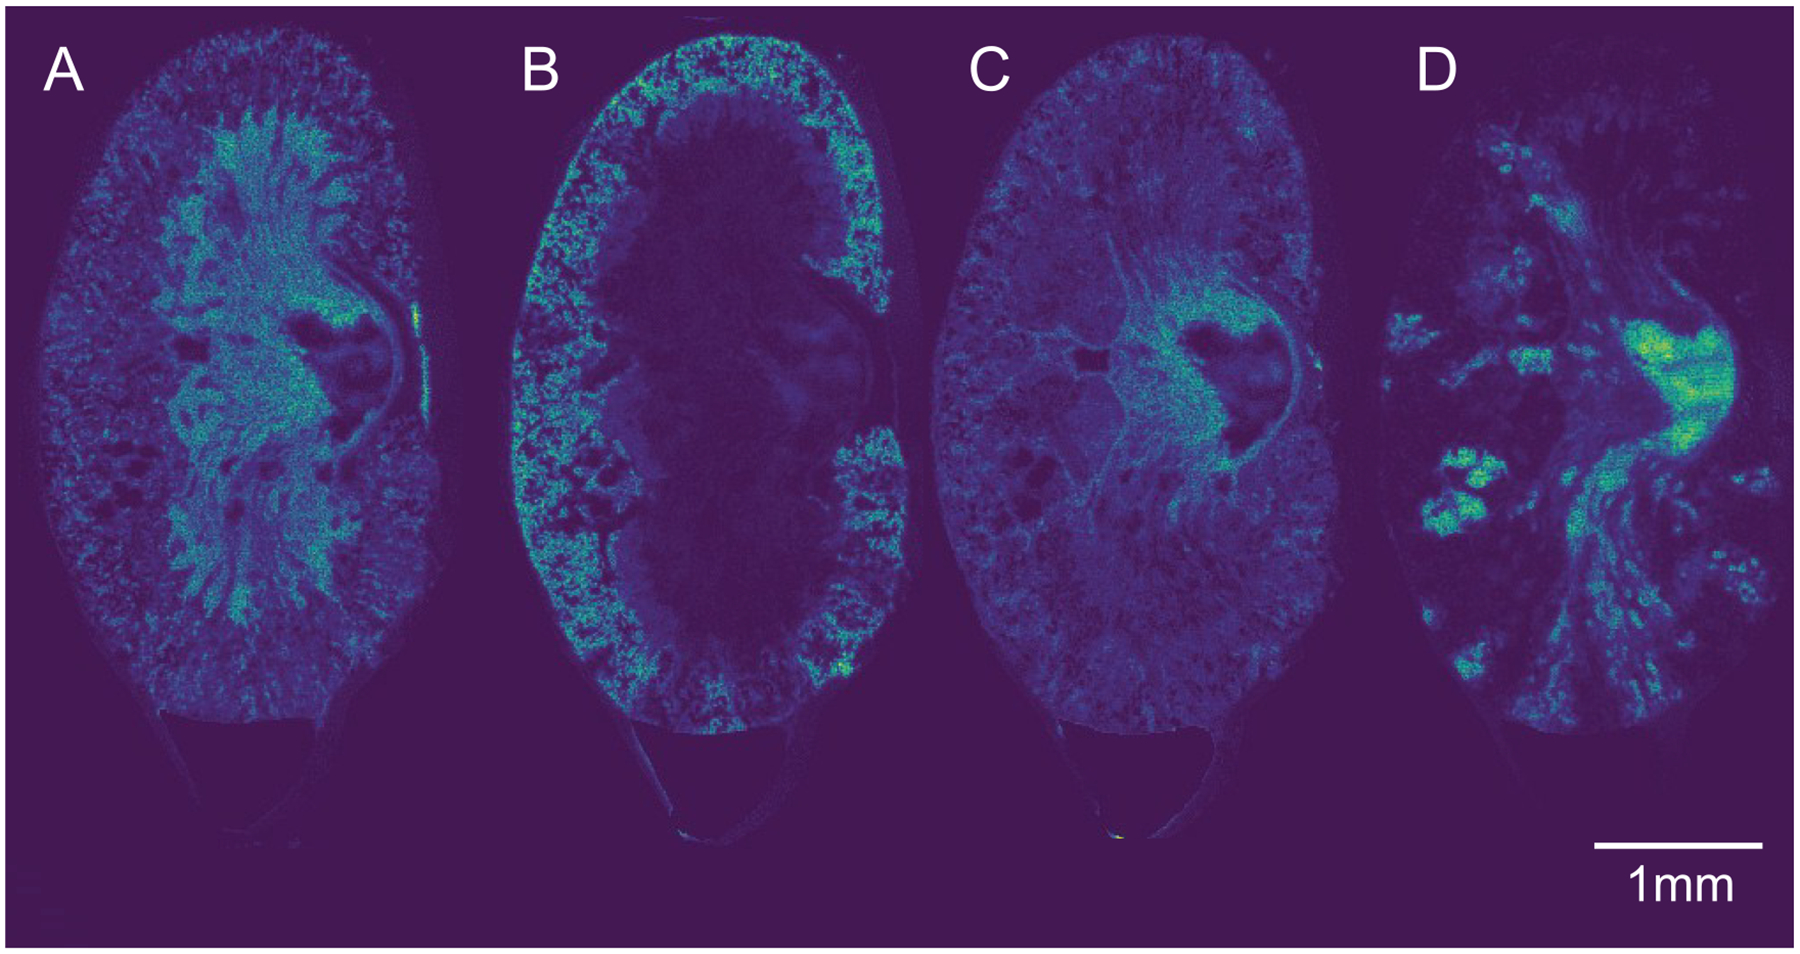
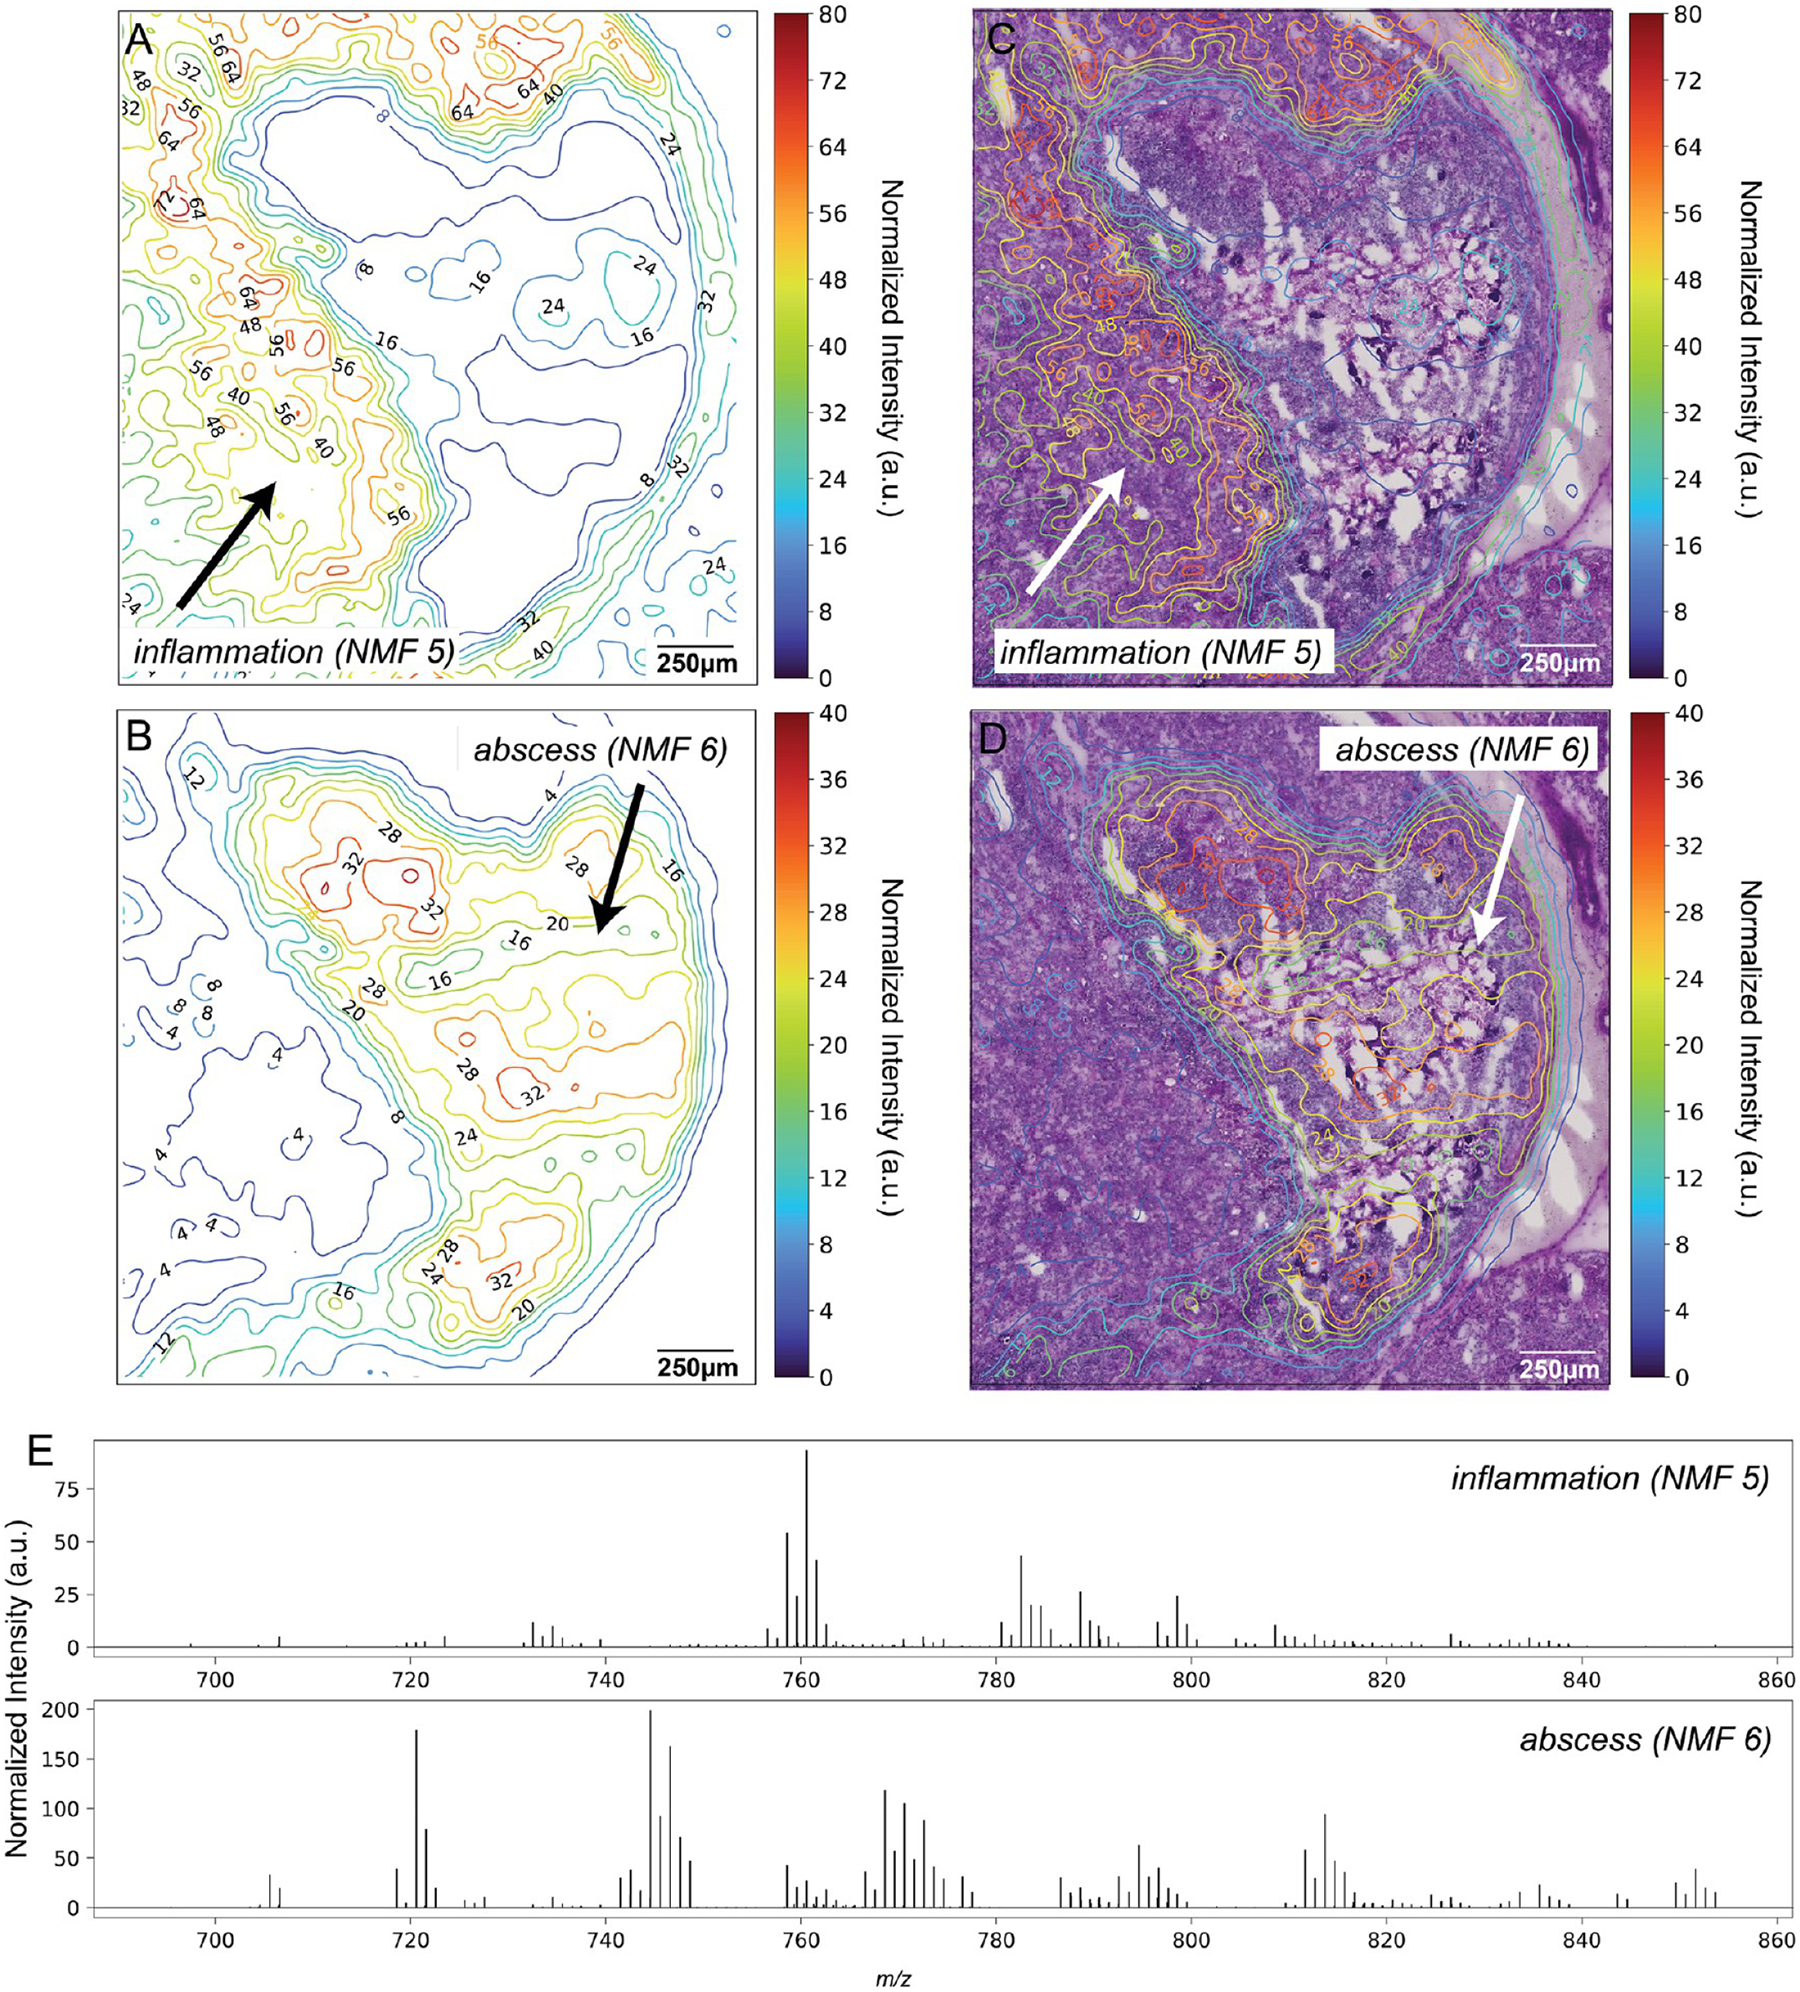
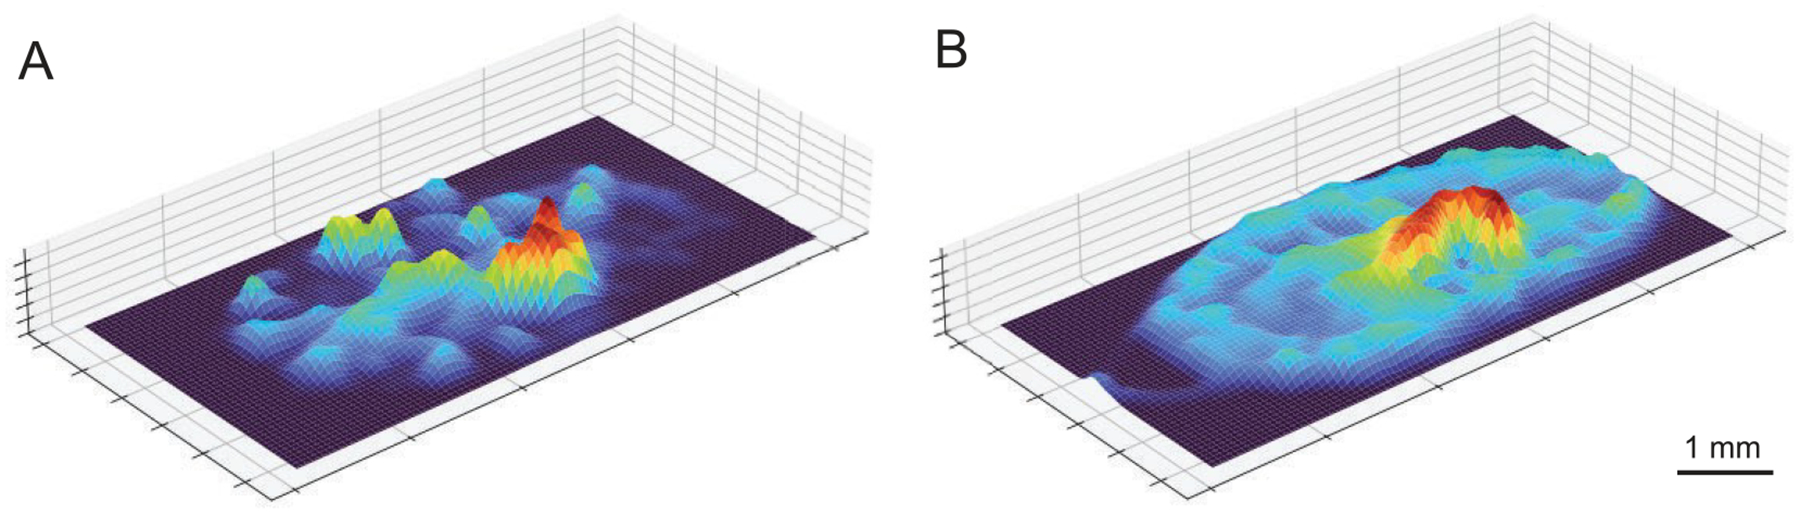
Imaging mass spectrometry (IMS) provides untargeted, highly multiplexed maps of molecular distributions in tissue. Ion images are routinely presented as heatmaps and can be overlaid onto complementary microscopy images that provide greater context. However, heatmaps use transparency blending to visualize both images, obscuring subtle quantitative differences and distribution gradients. Here, we developed a contour mapping approach that combines information from IMS ion intensity distributions with that of stained microscopy. As a case study, we applied this approach to imaging data from Staphylococcus aureus-infected murine kidney. In a univariate, or single molecular species, use-case of the contour map representation of IMS data, certain lipids colocalizing with regions of infection were selected using Pearson's correlation coefficient. Contour maps of these lipids overlaid with stained microscopy showed enhanced visualization of lipid distributions and spatial gradients in and around the bacterial abscess as compared to traditional heatmaps. The full IMS data set comprising hundreds of individual ion images was then grouped into a smaller subset of representative patterns using non-negative matrix factorization (NMF). Contour maps of these multivariate NMF images revealed distinct molecular profiles of the major abscesses and surrounding immune response. This contour mapping workflow also enabled a molecular visualization of the transition zone at the host-pathogen interface, providing potential clues about the spatial molecular dynamics beyond what histological staining alone provides. In summary, we developed a new IMS-based contour mapping approach to augment classical stained microscopy images, providing an enhanced and more interpretable visualization of IMS-microscopy multimodal molecular imaging data sets.
Conflict of interest statement
Notes
The authors declare no competing financial interest. Data presented in the manuscript are available at
Figures
References
-
- Caprioli RM; Farmer TB; Gile J Molecular Imaging of Biological Samples: Localization of Peptides and Proteins Using MALDI-TOF MS. Anal. Chem 1997, 69, 4751. - PubMed
-
- Longuespée R; Casadonte R; Kriegsmann M; Pottier C; Picard de Muller G; Delvenne P; Kriegsmann J; De Pauw E MALDI mass spectrometry imaging: A cutting-edge tool for fundamental and clinical histopathology. PROTEOMICS—Clin. Appl 2016, 10, 701–719. - PubMed
-
- Nilsson A; Goodwin RJA; Shariatgorji M; Vallianatou T; Webborn PJH; Andrén PE Mass spectrometry imaging in drug development. Anal. Chem 2015, 87, 1437–1455. - PubMed
-
- Heeren RMA Getting the picture: The coming of age of imaging MS. Int. J. Mass Spectrom 2015, 377, 672–680.
MeSH terms
Substances
Grants and funding
LinkOut - more resources
Full Text Sources
Research Materials
