. 2023 Jun 2;13(6):1386-1407.
doi: 10.1158/2159-8290.CD-22-1020.

A Transcriptome-Based Precision Oncology Platform for Patient-Therapy Alignment in a Diverse Set of Treatment-Resistant Malignancies

Affiliations

A Transcriptome-Based Precision Oncology Platform for Patient-Therapy Alignment in a Diverse Set of Treatment-Resistant Malignancies

Prabhjot S Mundi et al. Cancer Discov. .

Abstract

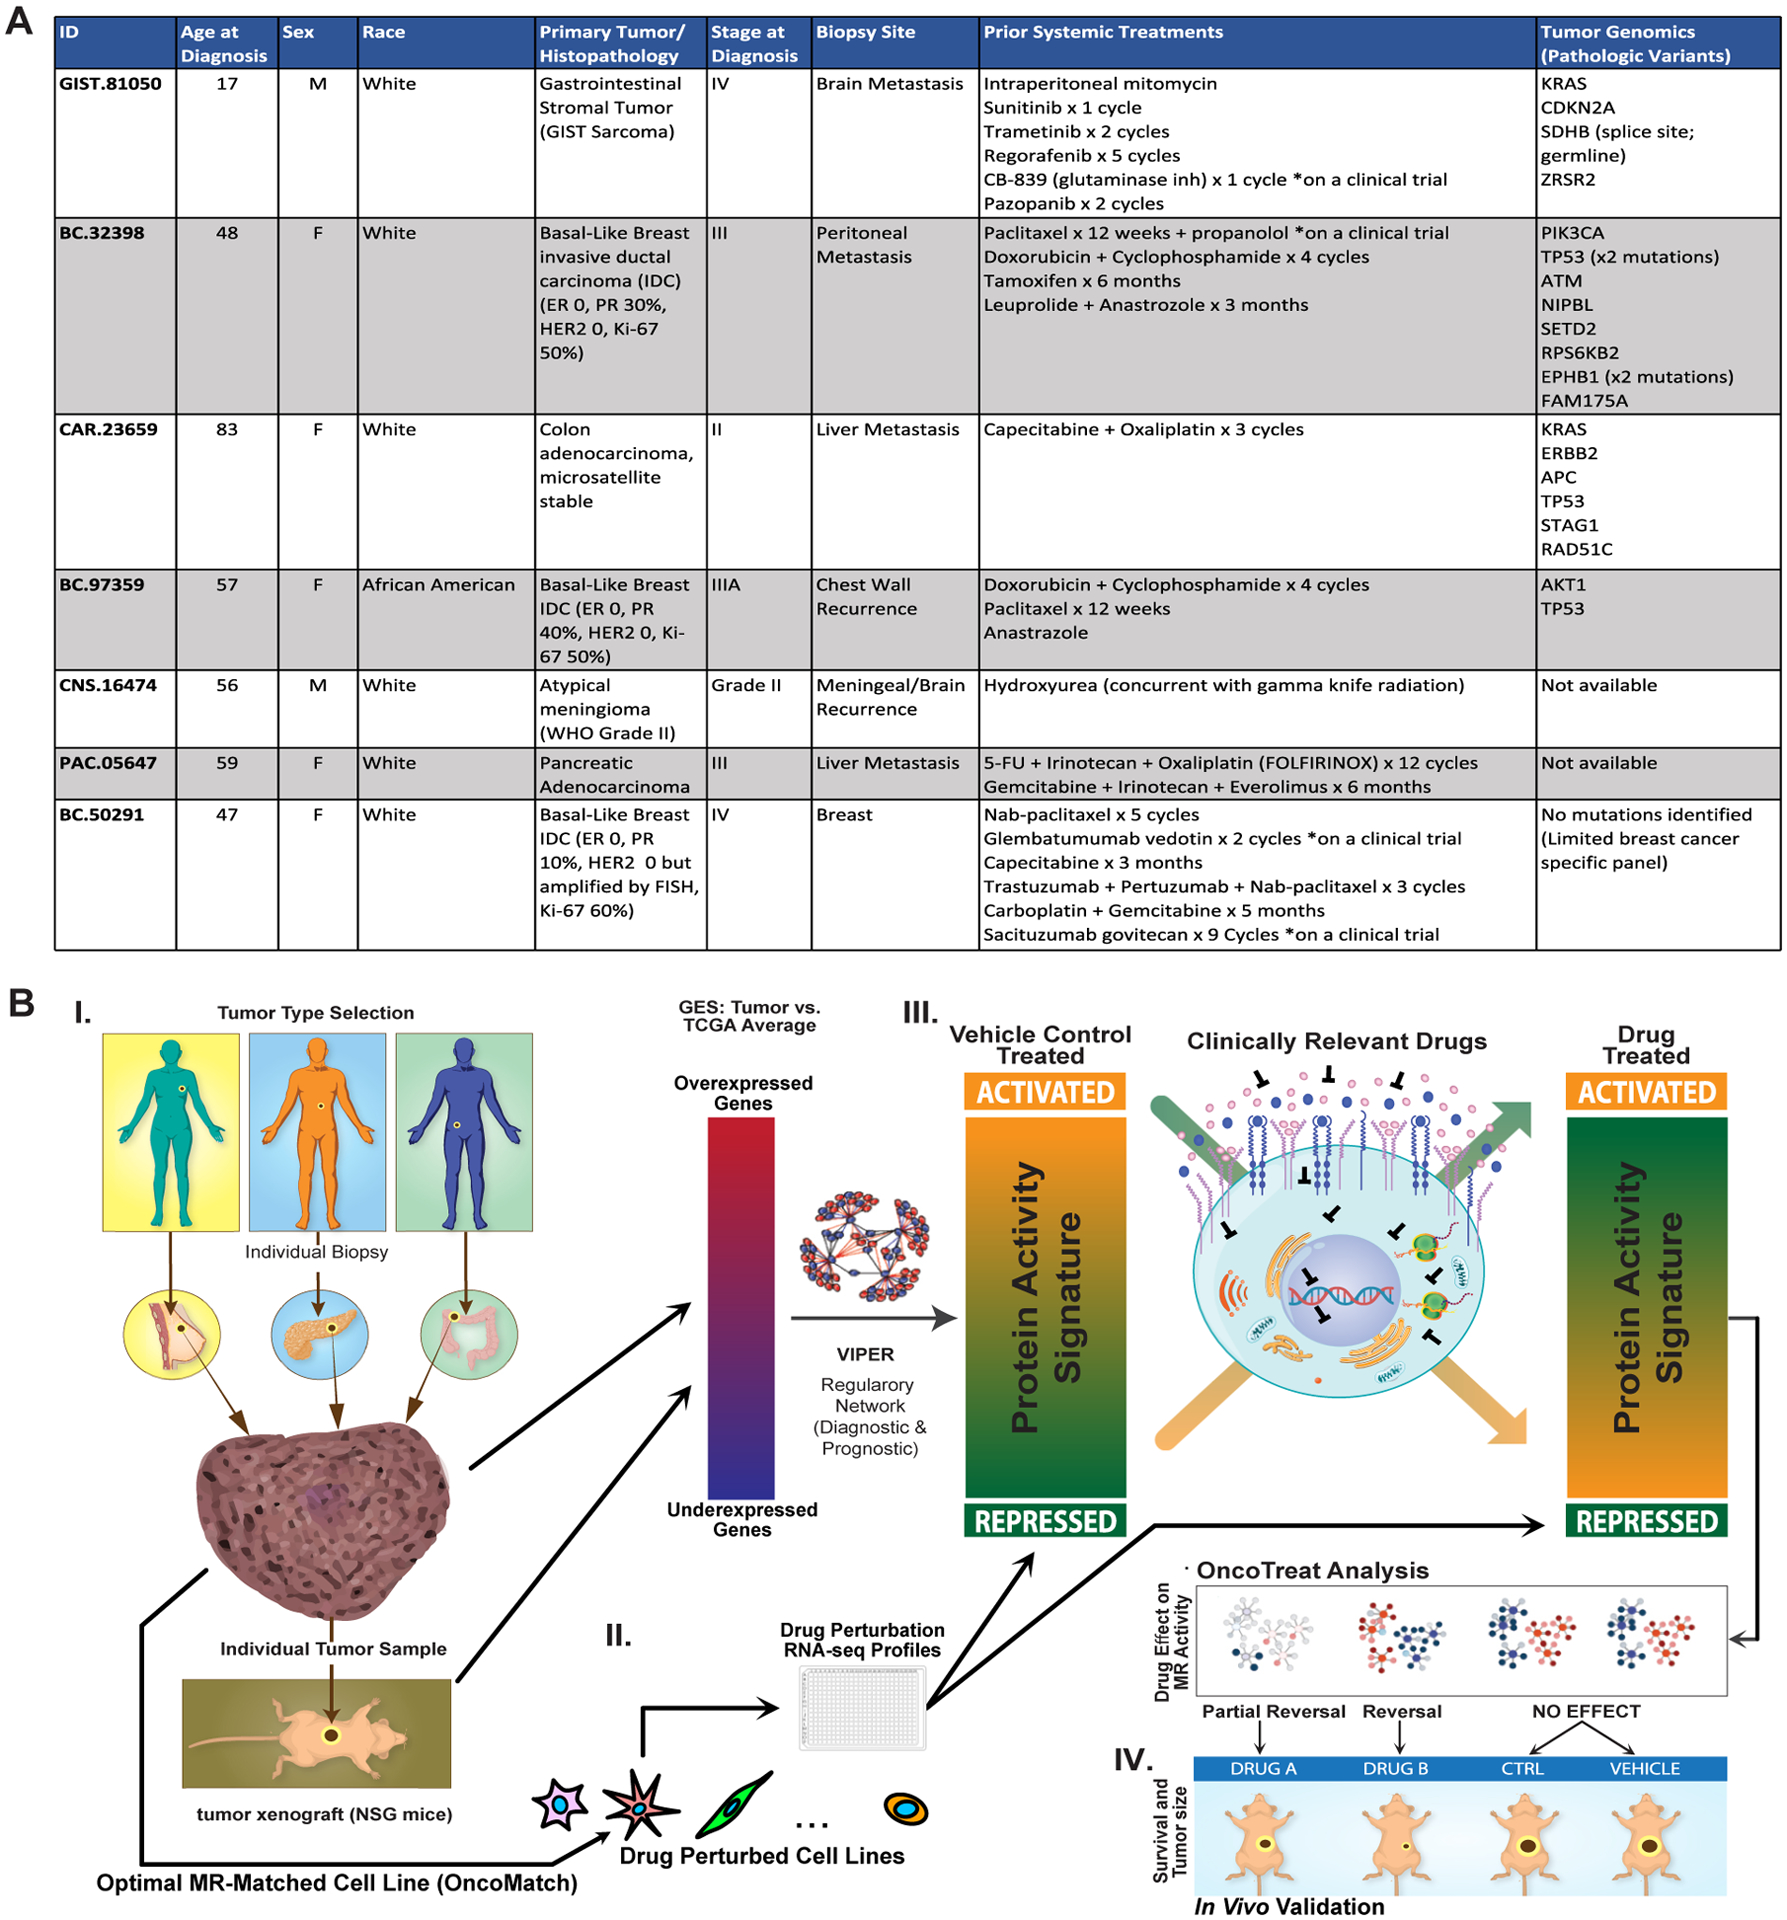
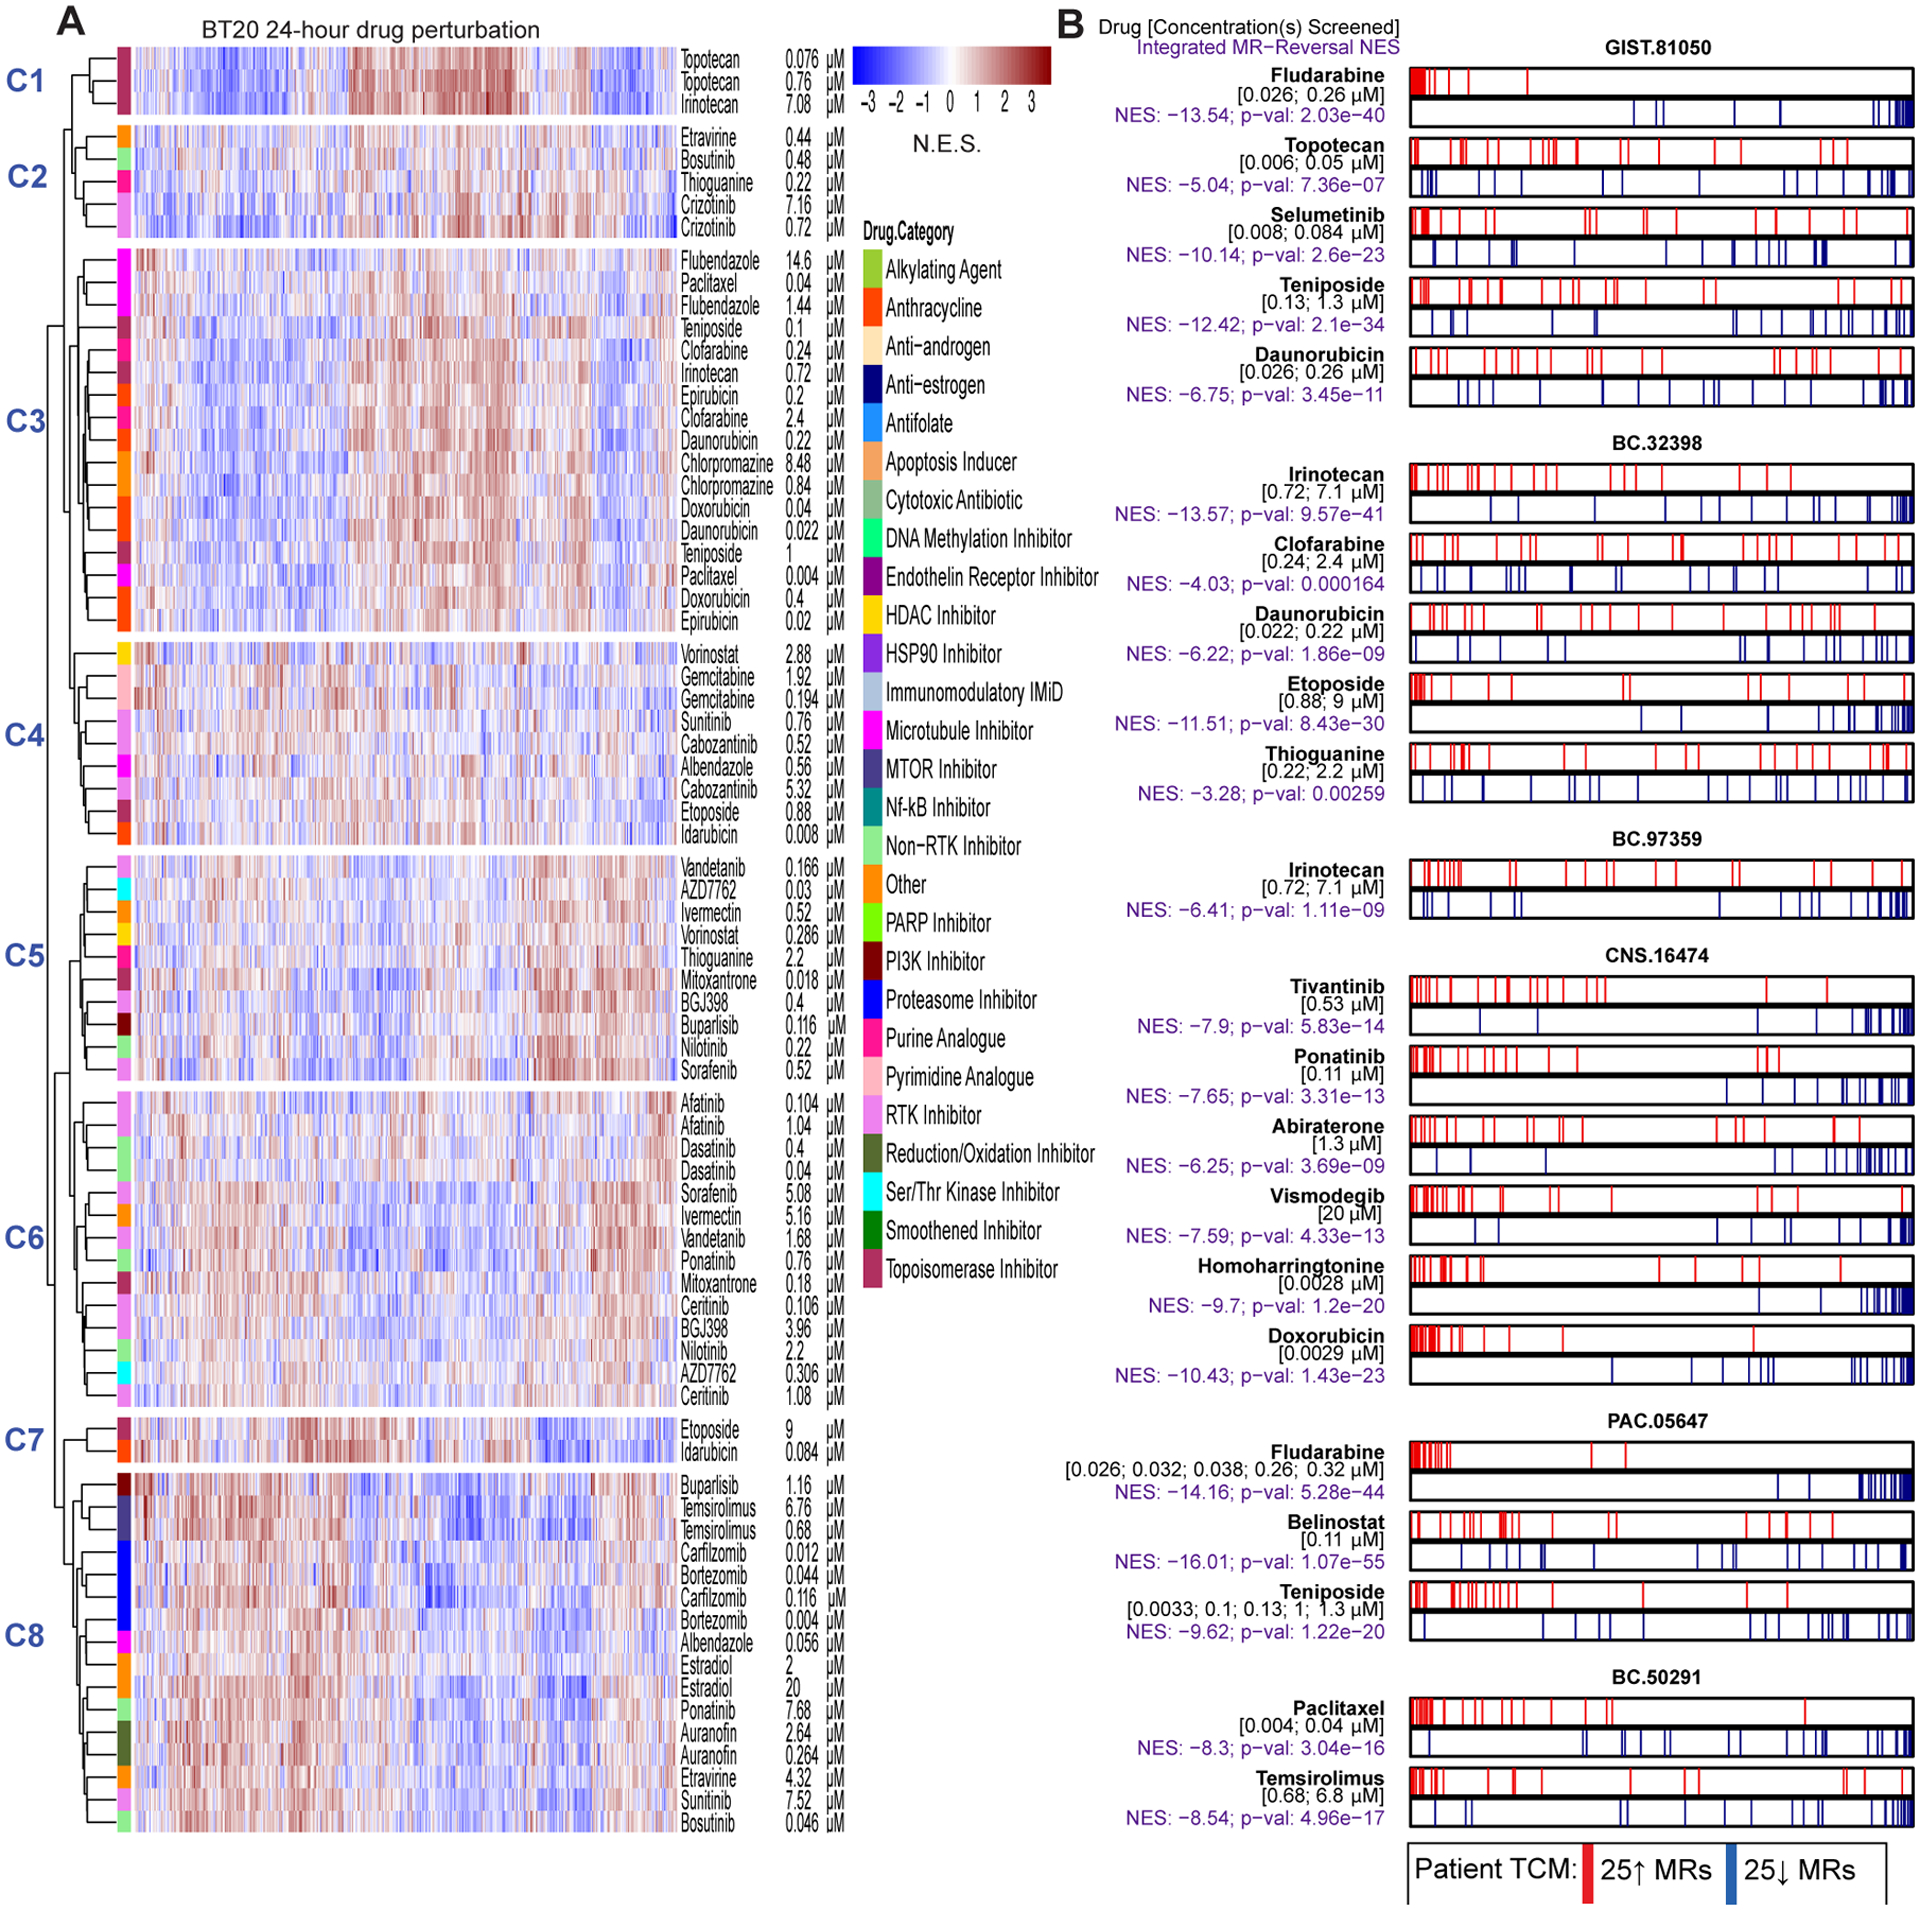
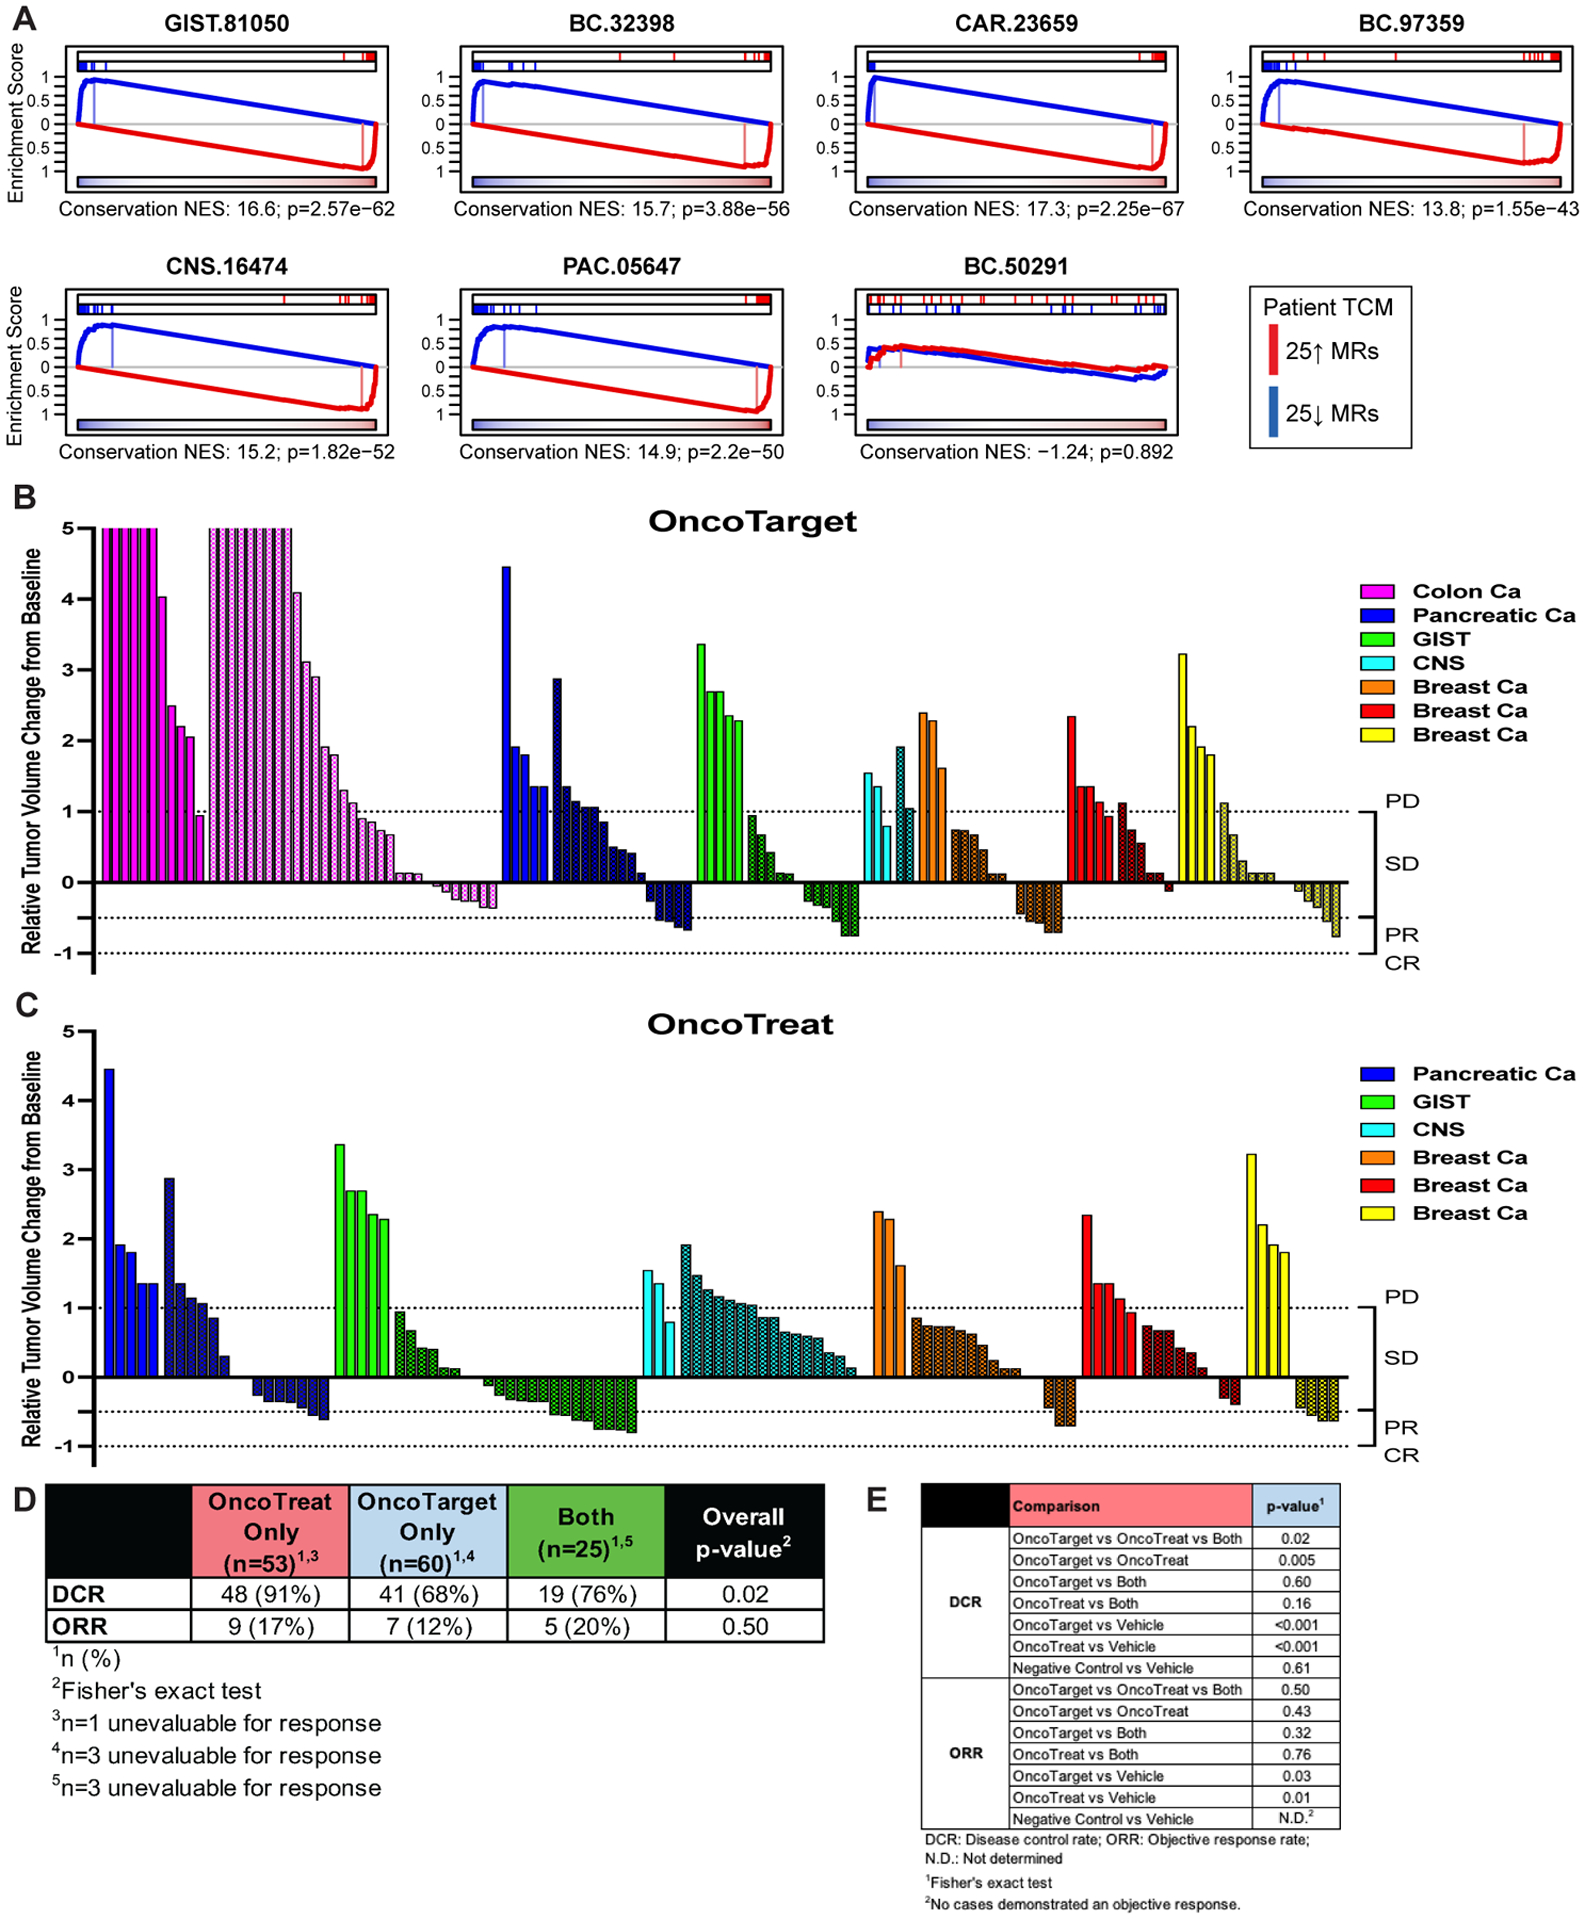
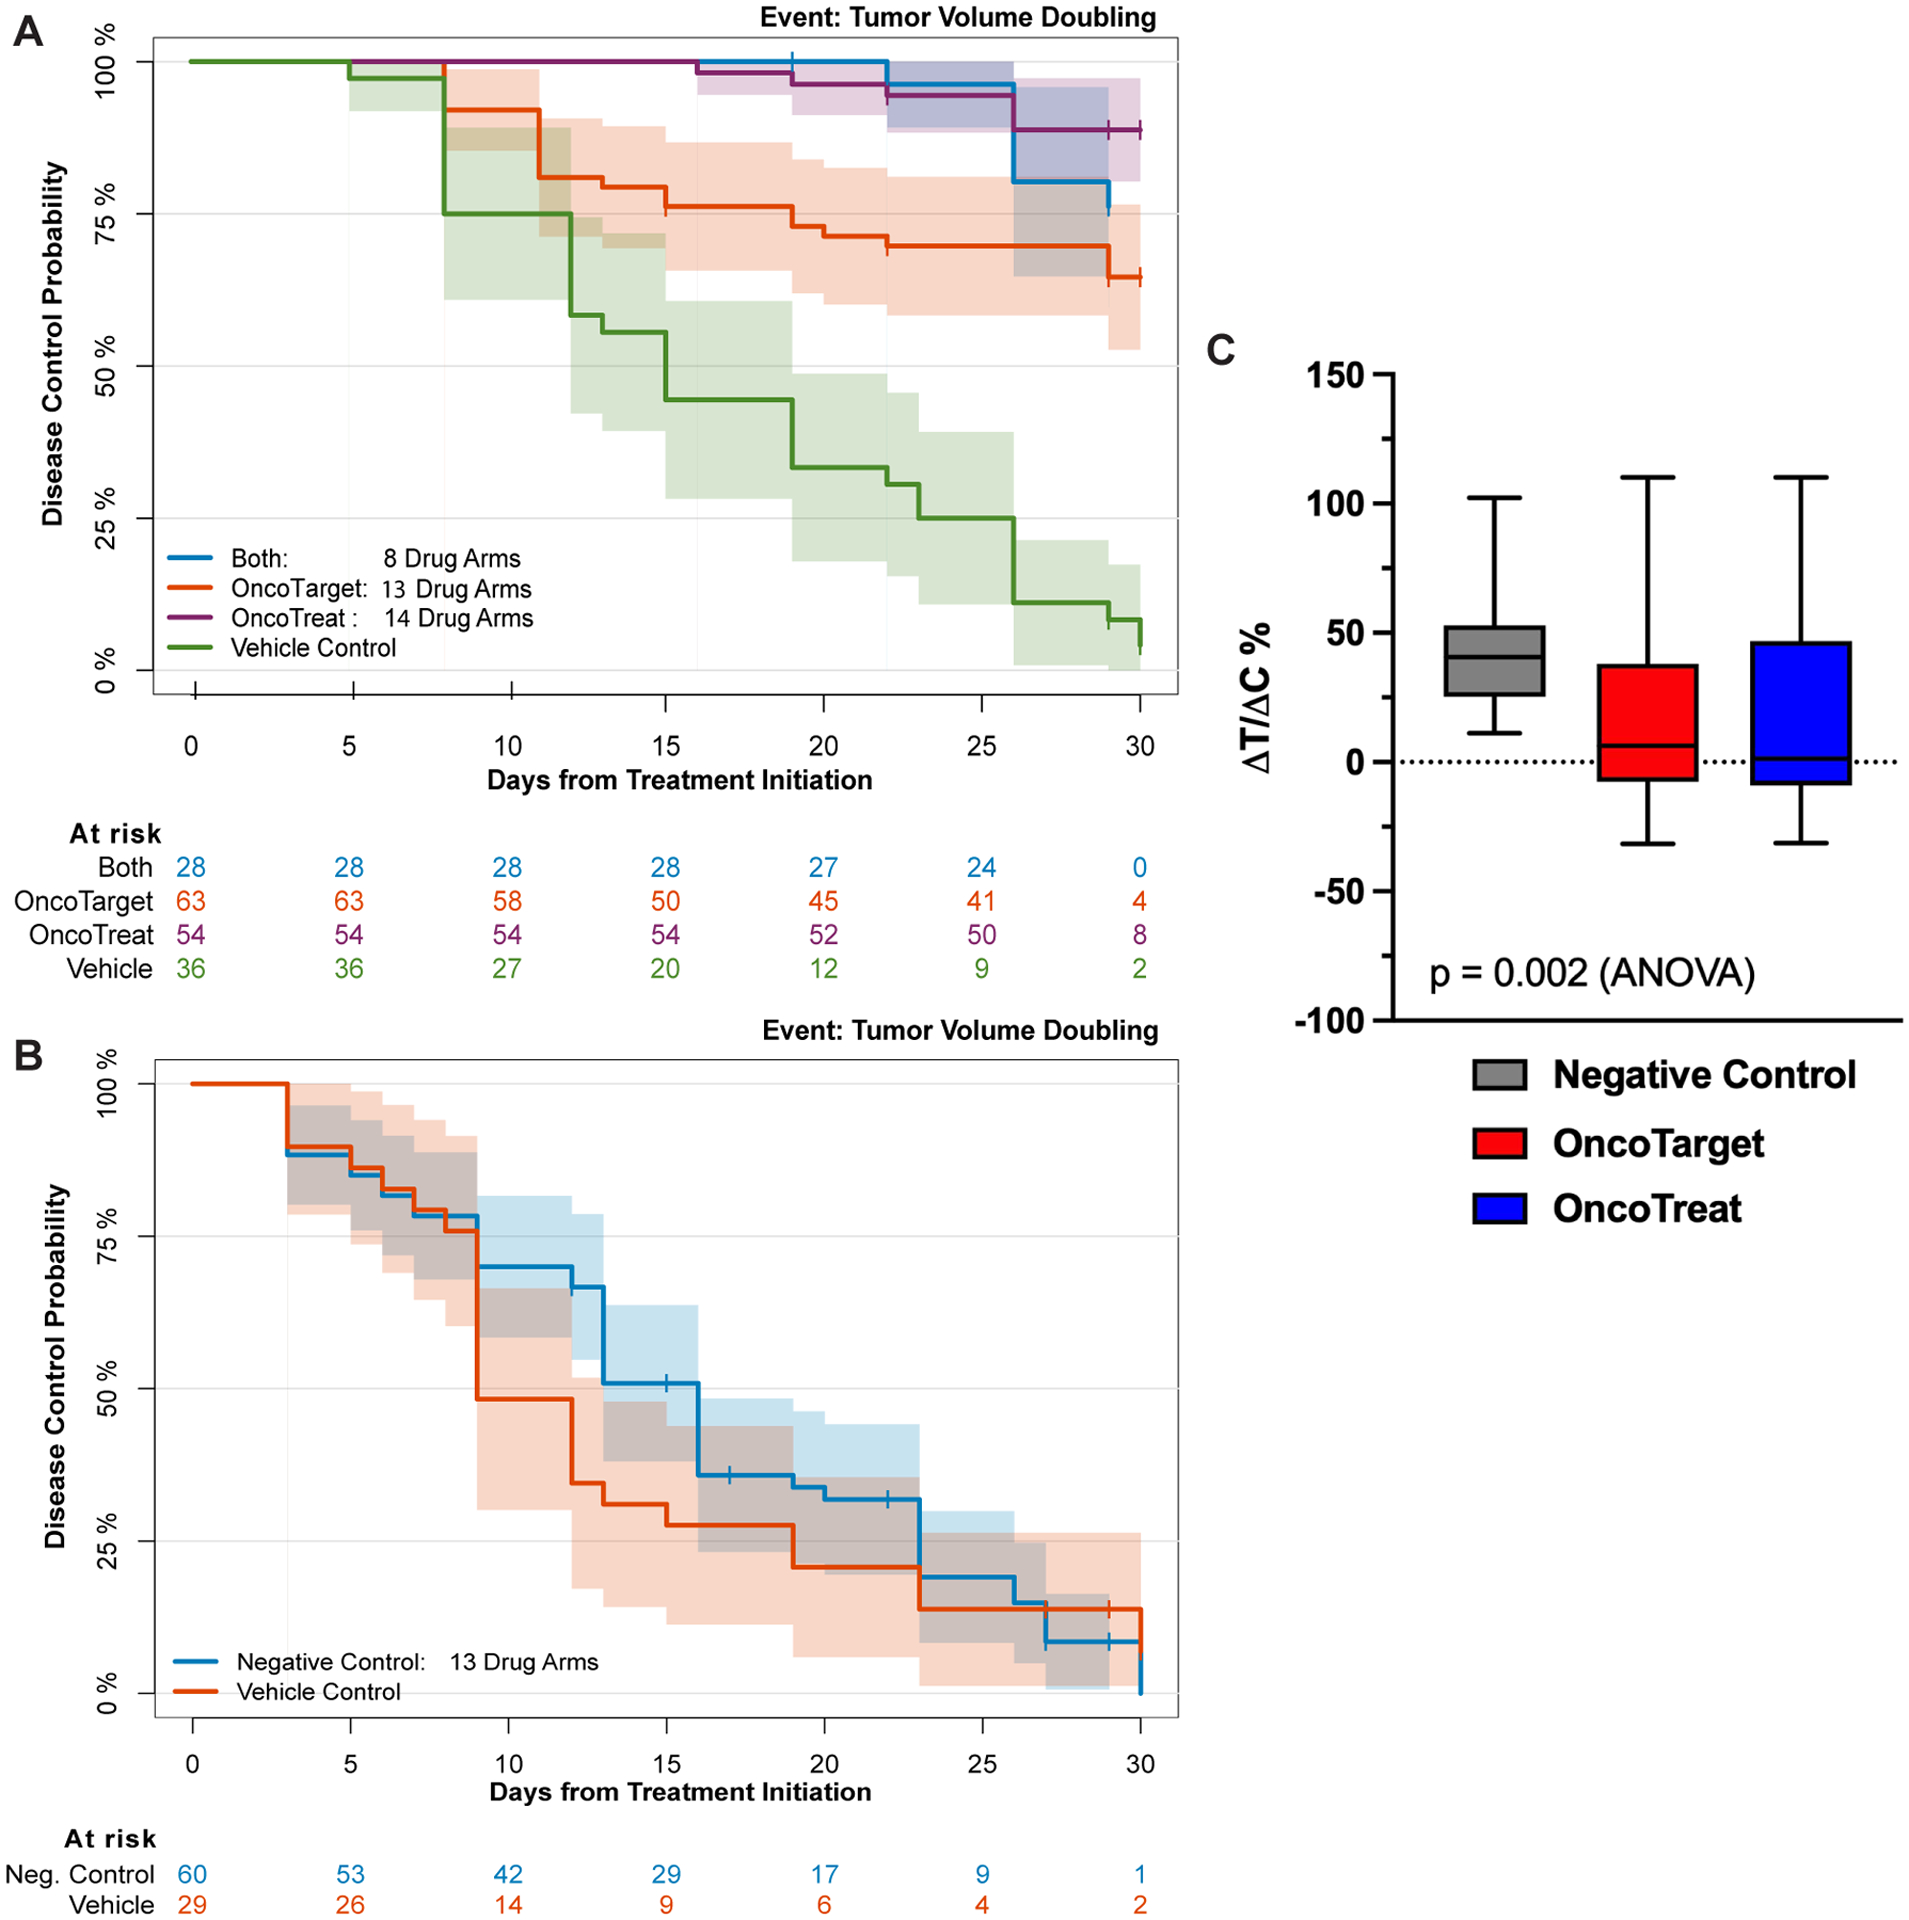
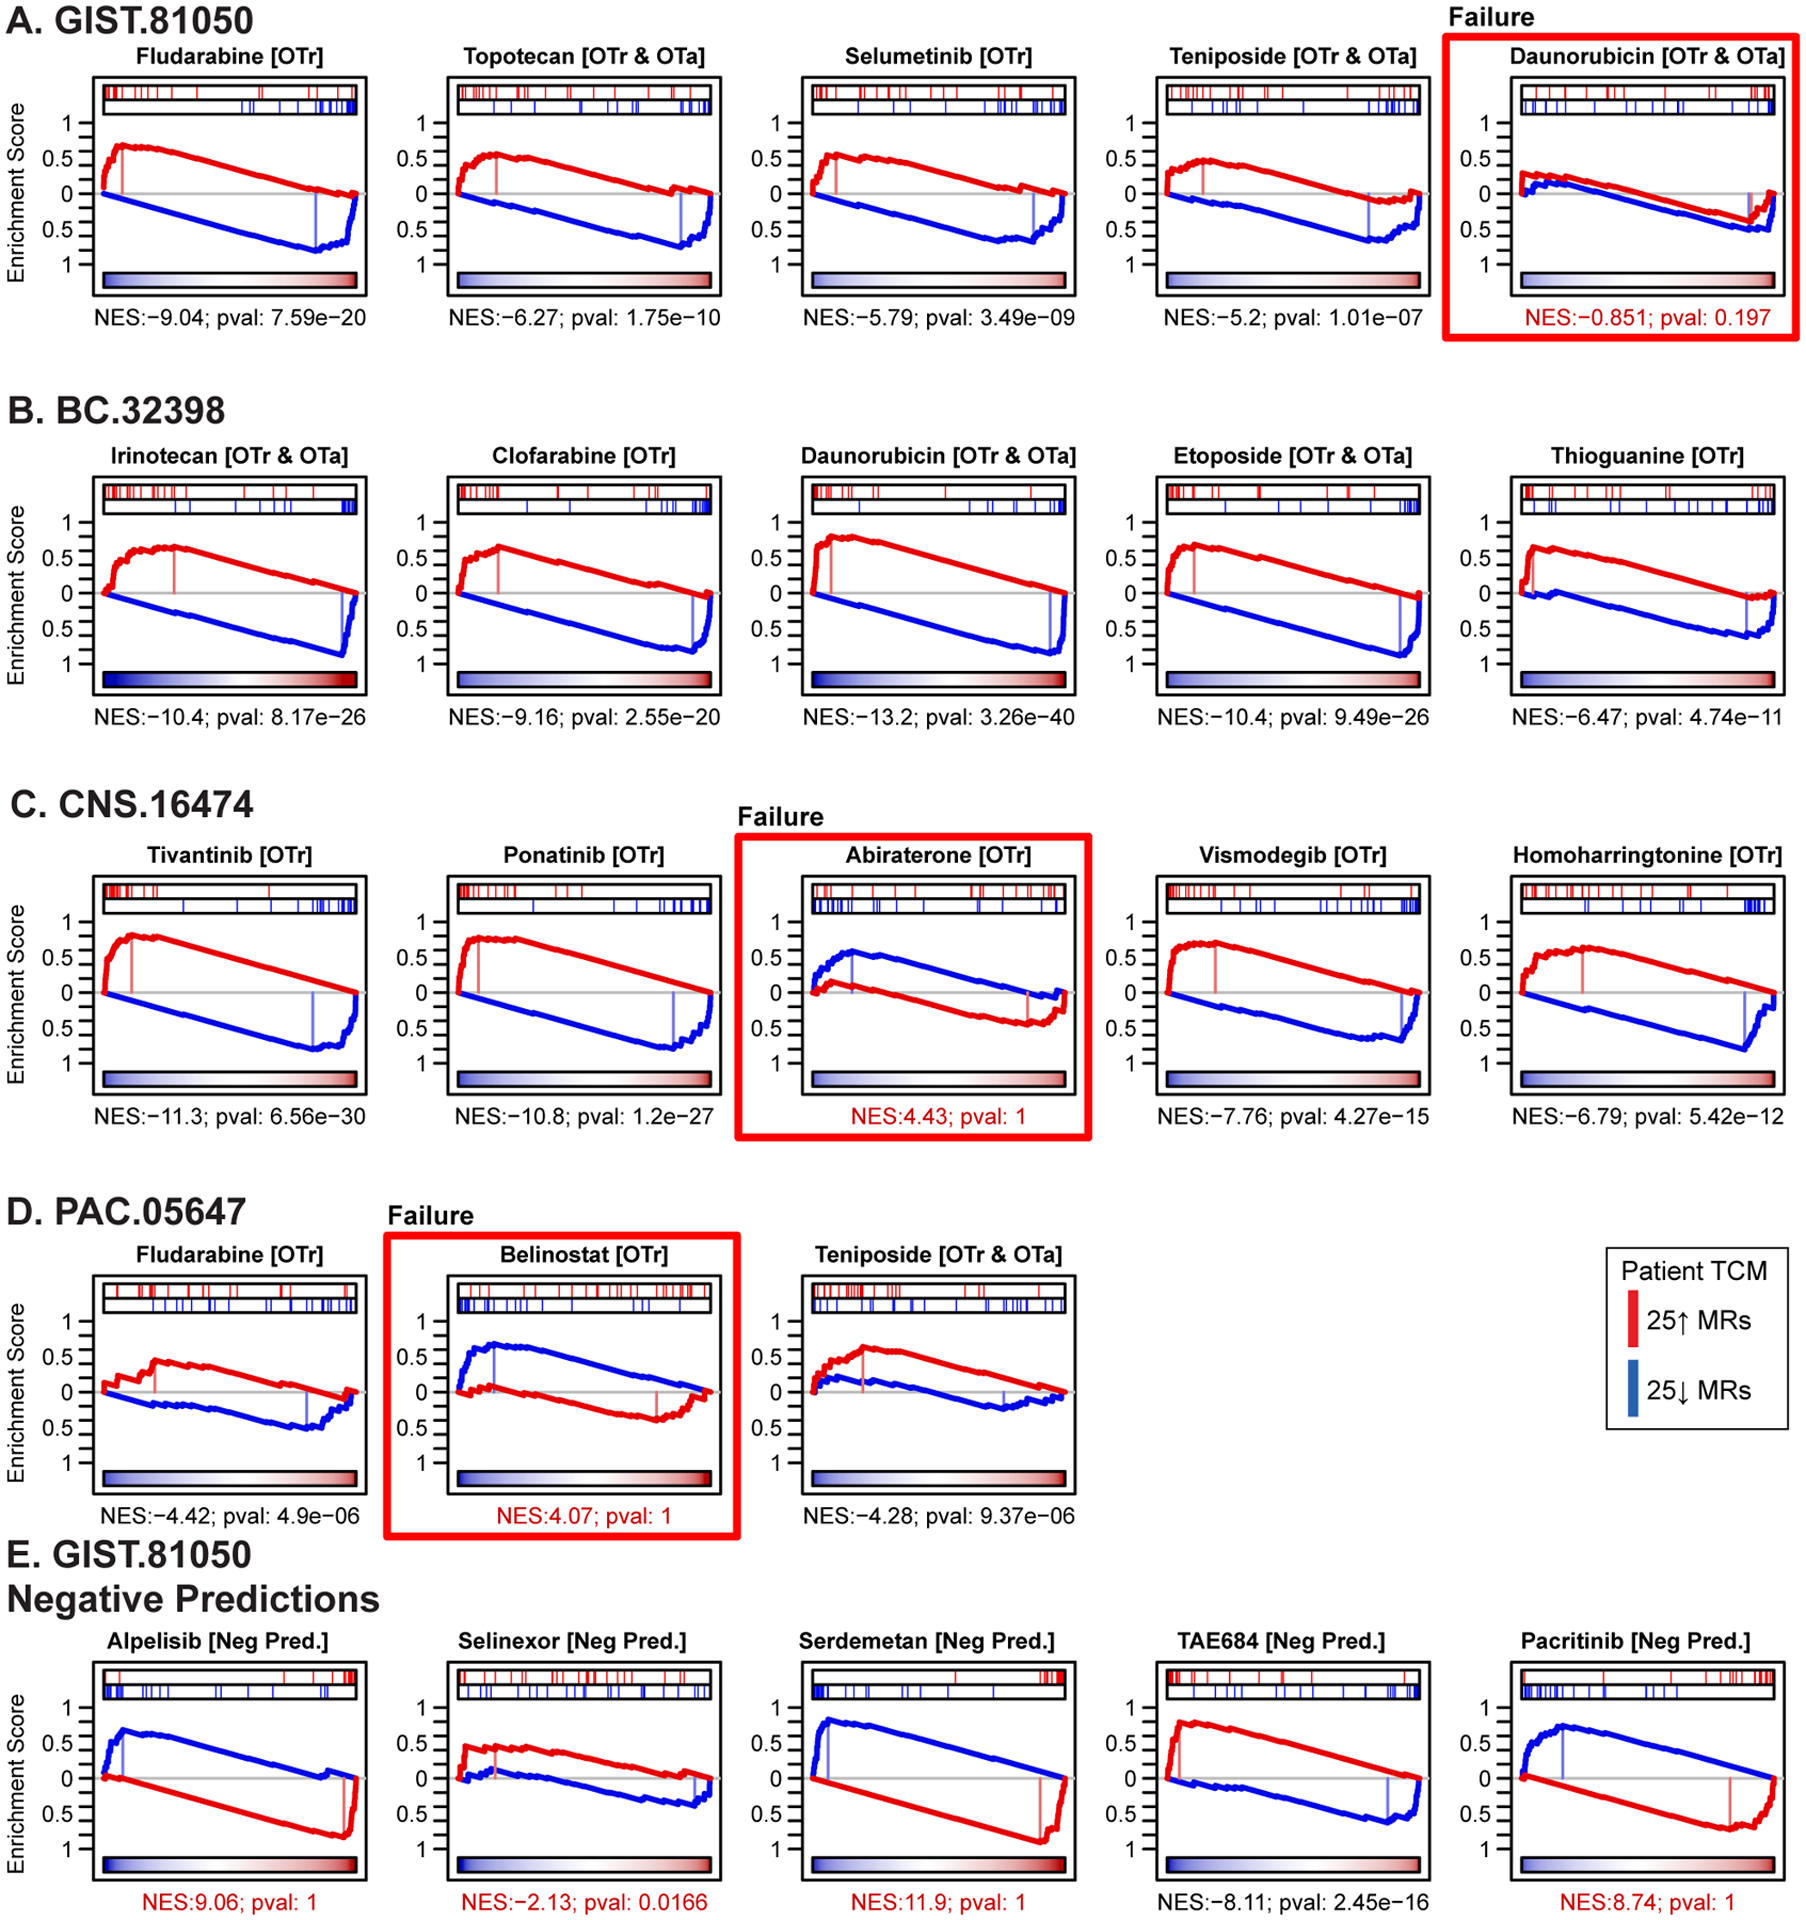
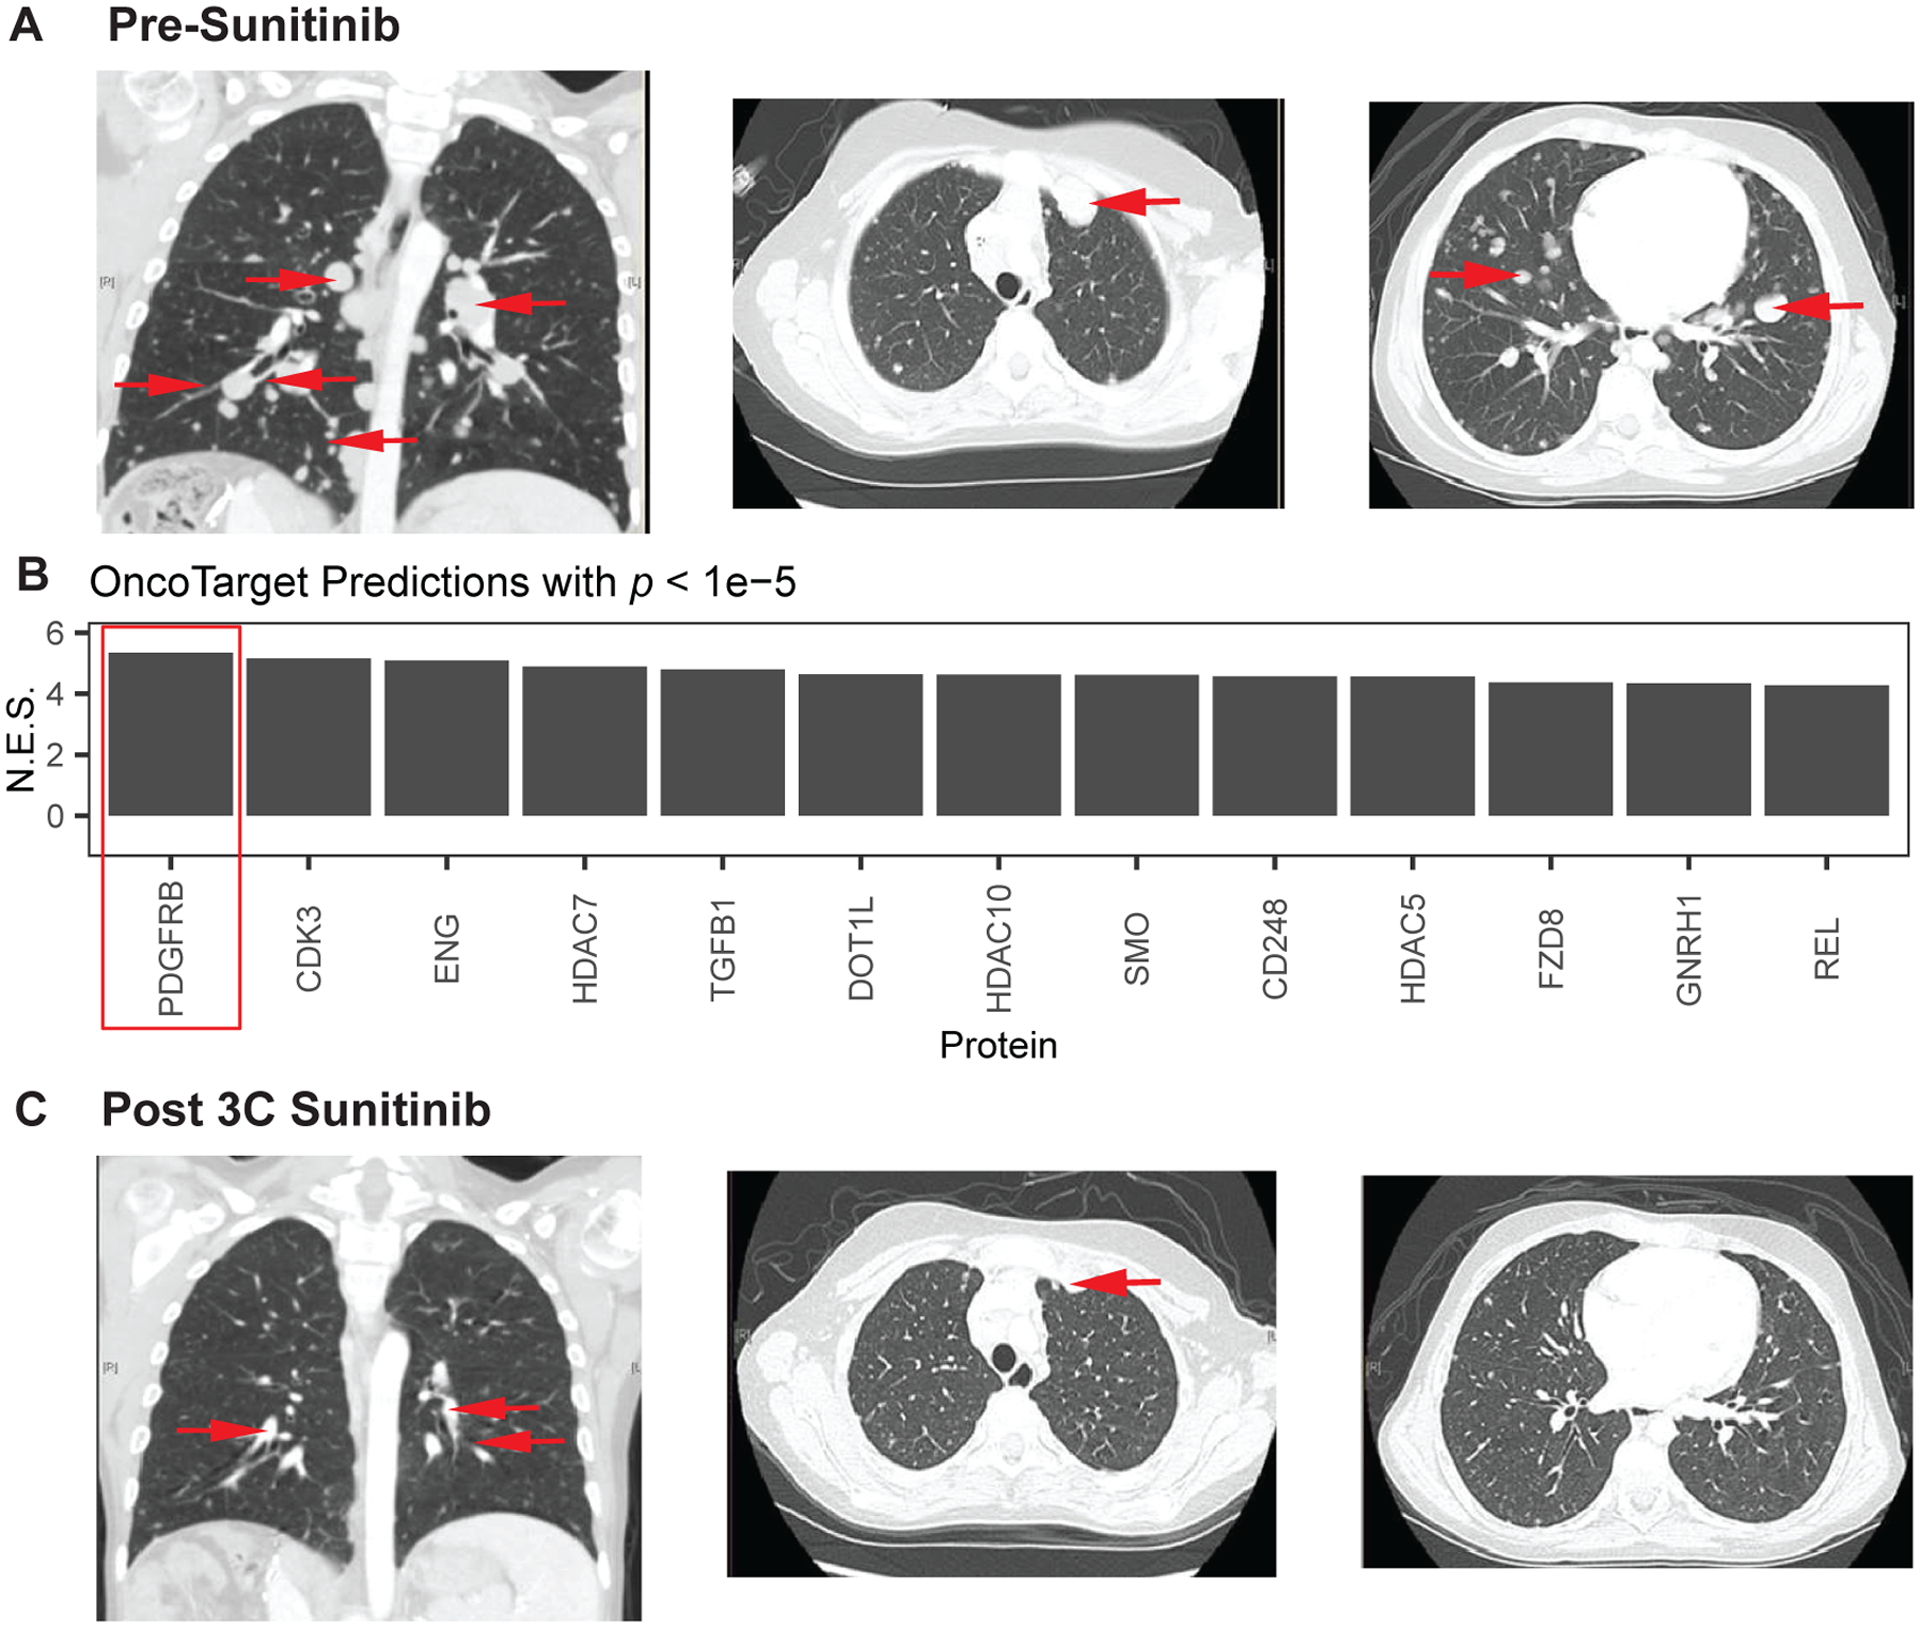
Predicting in vivo response to antineoplastics remains an elusive challenge. We performed a first-of-kind evaluation of two transcriptome-based precision cancer medicine methodologies to predict tumor sensitivity to a comprehensive repertoire of clinically relevant oncology drugs, whose mechanism of action we experimentally assessed in cognate cell lines. We enrolled patients with histologically distinct, poor-prognosis malignancies who had progressed on multiple therapies, and developed low-passage, patient-derived xenograft models that were used to validate 35 patient-specific drug predictions. Both OncoTarget, which identifies high-affinity inhibitors of individual master regulator (MR) proteins, and OncoTreat, which identifies drugs that invert the transcriptional activity of hyperconnected MR modules, produced highly significant 30-day disease control rates (68% and 91%, respectively). Moreover, of 18 OncoTreat-predicted drugs, 15 induced the predicted MR-module activity inversion in vivo. Predicted drugs significantly outperformed antineoplastic drugs selected as unpredicted controls, suggesting these methods may substantively complement existing precision cancer medicine approaches, as also illustrated by a case study.

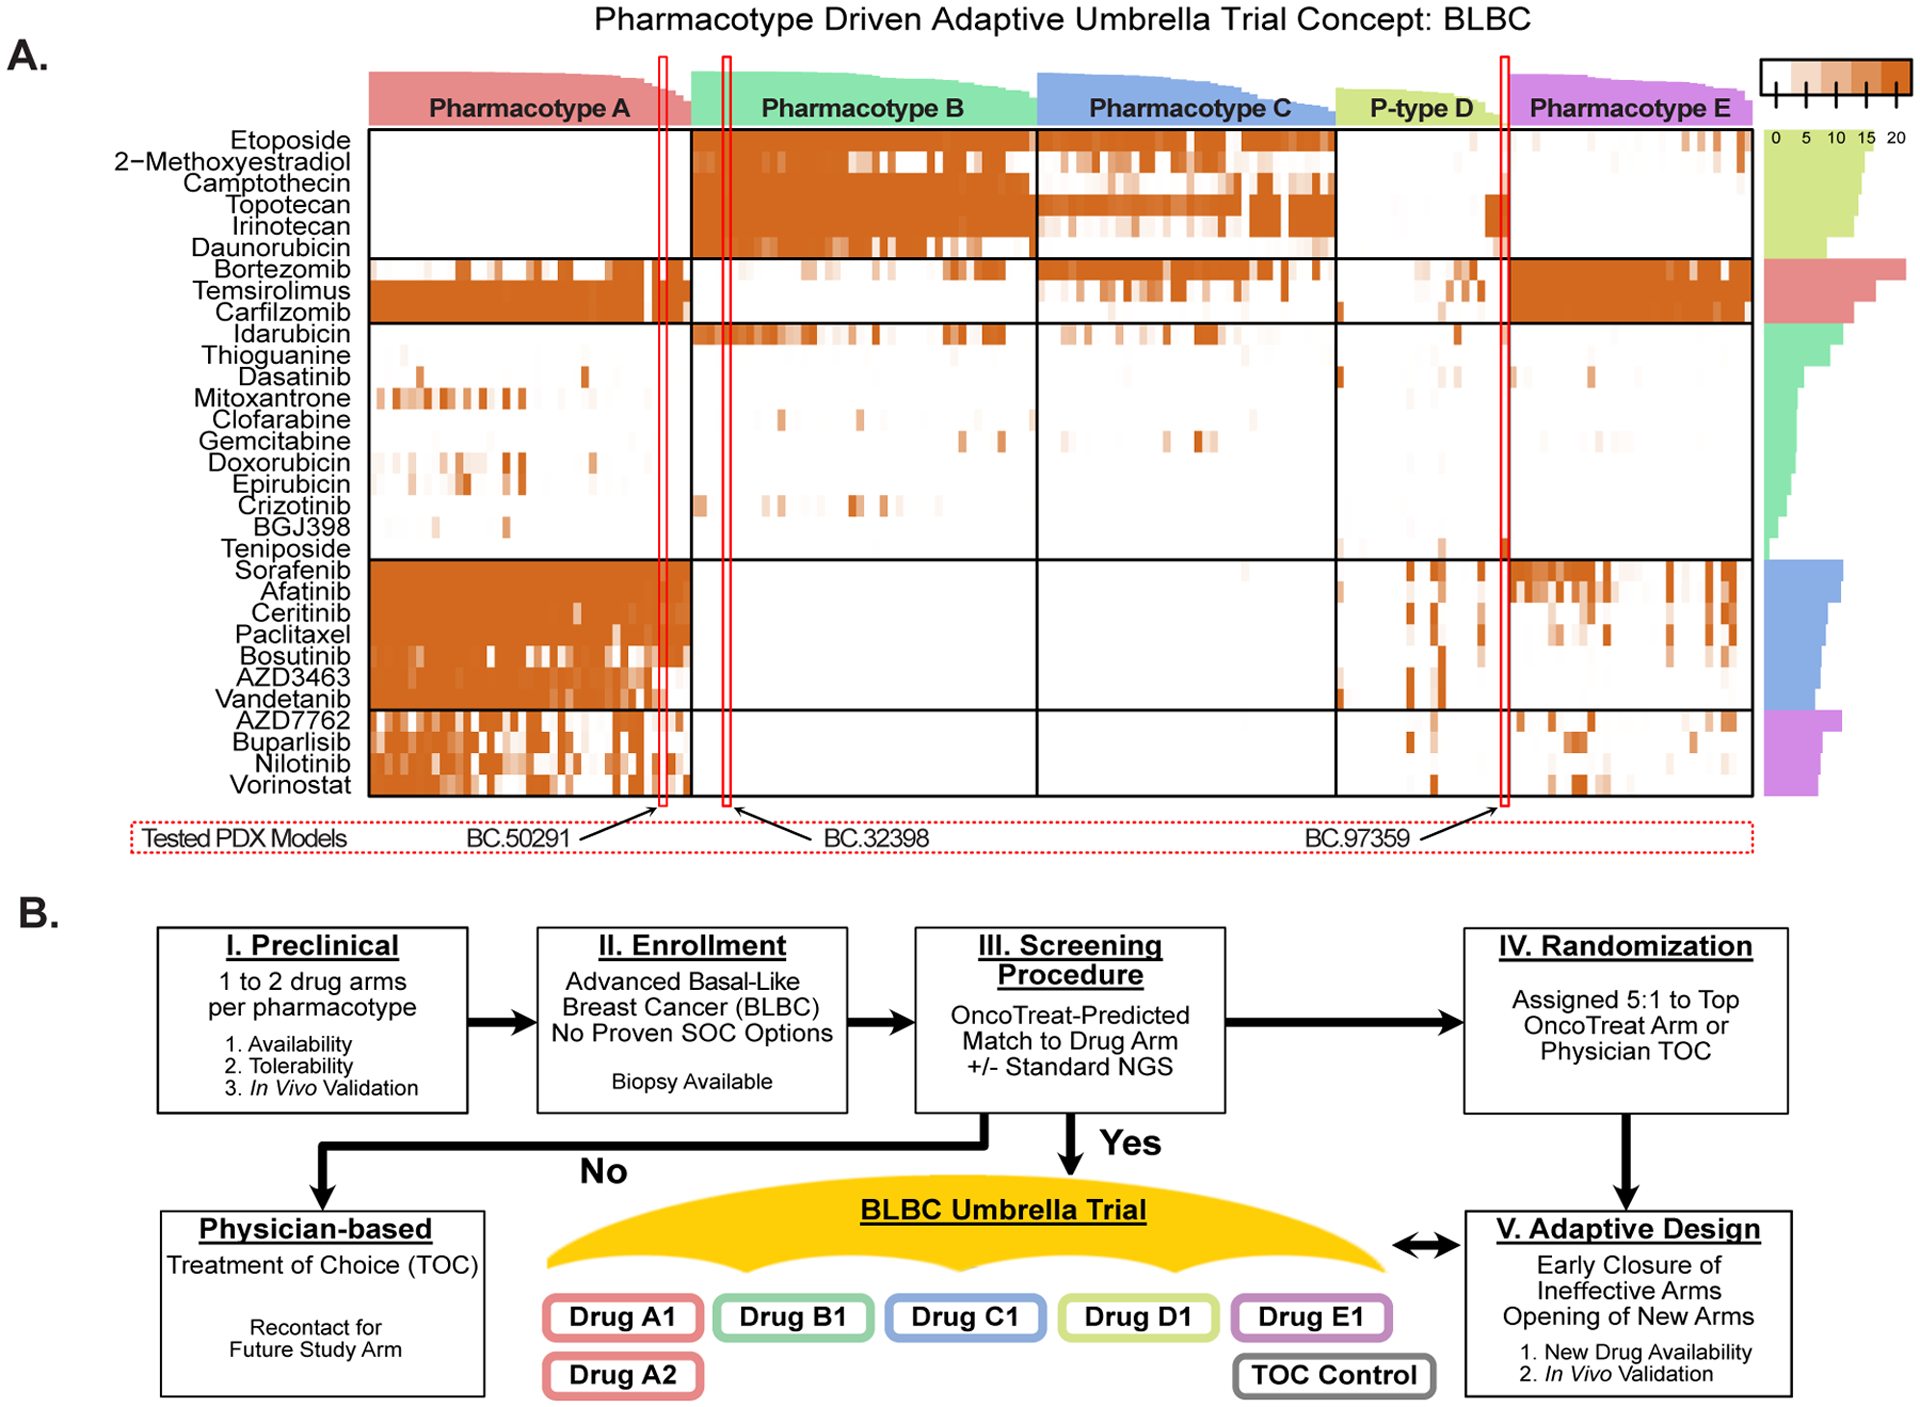
Significance: Complementary precision cancer medicine paradigms are needed to broaden the clinical benefit realized through genetic profiling and immunotherapy. In this first-in-class application, we introduce two transcriptome-based tumor-agnostic systems biology tools to predict drug response in vivo. OncoTarget and OncoTreat are scalable for the design of basket and umbrella clinical trials. This article is highlighted in the In This Issue feature, p. 1275.


Conflict of interest statement

Conflict of Interest Statement: Dr. Califano is founder, equity holder, and consultant of DarwinHealth Inc., a company that has licensed some of the algorithms used in this manuscript from Columbia University. Dr. Kung is a Medical and Scientific Advisor to DarwinHealth. Columbia University is also an equity holder in DarwinHealth Inc.

Figures

Figure 1.
Figure 1.
N of 1 study overview. (A) Clinical characteristics, prior systemic treatment, and tumor genomic profiling (if available) for the seven subjects. (B) Study conceptual diagram. I. Adults with advanced solid tumors with progression or intolerance to standard treatments are enrolled. Fresh biopsy tissue is partitioned for clinical pathology review, RNASeq, and xenografting into immunodeficient mice (PDX). Engrafted PDX tumors are also profiled by RNASeq and VIPER to confirm fidelity to the patient-derived tumor (OncoMatch, see Methods). II. High throughput drug screens have been completed in cognate cell lines with high fidelity to distinct cohorts of patient tumors based on recapitulation of Master Regulator (MR) protein activity (Bonferroni p < 10−10 by OncoMatch), collectively comprising the PanACEA database. Cells were perturbed at sub-lethal drug concentrations, and VIPER analysis of post-perturbation RNASeq allows for de novo mechanism inference for each drug in each cellular context. III. VIPER analysis of the patient tumor identifies top MR proteins and drugs are predicted by two methods. First, individual activated druggable MR proteins, e.g. protein kinases and epigenetic regulatory enzymes, are identified (Bonferroni p < 10−5 by OncoTarget). Second, using the best matched cell line(s) in PanACEA, drugs are ranked based on their inverting effect on the top MR proteins, i.e. tumor checkpoint module (TCM)-inverting drugs (Bonferroni p < 10−5 by OncoTreat). IV. Up to six predicted drugs are selected for experimental validation, based on OncoTarget or OncoTreat p-value and a number of practical selection criteria. Mice from early PDX passages (usually P1) are randomized into candidate drug arms, Negative control drug arms, and a Vehicle control arm.
Figure 2.
Figure 2.
Drug context-specific mechanism and tumor checkpoint module (TCM)-inversion. (A) As an illustrative example, we show a heatmap for the 24-hour drug perturbation in the BT20 breast cancer cell line. The heatmap shows the differential protein activity profile of 38 drugs in BT20 cells compared to vehicle control, annotated by their canonical mechanism and the two sublethal concentrations (EC20 and one-tenth of EC20) screened. VIPER monitored proteins are shown in the columns and we use unsupervised hierarchical clustering to highlight drugs that induce similar transcriptional response, i.e. context-specific observed mechanism of action. (B) Perturbation screens in five relevant cell lines were used to generate the OncoTreat drug predictions we report on here. OncoTreat uses the context-matched de novo drug mechanism information to identify top TCM-inverter drugs. For each patient Id (e.g., GIST-81050) and predicted drug (e.g., fludarabine), we show the placement of the 25 most activated (red bars) and 25 most inactivated (blue bars) patient tumor master regulator (MR) proteins on the drug-induced signature in the cognate cell line(s)—proteins sorted left to right from the most differentially inactivated to the most activated in drug- vs. vehicle control-treated cells. For each model and drug, we report the concentrations whose effect was averaged to rank protein activity, the normalized enrichment score (NES) assessing TCM-inversion in the drug signature, as measured by the aREA algorithm, and the associated p-value. Negative NES indicates TCM-inversion. All but two predictions met the predefined significance threshold (Bonferroni p < 10−5), with clofarabine and thioguanine borderline predictions for BC-32398. For the pancreatic tumor (PAC-05647), drug perturbation profiles in the ASPC1 cell line were not available in time to predict drugs for in vivo testing. Thus, predictions were based on OncoTreat analysis using non-matched cell line models, BT20, GIST430, GISTT1, and IOMM, and integrated using Fisher’s method.
Figure 3.
Figure 3.
Treatment response in patient-derived xenograft (PDX) models. (A) Fidelity assessment of the seven PDX models. Enrichment of patient tumor master regulators (TCM) in differentially active and inactive proteins in mature P0-passage PDX tumor samples, assessed by OncoMatch. TCM activity was highly conserved in six out of seven models, but not in the BC-50291 breast cancer model, indicating significant early passage drift. (B, C) Waterfall plots for end-of-study time point showing the relative tumor volume change for mice treated for a median of 29 days with OncoTarget-predicted drugs in seven PDX models (B), and OncoTreat-predicted drugs in six PDX models (C). Plots are grouped and color coded by model, with vehicle (solid bars) and drug-treated (textured bars) mice within each PDX presented side by side. OncoTreat predictions were not made for CAR-23659 due to lack of completion of a drug perturbation screen in a cognate colon cancer cell line. (D) Summary of response rates at the end-of-study for each drug prediction category (OncoTreat Only, OncoTarget Only) including a non-overlapping category for drugs predicted by both OncoTarget and OncoTreat (Both). A disease control rate (stable disease + partial response + complete response) of 68% (n = 41/60) and objective response rate (partial + complete response) of 12% (n = 7/60) were observed when treating with OncoTarget-predicted drugs. Responses from OncoTarget [or both]-predicted drugs were primarily stable disease (n = 48) and partial response (n = 12). A disease control rate of 91% (n = 48/53) and objective response rate of 17% (n = 9/53) were observed when treating with OncoTreat-predicted drugs. OncoTreat [or both]-predicted drugs demonstrated stable disease (n = 55) and partial response (n = 14). Overall p-value (Fisher’s exact) is reported for DCR and ORR, assessing for a between groups difference in response rates across all drug prediction groups. (E) Summary statistics of overall and pairwise comparisons of drug prediction groups. Both OncoTarget and OncoTreat were highly accurate in predicting disease control (p < 10−3, 2-tailed U-test) and objective response (OncoTarget p = 0.03; OncoTreat p = 0.01) versus Vehicle control. Note, valid direct comparisons of OncoTarget and OncoTreat are limited by imbalances in number of predictions tested in different models.
Figure 4.
Figure 4.
Kaplan-Meier and ΔT/ΔC% Analysis. (A) Kaplan-Meier plot for Disease Control showing significant differences for the arms treated with either OncoTarget-, OncoTreat-, or Both-predicted drugs compared to Vehicle control (p < 10−4, log-rank test). (B) Kaplan-Meier plot for Disease Control showing no difference between the Negative control drugs (not predicted by either OncoTarget or OncoTreat) and matched-Vehicle control (p = 0.38). (C) Boxplots showing the distribution of the treatment-to-control ratio (ΔT/ΔC%: relative change in volumes from baseline in the treatment/control) seen in animals treated with Negative controls, OncoTarget, and OncoTreat-predicted drugs, normalized to matched-Vehicle control. There is a statistically significant difference in mean ΔT/ΔC% in OncoTarget (p = 0.004, Mann-Whitney) and OncoTreat (p = 0.01) treated mice versus Negative controls (overall, p = 0.002, 2-tail ANOVA).
Figure 5.
Figure 5.
Pharmacodynamic assessment of tumor checkpoint module (TCM)-inversion in vivo, in early on-treatment biopsy samples. In the four PDX models where we tested three or more OncoTreat predicted drugs, two mice from each drug arm were sacrificed after the 3rd dose. VIPER was used to generate a differential protein activity signature for each drug-treated versus Vehicle control-treated arm in the respective PDX model. Enrichment of activated and inactivated patient tumor master regulators in this signature was assessed by aREA. (A – D) Statistically significant TCM-inversion in vivo (Bonferroni p < 10−5), which recapitulated the predictions from cognate cell lines in vitro, was confirmed for 15 of the 18 OncoTreat-predicted drugs for which PD samples were available. Exceptions denoted by red boxes included daunorubicin in GIST-81050, which however achieved disease control, abiraterone in CNS-16474, which induced only modest tumor growth inhibition, and belinostat, an epigenetic modulator, in PAC.05674, which achieved disease control. (E) As expected, four of five Negative control drugs tested in GIST-81050, did not significantly invert TCM activity. TAE684, however, did induce significant TCM-inversion at this early time point. All five drugs failed to induce disease control in this model.
Figure 6.
Figure 6.
Response to sunitinib in a pediatric patient with Calcifying Nested Stromal Epithelial Tumor (CNSET) with aberrant activation of PDGFR-B, as assessed by OncoTarget analysis. (A) Chest computed tomography (CT) scan pre-sunitinib treatment: coronal section (left) and axial sections (middle and right) demonstrate numerous pulmonary metastases (red arrows) ranging from less than 1 to close to 3 cm in size. Several of the tumors were new or growing on serial scans during the preceding six months. (B) OncoTarget predictions on patient tumor. Multiple proteins were noted to be significantly activated (Bonferroni p < 10−5), but PDGFR-B activation was both the top prediction and also judged to be most actionable by the clinical team. (C) Chest CT following three cycles of sunitinib (six weeks each). Corresponding sections demonstrate that several of the tumors had decreased in size (red arrows) or were no longer radiologically evident.
Figure 7.
Figure 7.
Pharmacotype-based umbrella trial concept. (A) Heatmap showing top OncoTreat predictions (-log10(p)) for 173 basal-like breast cancer (BLBC) samples from The Cancer Genome Atlas (TCGA), as well as for the three BLBC samples from patients enrolled in the study (BC-50291, BC-32398, and BC-97359). Following unsupervised partition-around-medoids-clustering, drug predictions cluster into five main pharmacotypes, with the three N of 1 cases clustering with samples in pharmacotype A, B, and D, respectively. Bars on the top and to the right of the heatmap indicate the cluster reliability score (13) for each tumor sample and drug, respectively. Importantly, at least a few predictions are generated for the majority of tumors, using existing drug perturbation data in PanACEA from one or a few high-fidelity cognate cell lines. (B) Schema for a pharmacotype-based umbrella trial concept in BLBC. One or more drugs per pharmacotype may be prioritized as hypotheses for an umbrella clinical trial, based on availability, tolerability, and preclinical validation in relevant TCM-activity-matched PDX models (I). Patients with advanced BLBC who have exhausted all proven effective treatment options would be enrolled and undergo biopsy (II). An initial screening phase would determine if OncoTreat predicts a match to any of the open drug arms (III). Patients with a statistically significant match to a specific pharmacotype would be randomized 5:1 to OncoTreat-predicted drug versus physician treatment of choice (IV). Using an adaptive design, arms that fail to demonstrate efficacy would be closed early and new arms would be opened, as drugs become available (V).

References

    1. Le Tourneau C, Delord JP, Goncalves A, Gavoille C, Dubot C, Isambert N, et al. Molecularly targeted therapy based on tumour molecular profiling versus conventional therapy for advanced cancer (SHIVA): a multicentre, open-label, proof-of-concept, randomised, controlled phase 2 trial. Lancet Oncol. 2015;16(13):1324–34. - PubMed
    1. Tannock IF, Hickman JA. Limits to Personalized Cancer Medicine. N Engl J Med. 2016;375(13):1289–94. - PubMed
    1. Weinstein IB. Cancer. Addiction to oncogenes--the Achilles heal of cancer. Science. 2002;297(5578):63–4. - PubMed
    1. Tang J, Pearce L, O’Donnell-Tormey J, Hubbard-Lucey VM. Trends in the global immuno-oncology landscape. Nat Rev Drug Discov. 2018;17(11):783–4. - PubMed
    1. Zhong L, Li Y, Xiong L, Wang W, Wu M, Yuan T, et al. Small molecules in targeted cancer therapy: advances, challenges, and future perspectives. Signal Transduct Target Ther. 2021;6(1):201. - PMC - PubMed

Publication types

Substances