. 2023 Aug;72(8):2623-2633.
doi: 10.1007/s00262-023-03437-z. Epub 2023 Apr 16.

Switchable CAR T cell strategy against osteosarcoma

Affiliations

Switchable CAR T cell strategy against osteosarcoma

Laura Hidalgo et al. Cancer Immunol Immunother. 2023 Aug.

Abstract

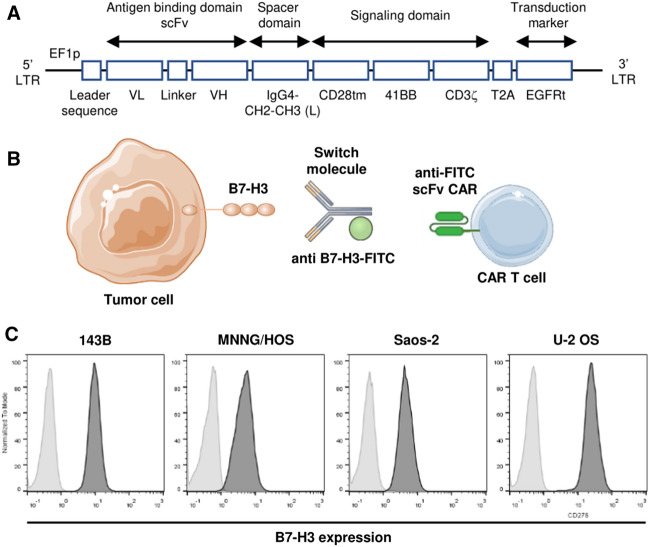
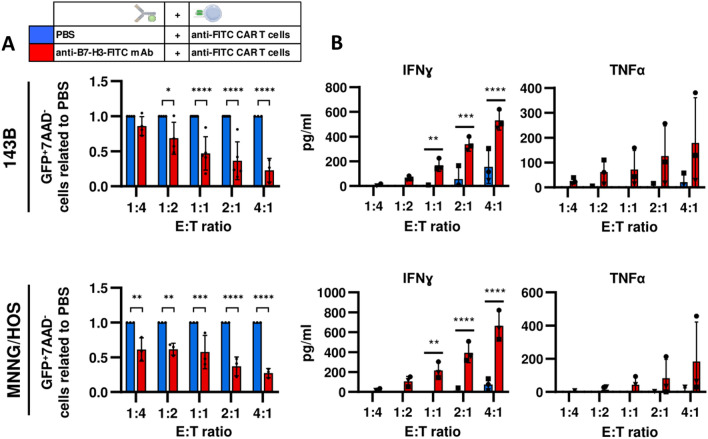
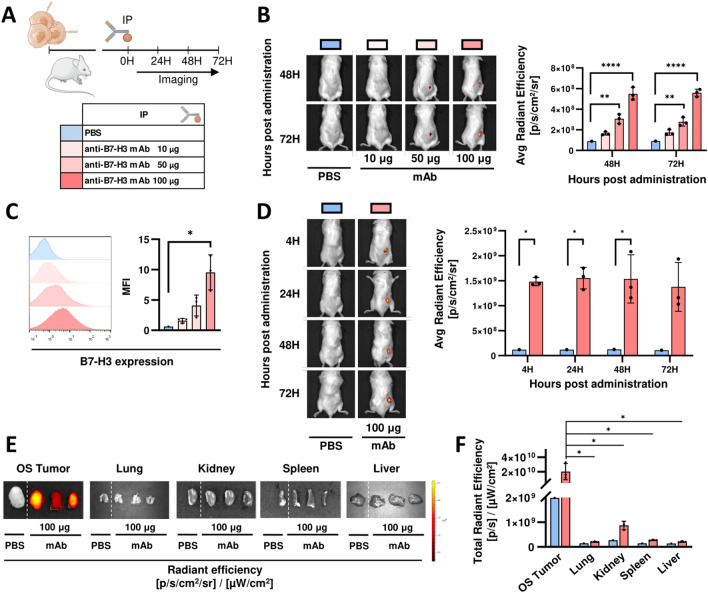
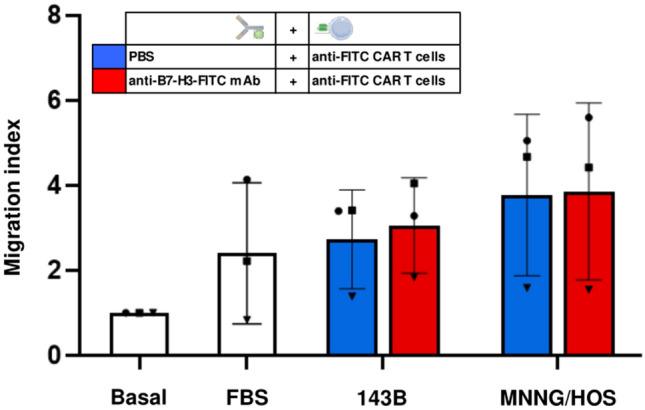
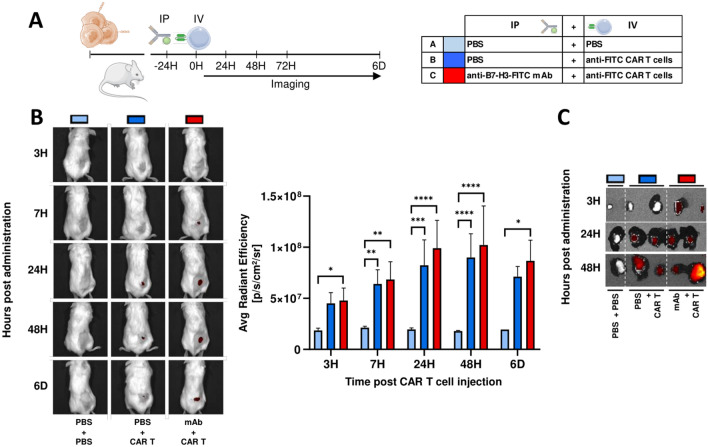
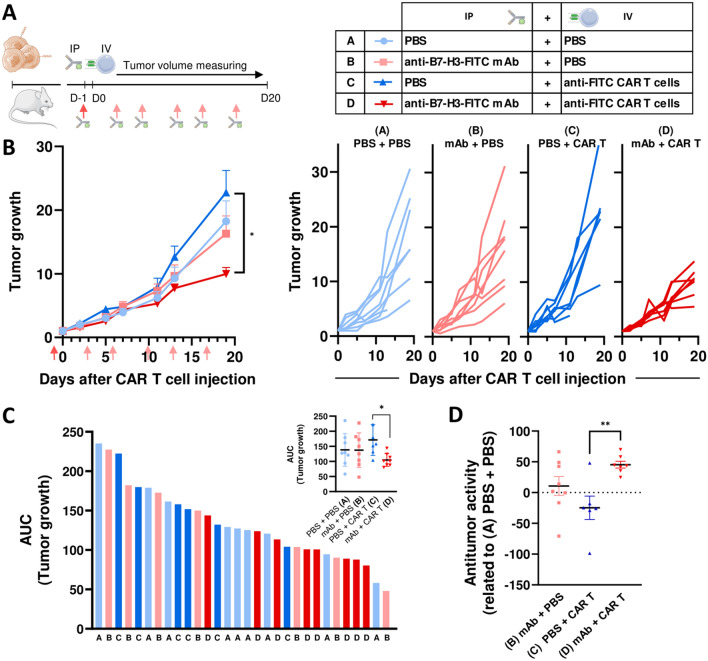
Immunotherapy with chimeric antigen receptor T (CAR T) cells has changed the treatment of hematological malignances, but they are still a challenge for solid tumors, including pediatric sarcomas. Here, we report a switchable CAR T cell strategy based on anti-FITC CAR T cells and a switch molecule conjugated with FITC for targeting osteosarcoma (OS) tumors. As a potential target, we analyzed the expression of B7-H3, an immune checkpoint inhibitor, in OS cell lines. In addition, we evaluate the capacity of an anti-B7-H3 monoclonal antibody conjugated with FITC (anti-B7-H3-FITC mAb) to control the antitumor activity of anti-FITC CAR T cells. The effector functions of anti-FITC CAR T cells against OS, measured in vitro by tumor cell killing activity and cytokine production, are dependent on the presence of the anti-B7-H3-FITC mAb switch. Moreover, OS cells stimulate anti-FITC CAR T cells migration. In vivo, anti-B7-H3 mAb penetrates in the tumor and binds 143B OS tumor cells. Furthermore, anti-FITC CAR T cells reach tumor region and exert antitumor effect in an OS NSG mouse model only in the presence of the switch molecule. We demonstrate that anti-B7-H3-FITC mAb redirects the cytotoxic activity of anti-FITC CAR T cells against OS tumors suggesting that switchable CAR T cell platforms might be a plausible strategy against OS.

Keywords: B7-H3; CAR T; Immunotherapy; Osteosarcoma.


Conflict of interest statement

The authors declare that no competing interests exist.

Figures

Fig. 1
Fig. 1
B7-H3 expression on human OS cell lines. A Diagram that shows the second-generation fully human anti-FITC CAR construct domains. B Schematic representation of our model using a switchable CAR T cell strategy based on an anti-B7-H3 mAb conjugated with FITC and anti-FITC CAR T cells. C B7-H3 expression is determined on different OS human cell lines by flow cytometry. Soft gray: negative control, dark gray: anti-B7-H3 stained
Fig. 2
Fig. 2
Antitumor activity of anti-FITC CAR T cells. GFP-expressing tumor cells stained (anti-B7-H3-FITC mAb, red) or not (PBS, blue) are cocultured with resting anti-FITC CAR T cells at different effector: target (E:T) ratios for 48 h. A Living tumor cells (CD45GFP+7AAD) are determined by flow cytometry. The normalization of anti-B7-H3-FITC mAb to PBS is shown. B IFNɣ and TFNα levels are tested by ELISA in the cocultured supernatants. All data are represented as mean ± SD of independent experiments with CAR T cells from at least 3 different donors. *, P < 0.05; **, P < 0.01; ***, P < 0.001; ****, P < 0.0001 by two-way ANOVA with Sidak post hoc test
Fig. 3
Fig. 3
anti-B7-H3 mAb biodistribution in a NSG mice model. A Schematic representation of experimental design. PBS or different doses of anti-B7-H3 mAb (clone 8H9) labeled with Alexa Fluor 647 is administrated by intraperitoneal injection (IP) to NSG mice-bearing 143B tumors. B and D Tumors are imaged at different time points using IVIS imaging system. Representative IVIS image and mean ± SD of average radiant efficiency are shown. *, P < 0.05; **, P < 0.01; ***, P < 0.001 by two-way ANOVA with Tukey (B) and Sidak (D) post hoc test. C B7-H3 expression on ex vivo tumor cells is evaluated by flow cytometry at 72 h. Solid histograms (left) represent the expression of B7-H3 on 143B cells. One representative profile per group is shown. Graph (right) shows the mean fluorescence intensities (MFI) mean ± SD of at least 3 mice. **, P < 0.01; by one-way ANOVA with Tukey post hoc test. E Ex vivo imaging of OS tumors and the organs indicated after 72 h of PBS or anti-B7-H3 Alexa Fluor 647 administration. F Quantification of total radiant efficiency of ex vivo imaging (mean ± SD) *, P < 0.05 by two-way ANOVA with Sidak post hoc test
Fig. 4
Fig. 4
CAR T cell migration in vitro to osteosarcoma cell lines. Chemotaxis assay is performed adding starving CAR T cells in transwell chambers over osteosarcoma cell lines preincubated (red) or not (blue) with anti-B7-H3-FITC mAb. Basal and positive control (FBS) are included. After 4 h, CAR T cells migrated are collected and counted by flow cytometry. Migration index mean ± SD of independent experiments from three different donor is shown
Fig. 5
Fig. 5
CAR T migration in vivo to 143B tumors. A Schematic representation of experimental design. PBS (blue) or 100 μg of anti-B7-H3-FITC mAb (red) is administrated by intraperitoneal injection (IP) (-24H) to 143B tumor-bearing NSG mice. Next day (0H), PBS (light blue = A) or 1 × 10⁶ DiR-labeled CAR T cells (dark blue = B, dark red = C) are intravenously injected (IV). B DiR-labeled CAR T cells homing is determinate by IVIS imaging system at indicated time points. Representative images are shown. Average radiant efficiency on tumor region is analyzed, and the mean ± SD of at least three mice is represented. *, P < 0.05; **, P < 0.01; ***, P < 0.001; ****, P < 0.0001 by two-way ANOVA with Tukey post hoc test. C Ex vivo imaging by IVIS of DiR-labeled CAR T cells on tumors collected at different time points
Fig. 6
Fig. 6
In vivo efficacy of CAR T cell treatment in OS tumors. A Schematic illustration of in vivo experimental design. PBS (blue) or 100 μg mAb anti-B7-H3-FITC mAb (red) is administrated by intraperitoneal injection (IP) (D-1) to NSG mice-bearing 143B tumors. Next day (D0), intravenous injection of PBS (light blue = A, light red = B) or 5 × 10⁶ CAR T cells (dark blue = C, dark red = D) is performed (IV). PBS or anti-B7-H3-FITC mAb (50 μg; red arrows) is administrated every 3–4 days. Legend on the right indicates the different conditions. B Follow-up of tumor growth in mice treated with different conditions represented as mean + SEM (left) and individual values (right). *, P < 0.05 by one-way ANOVA with Tukey post hoc test. C Graphs on the left represent the individual areas under the curve (AUC) calculated from tumor growth of mice treated with different conditions. Little graph on the right upper corner represents the AUC expressed as mean + SD. *, P < 0.05 by one-way ANOVA with Tukey post hoc test. D Graph shows antitumor activity mean + SD of different condition related to PBS + PBS (A) group. **, P < 0.01 by one-way ANOVA with Tukey post hoc test

Similar articles

Cited by

References

    1. Mirabello L, Troisi RJ, Savage SA. Osteosarcoma incidence and survival rates from 1973 to 2004: data from the surveillance, epidemiology, and end results program. Cancer. 2009;115:1531–1543. doi: 10.1002/cncr.24121. - DOI - PMC - PubMed
    1. Ottaviani G, Robert RS, Huh WW, Jaffe N. Functional, psychosocial and professional outcomes in long-term survivors of lower-extremity osteosarcomas: amputation versus limb salvage. Cancer Treat Res. 2009;152:421–436. doi: 10.1007/978-1-4419-0284-9_23. - DOI - PubMed
    1. Taran SJ, Taran R, Malipatil NB. Pediatric Osteosarcoma: an updated review. Indian J Med Paediatr Oncol. 2017;38:33–43. doi: 10.4103/0971-5851.203513. - DOI - PMC - PubMed
    1. Walker AJ, et al. Tumor antigen and receptor densities regulate efficacy of a chimeric antigen receptor targeting anaplastic lymphoma kinase. Mol Ther. 2017;25:2189–2201. doi: 10.1016/j.ymthe.2017.06.008. - DOI - PMC - PubMed
    1. Majzner RG, Mackall CL. Tumor antigen escape from CAR T-cell therapy. Cancer Discov. 2018;8:1219–1226. doi: 10.1158/2159-8290.CD-18-0442. - DOI - PubMed