. 2023 Jul:107:110681.
doi: 10.1016/j.cellsig.2023.110681. Epub 2023 Apr 14.

Reduction of TRPC1/TRPC3 mediated Ca2+-signaling protects oxidative stress-induced COPD

Affiliations

Reduction of TRPC1/TRPC3 mediated Ca2+-signaling protects oxidative stress-induced COPD

Samuel Shin et al. Cell Signal. 2023 Jul.

Abstract

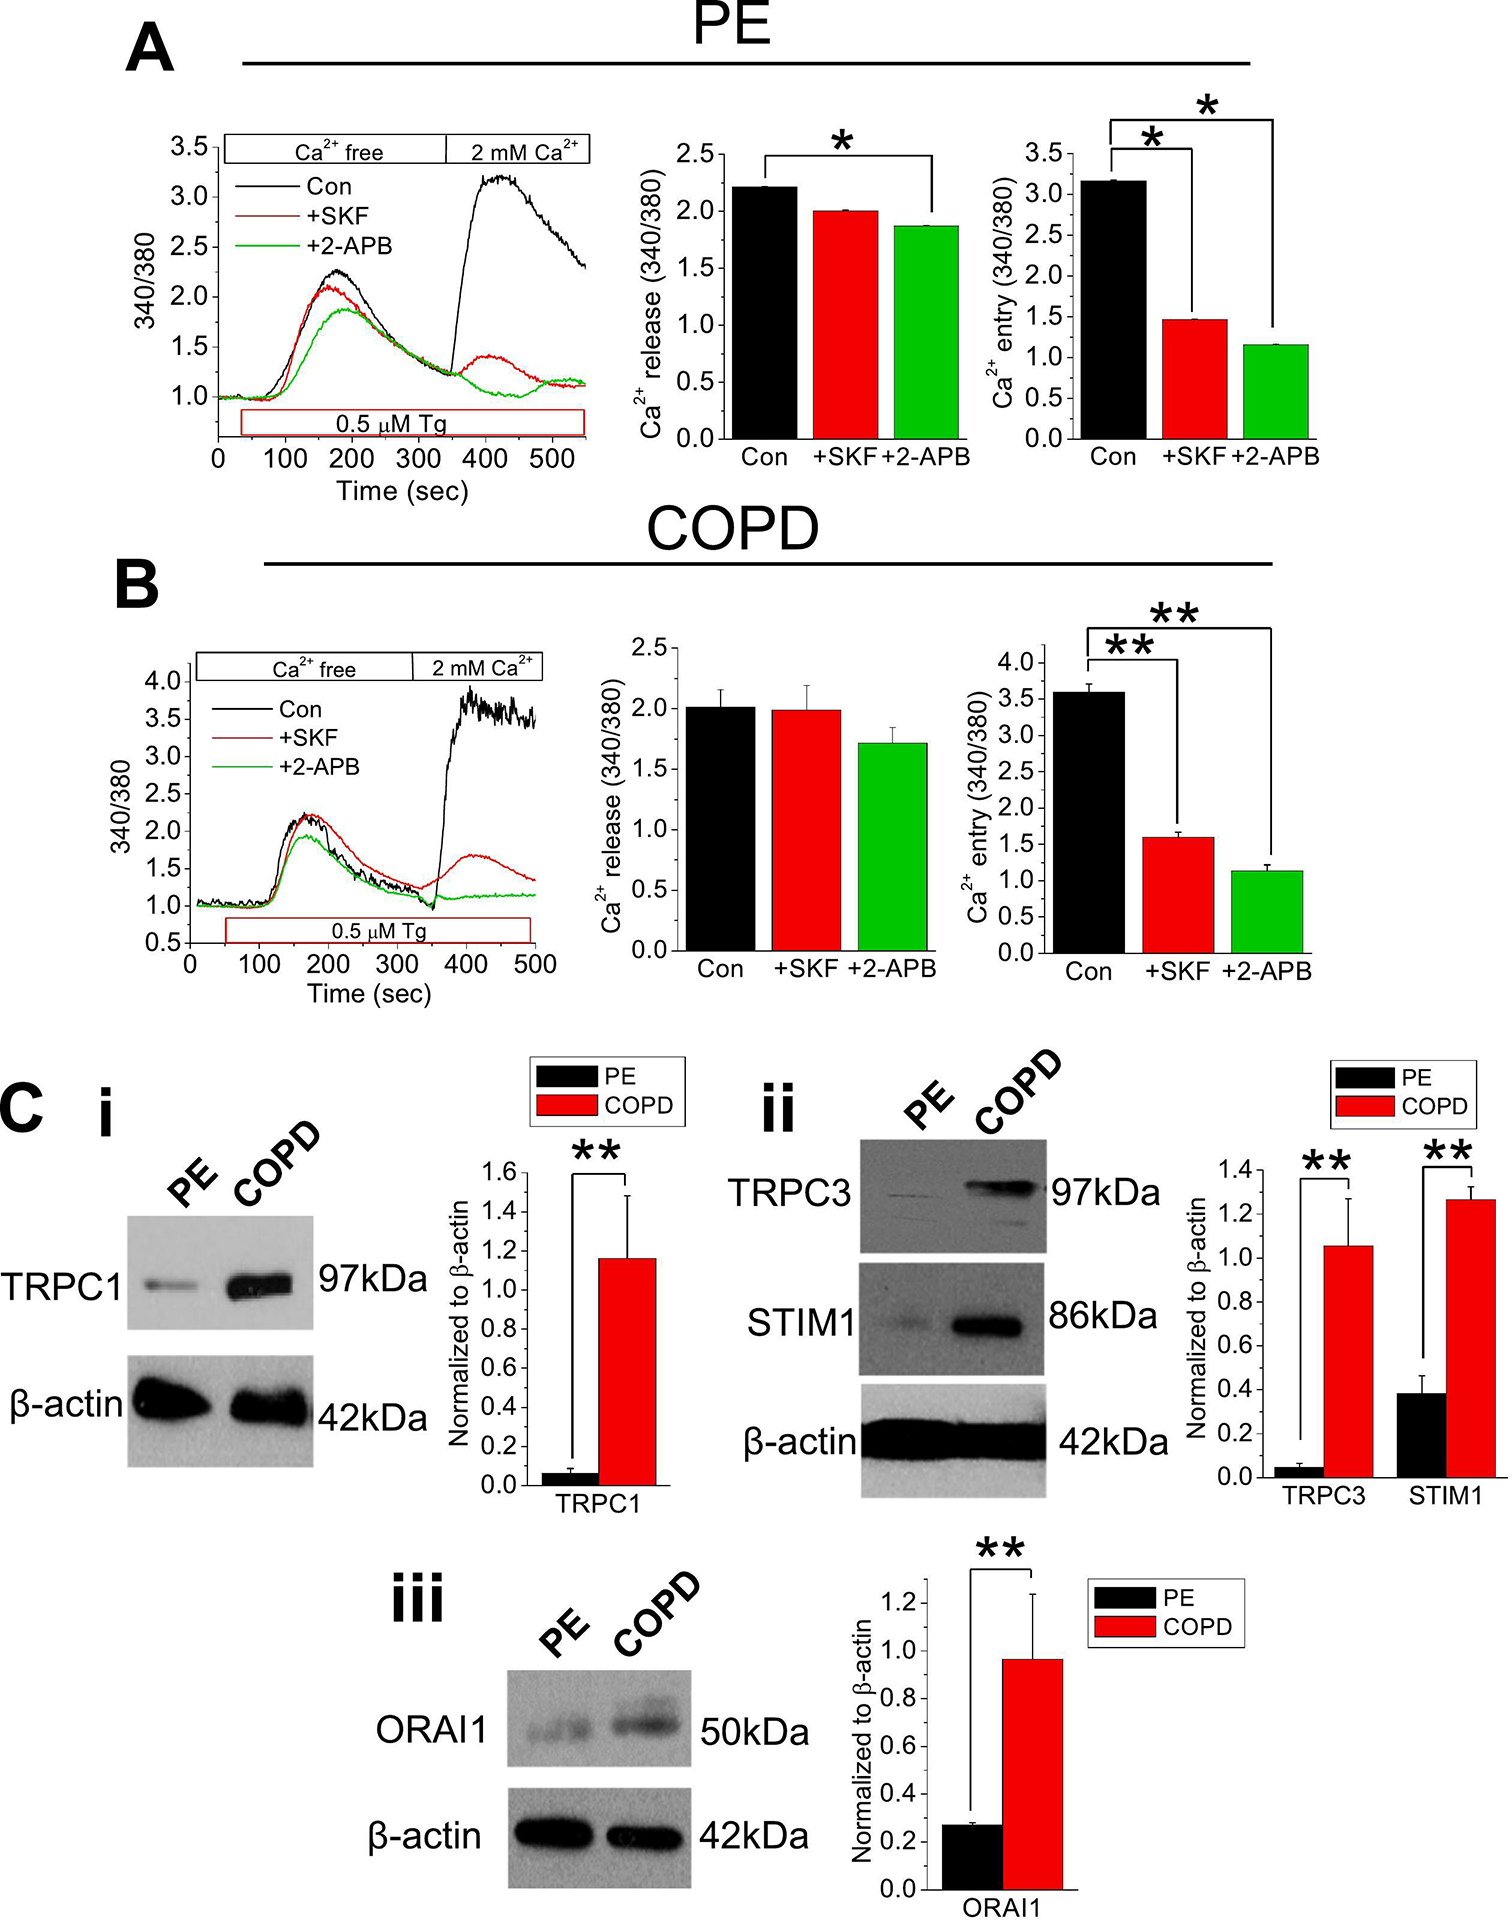
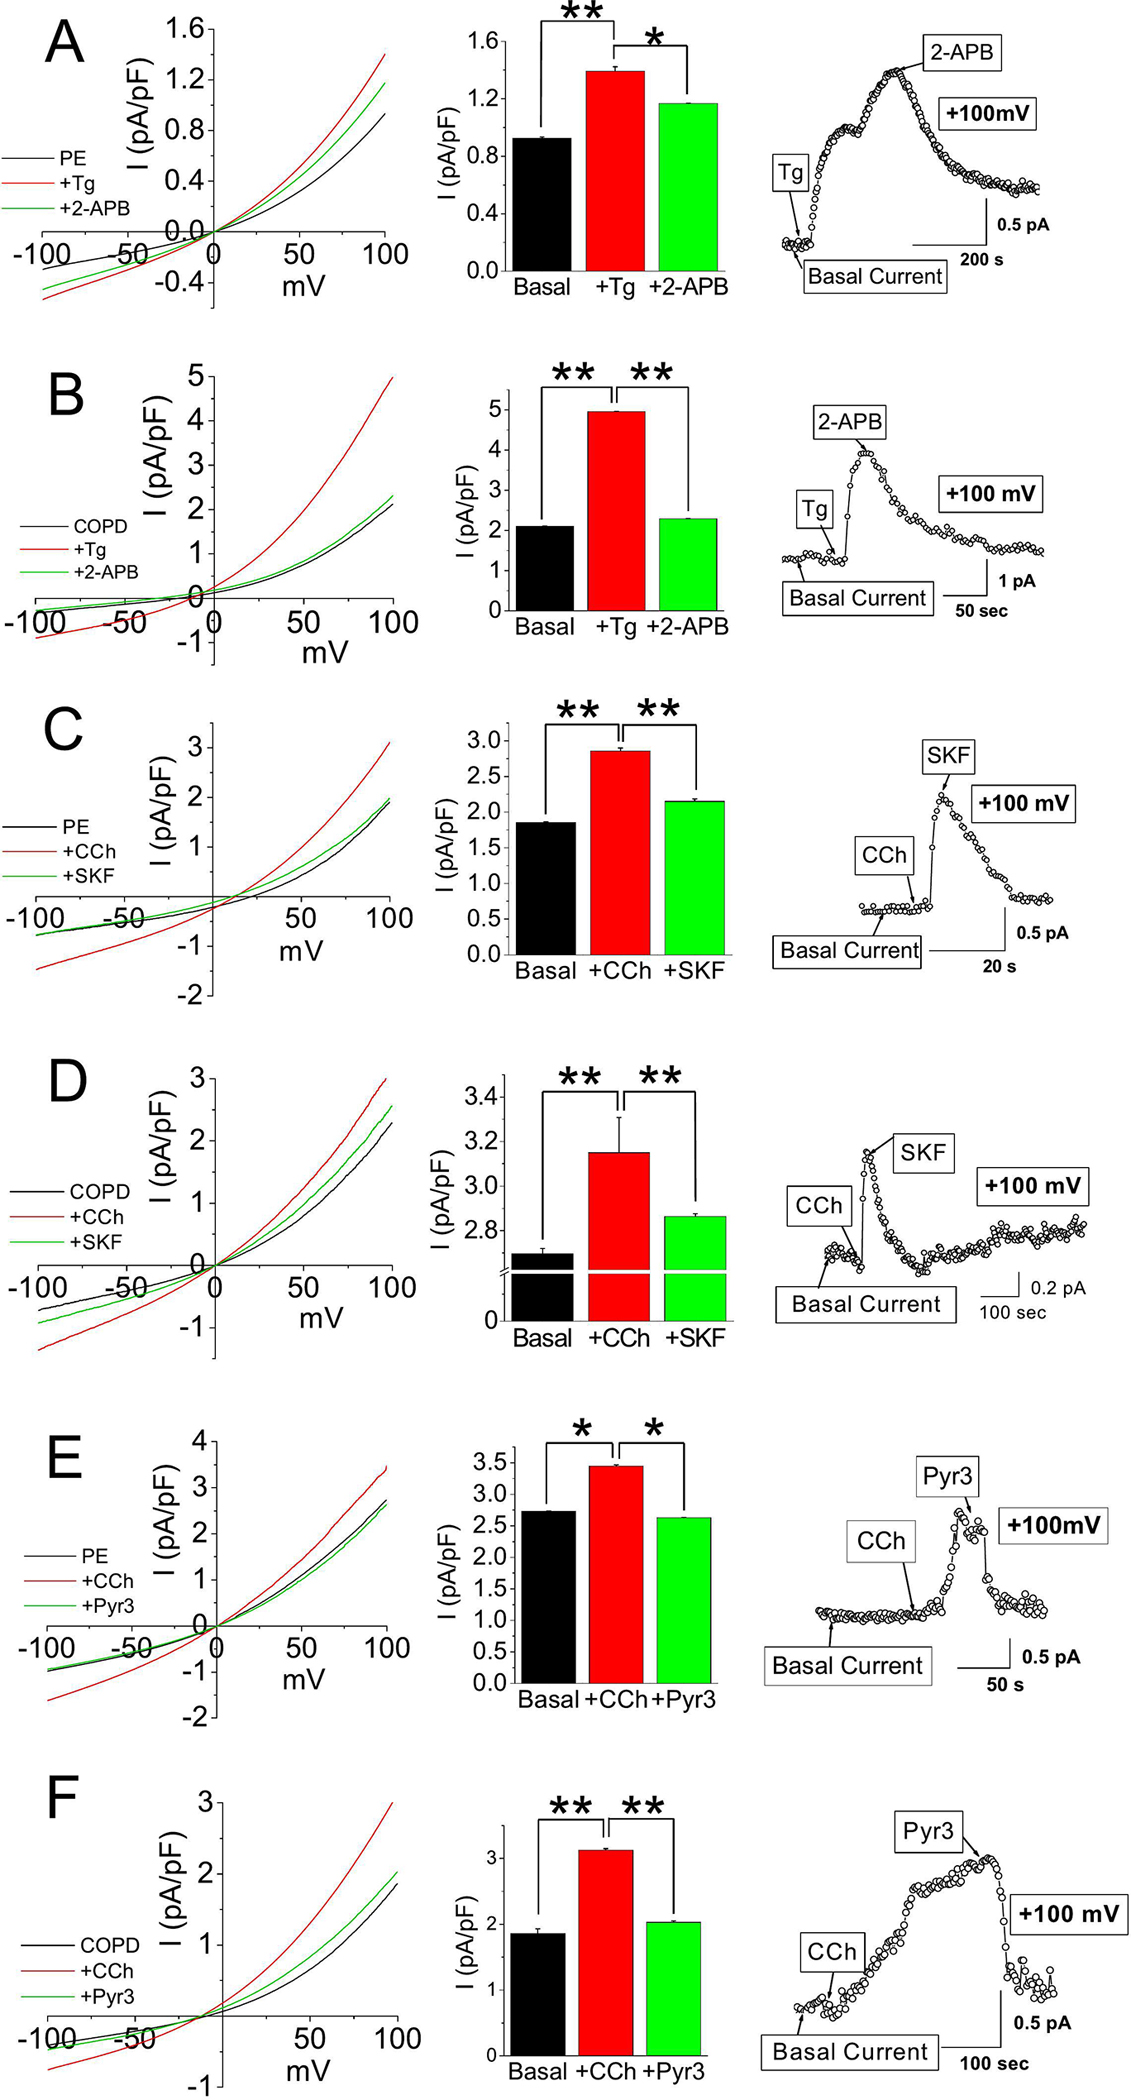
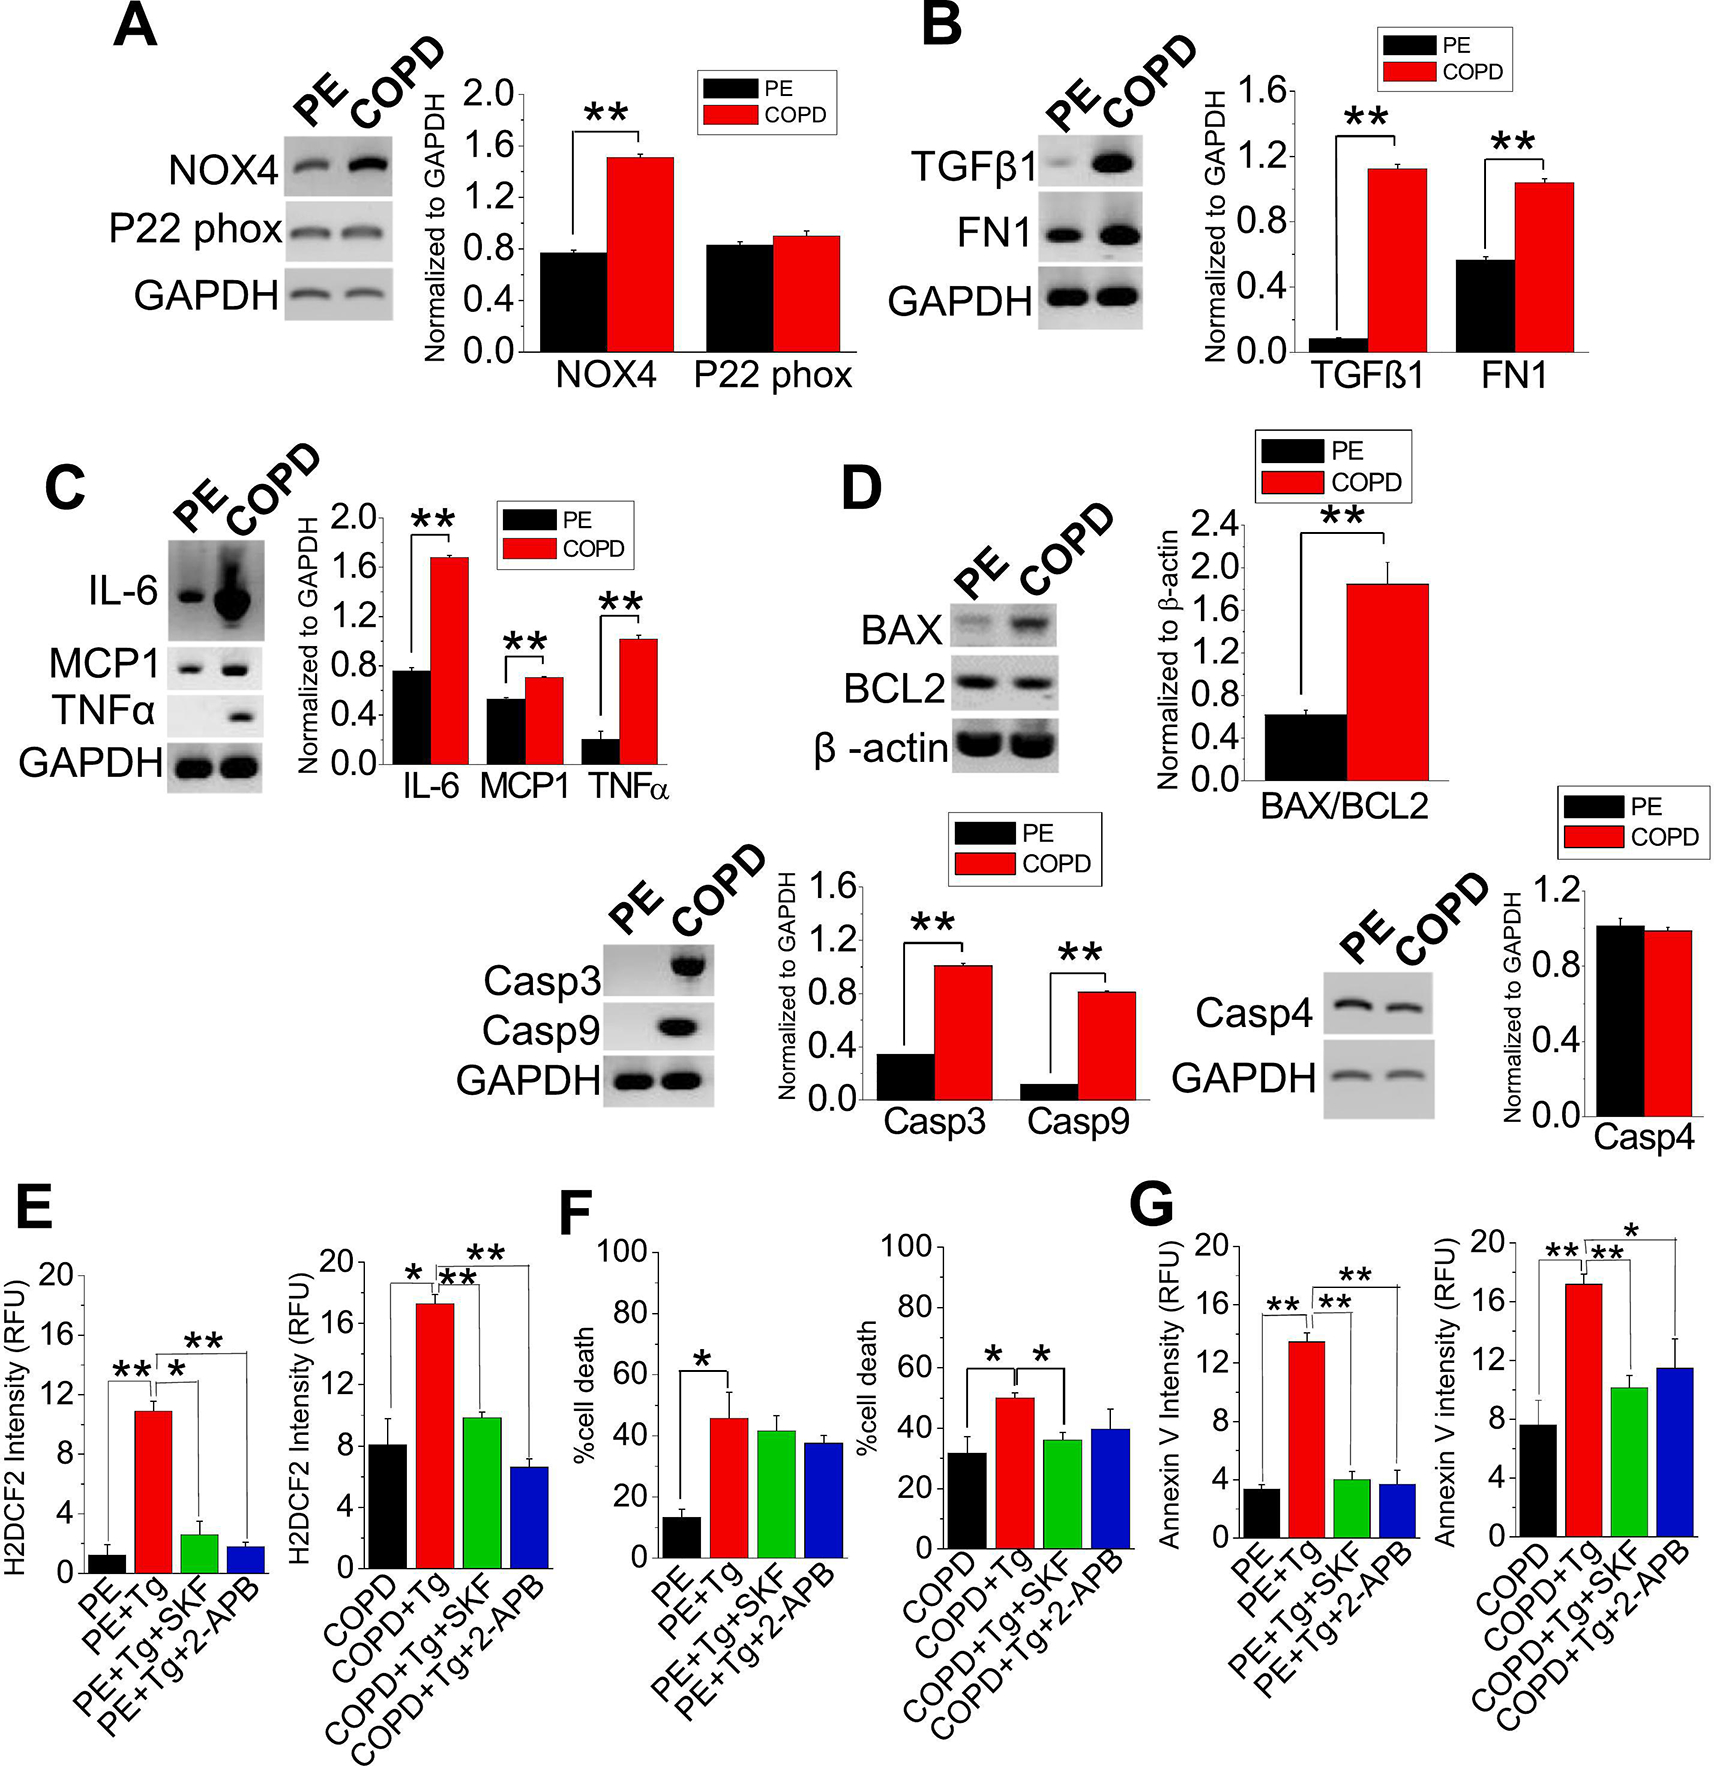
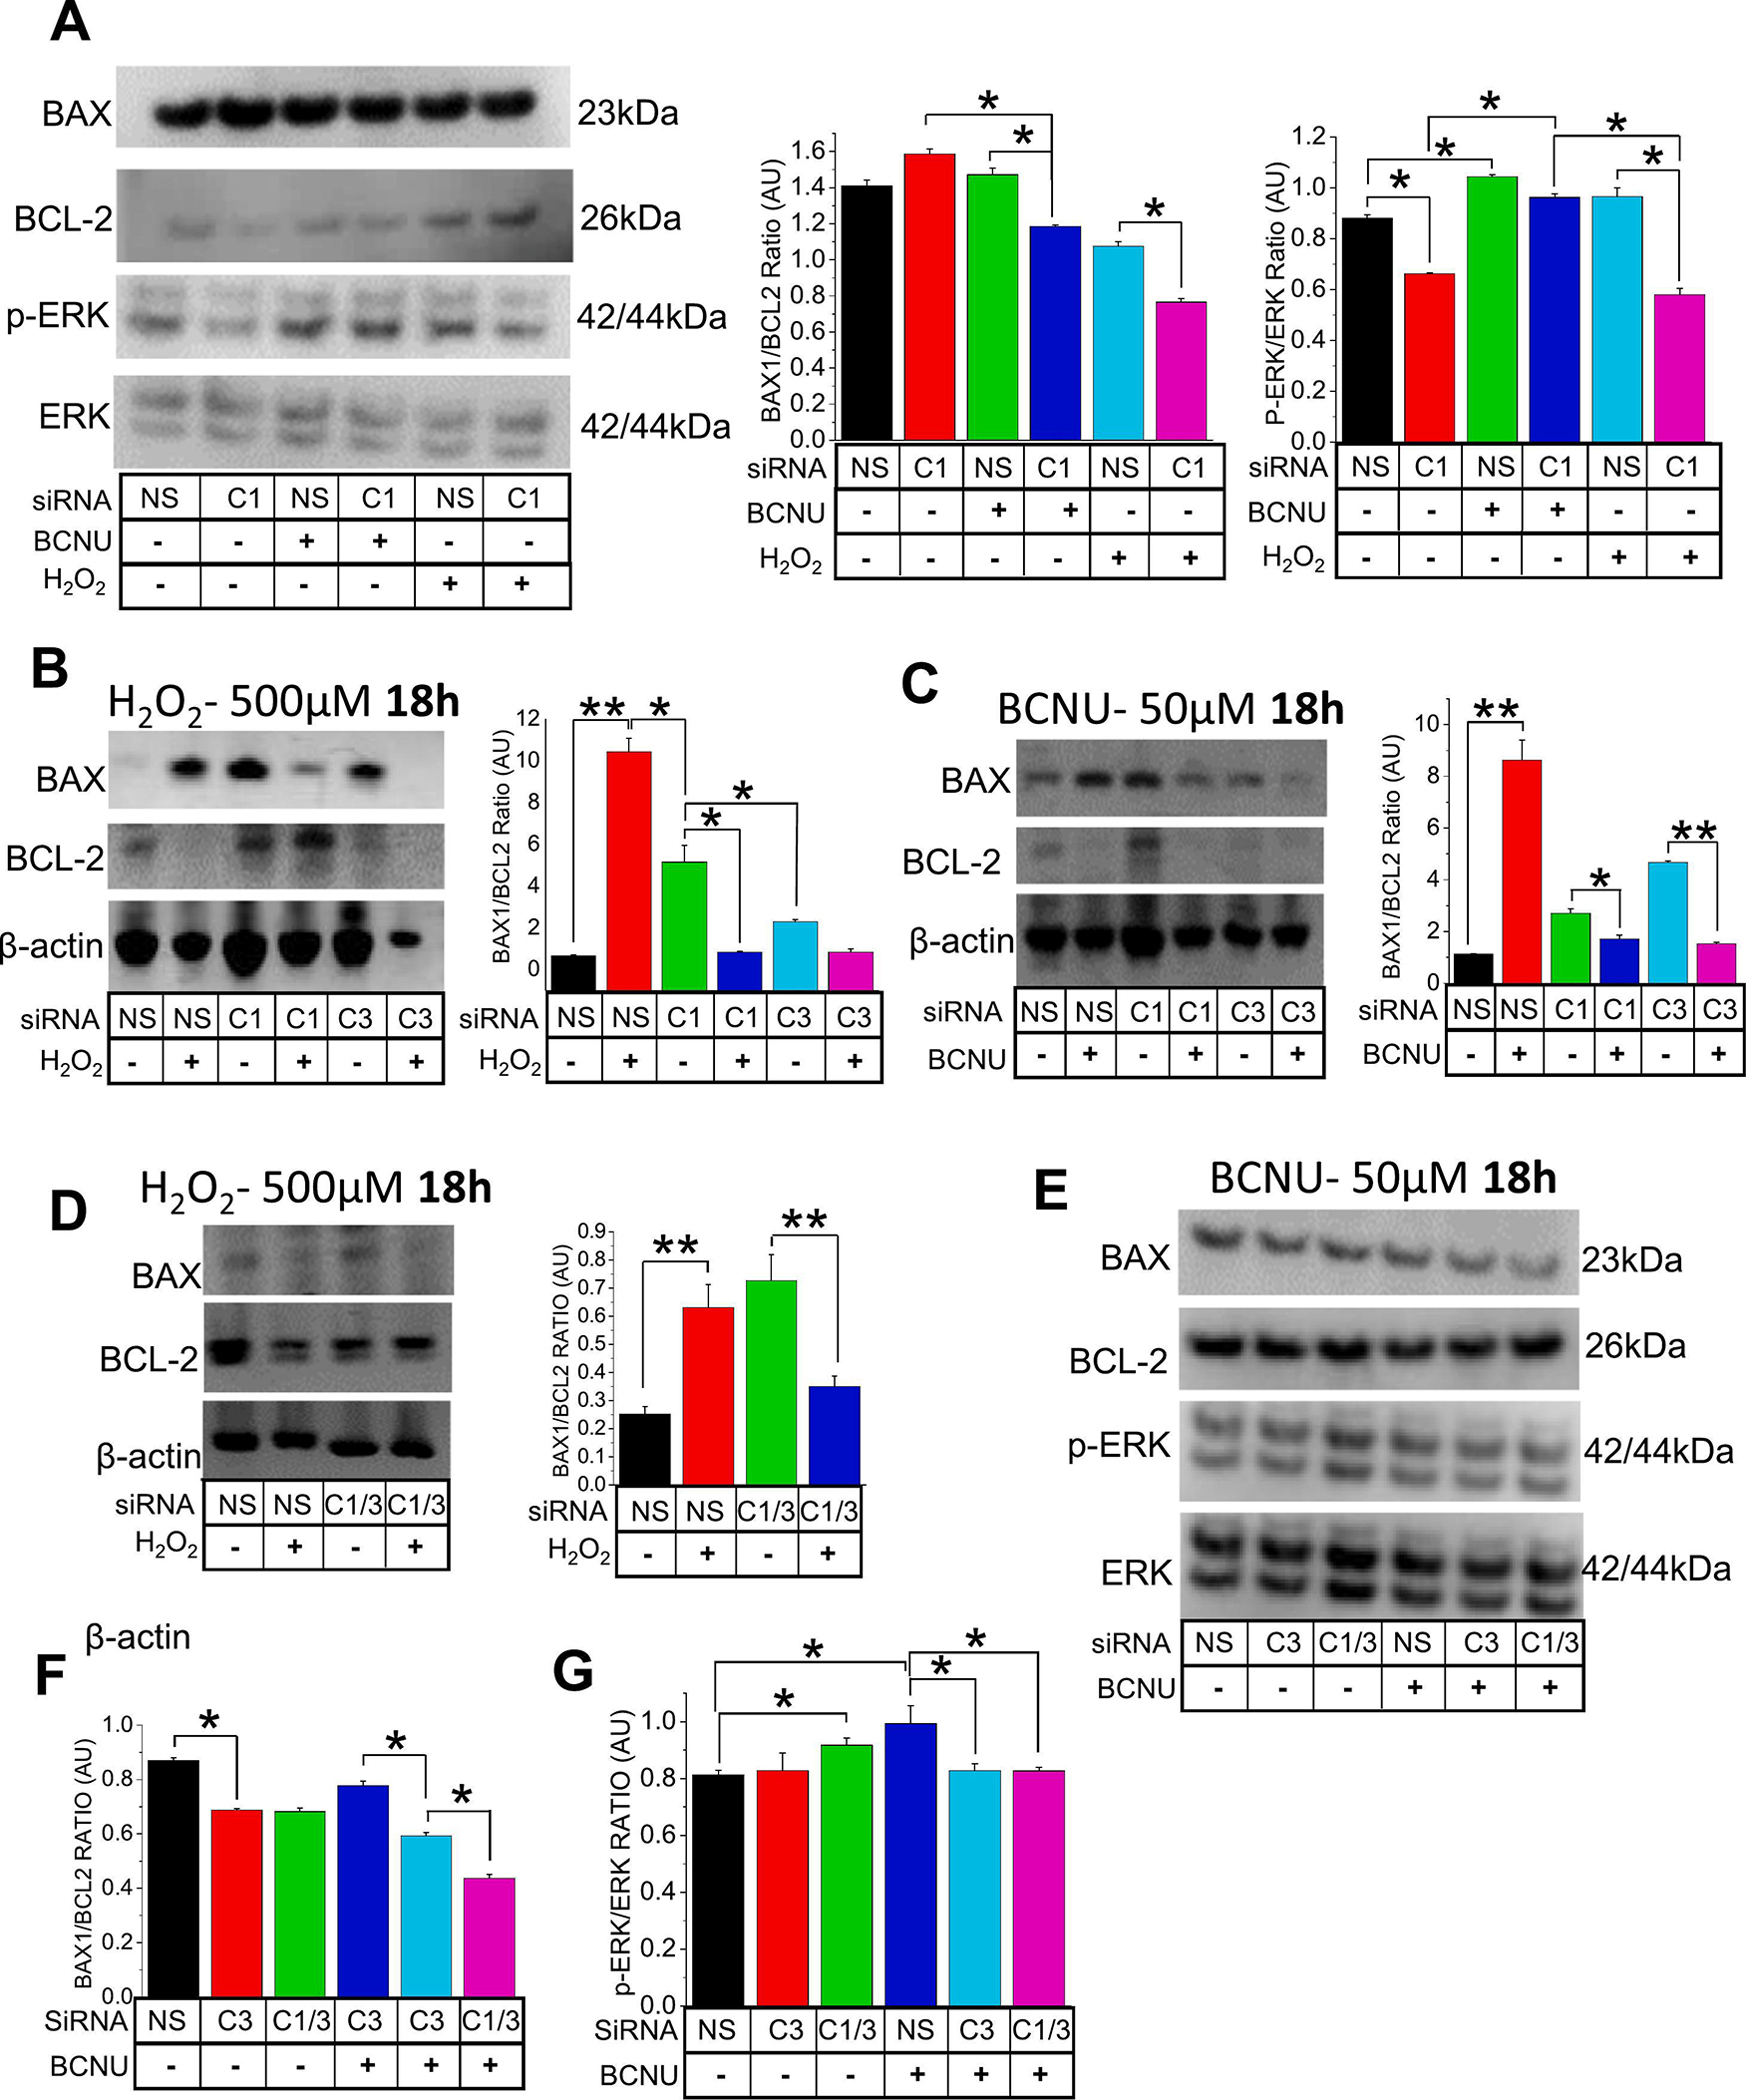
Oxidative stress is a predisposing factor in Chronic Obstructive Pulmonary Disease (COPD). Specifically, pulmonary epithelial (PE) cells reduce antioxidant capacity during COPD because of the continuous production of reactive oxygen species (ROS). However, the molecular pathogenesis that governs such ROS activity is unclear. Here we show that the dysregulation of intracellular calcium concentration ([Ca2+]i) in PE cells from COPD patients, compared to the healthy PE cells, is associated with the robust functional expressions of Transient Receptor Potential Canonical (TRPC)1 and TRPC3 channels, and Ca2+ entry (SOCE) components, Stromal Interaction Molecule 1 (STIM1) and ORAI1 channels. Additionally, the elevated expression levels of fibrotic, inflammatory, oxidative, and apoptotic markers in cells from COPD patients suggest detrimental pathway activation, thereby reducing the ability of lung remodeling. To further delineate the mechanism, we used human lung epithelial cell line, A549, since the behavior of SOCE and the expression patterns of TRPC1/C3, STIM1, and ORAI1 were much like PE cells. Notably, the knockdown of TRPC1/C3 in A549 cells substantially reduced the SOCE-induced [Ca2+]i rise, and reversed the ROS-mediated oxidative, fibrotic, inflammatory, and apoptotic responses, thus confirming the role of TRPC1/C3 in SOCE driven COPD-like condition. Higher TRPC1/C3, STIM1, and ORAI1 expressions, along with a greater Ca2+ entry, via SOCE in ROS-induced A549 cells, led to the rise in oxidative, fibrotic, inflammatory, and apoptotic gene expression, specifically through the extracellular signal-regulated kinase (ERK) pathway. Abatement of TRPC1 and/or TRPC3 reduced the mobilization of [Ca2+]i and reversed apoptotic gene expression and ERK activation, signifying the involvement of TRPC1/C3. Together these data suggest that TRPC1/C3 and SOCE facilitate the COPD condition through ROS-mediated cell death, thus implicating their likely roles as potential therapeutic targets for COPD. SUMMARY: Alterations in Ca2+ signaling modalities in normal pulmonary epithelial cells exhibit COPD through oxidative stress and cellular injury, compromising repair, which was alleviated through inhibition of store-operated calcium entry. SUBJECT AREA: Calcium, ROS, Cellular signaling, lung disease.

Keywords: Ca(2+) signaling; Lung disease; Oxidative stress; Pulmonary epithelial cells; TRPC channel.


Conflict of interest statement

Declaration of Competing Interest The authors declare that they have no known competing financial interests or personal relationships that could have appeared to influence the work reported in this paper.

Figures

Figure 1.
Figure 1.. Store-operated Ca2+ entry activation involves TRPC channel in PE or COPD cells.
Fura-2 ratiometric (340/380) [Ca2+]i measurements were retrieved from (A) PE or (B) COPD cells in Ca2+-free cell bath. Thapsigargin (Tg; 0.5 μM) was applied to cells with: no inhibitor (control; Con), 10 μM SKF-96365 (SKF), or 12 μM 2-APB, then the cell bath was replenished with 2.0 mM Ca2+. Quantitated bar diagrams (A, B) are depicting Ca2+ release or Ca2+ peaks. (C) Western blots showing expression of (i) TRPC1, (ii) TRPC3 and STIM1, or (iii) ORAI1 proteins in normal PE and COPD cells. Relative expressions normalized to β-actin are shown in bar diagrams. All bar diagrams are presents as mean + SEM. *, P < 0.05; **, P < 0.01. Experiments were performed n = 3 times. Student’s two-tailed t-test was performed to evaluate statistical significance between control (Con or PE) and experimental groups (+SKF, +2-APB, or COPD).
Figure 2.
Figure 2.. Enhanced Tg-induced SOCE current in COPD cells.
Current densities of voltage ramps from −100 to +100 mV were collected from PE or COPD cells and quantitated into I-V curves (A-F). After receiving baseline measurements from the cells, (A-B) Tg (0.5 μM) or (C-F) CCh (100 μM) was applied as an agonist, and then 2-APB (12 μM), SKF-96365 (SKF; 10 μM), or Pyr3 (3 μM) was applied as an inhibitor to the induced current. Bar graphs in A-F show average current densities at +100 mV in mean + SEM. *, P < 0.05; ** P < 0.01. Experiments were performed n=3 times. Student’s two-tailed t-test was performed to assess statistical significance between basal and activated/inhibited current densities of PE or COPD cells with agonist (CCh or Tg; A-F), and inhibitor (SKF-96365, 2-APB, or Pyr3; A-F).
Figure 3.
Figure 3.. COPD induces oxidative stress leading to upregulation of inflammation, fibrosis, and apoptosis.
Comparative gene expression analysis of PE cells and COPD cells depicts (A) oxidative stress (P22 Phox and NOX4), (B) fibrosis (TGFβ1 and FN1), (C) inflammation (IL-6, MCP1, and TNFα) or (D) apoptosis [BAX, BCL-2, Caspase (Casp) 3, Casp9, and Casp4]. (E) H2DCF2, (F) DAPI, and (G) Annexin V stainings were performed on PE and COPD cells with no treatment, Tg (1 μM) only, Tg+SKF-96365 (SKF; 10 μM), or Tg+2-APB (12 μM). Fluorescence intensity and percentage cell death were quantitated into bar graphs. Experiments were performed n=3 times. Bar graphs are in means ± SEM. *, p < 0.05; **, p < 0.01. Student’s two-tailed t-test was performed to establish statistical significance between the two groups. All gene (mRNA) expressions are normalized to GAPDH or β-actin.
Figure 4.
Figure 4.. Differential Ca2+ response in A549 cells after exposure to CCh and Tg.
Fura-2 traces of ratiometric (340/380) [Ca2+]i measurements were retrieved from A549 cells in a Ca2+free cell bath. 0.5 μM Tg was applied to A549 cells with no inhibitor (Con), (A) 10 μM SKF-96365 (SKF) or 12 μM 2-APB, and (B) Pyr6 (3 μM) or Pyr10 (3 μM) inhibitors to delineate the Ca2+ entry after replenishing the cell bath with 2.0 mM Ca2+. Current densities of voltage ramps from −100 to +100 mV were collected from A549 cells and quantitated into I-V curves. After obtaining the basal current measurement, CCh (100 μM) was applied as the agonist, then (C) Pyr6 or (D) Pyr10 was applied as an inhibitor. Bar graphs in A-E show the average current densities at +100 mV after applying CCh and Pyr6 or Pyr10 in mean + SEM. Percentage Pyr6 or Pyr10 inhibitions of CCh-induced current were quantified into bar diagrams in mean + SEM. *, P < 0.05; **, P < 0.01. Experiments were performed n = 3 times. Student’s two-tailed t-test was performed to evaluate statistical significance between control and experimental groups.
Figure 5.
Figure 5.. Silencing TRPC1 and TRPC3 in A549 cells diminishes the SOCE pathway.
Ratiometric (340/380) Fura-2 traces of [Ca2+]i measurements were retrieved from A549 cells in a Ca2+-free cell bath. 0.5 μM thapsigargin (Tg) were applied to A549 cells with (i) no siRNA, (ii) TRPC1 siRNA, (iii) TRPC3 siRNA, (iv) TRPC1+TRPC3 siRNAs, (v) ORAI siRNA, or (vi) STIM1 siRNA, then cell bath was replenished with 2.0 mM Ca2+. Inhibitors Pyr6 or Pyr10 were utilized in i-vi. Quantitated bar diagrams depicting Ca2+release or Ca2+ peak for experimental groups with (B-C) Pyr6 or (D-E) Pyr10 inhibitors are in mean + SEM. *, P < 0.05; ** P < 0.01. Experiments were performed n=3 times. Student’s two-tailed t-test was performed to evaluate the statistical significance between the sham (control) cells and those with siRNA (s).
Figure 6.
Figure 6.. SOCE is enhanced in COPD-like conditions for A549 cells.
Gene expression profiles of control (Con) or treated (+BCNU) A549 cells for (A) TRPC1 and TRPC3, or (B) SOCE components STIM1 and ORAI1. Expression levels (mRNA) were normalized by GAPDH. Mean fluorescence traces of Fura-2-AM-loaded (C) untreated or (D) BCNU-treated A549 cells showing Tg (0.5 μM)-induced rise of [Ca2+]i in Ca2+-free bath solution and its inhibition by Pyr6 or 2-APB. Extracellular solution was then adjusted to 2.0 mM Ca2+. Bar diagrams in C and D represent Ca2+release or Ca2+ entry peaks. Quantitated bar diagrams for A-D are in mean ± SEM. *, P < 0.05; ** P < 0.01. Experiments performed n=3 times. Student’s two-tailed t-test was performed to evaluate statistical significance between control and treated groups.
Figure 7.
Figure 7.. BCNU induces oxidative stress leading to upregulation of inflammation, fibrosis and apoptosis for A549 cells in COPD-like conditions.
Comparative analysis of A549 cells (Con) and treated A549 cell (+BCNU) showing oxidative stress through analyses gene expressions (mRNA) of (A) P22 Phox and NOX4, which was further corroborated by (B) 6 and 24 h H2O2 release measurements, showing progressive increase in H2O2 release with increasing BCNU concentration [control (0μM), 30μM, 50μM, 100μM]. A549 fibrosis was evident following BCNU treatment in gene expressions of (C) TGFβ1, FN and SMα and inflammatory gene expression markers, namely (D) IL-6, MCP1, TNFα and NF-κβ. BCNU treatment also induced apoptosis in A549 cells as shown in (E) protein expression analysis of BAX and BCL-2 following incubation of A549 cells with BCNU or H2O2 at 1 and 12 h and (F) ERK phosphorylation (p-ERK) (incubated with BCNU or H2O2 for 1 and 12 h). (G) Gene expression analysis of BAX, BCL-2, Caspase 3 and Caspase 9, (H) DAPI staining and (I) LDH release analysis, further corroborated evidence of BCNU-inducing apoptosis in A549 cells in increasing concentrations [Con (0μM), 30μM, 100μM, or Con (0μM), 30μM, 50μM, 100μM, respectively]. For all gene expression analyses, A549 cells were incubated with BCNU for 12 h. Bar graphs are in mean ± SEM. *, P < 0.05; **, P < 0.01. All gene and protein expressions are normalized to GAPDH and β-actin respectively. Experiments were performed n=3 times. Student’s two-tailed t-test was performed to evaluate statistical significance between control and BCNU-treated A549 cells (A-D, G), or control A549 cells with or without treatment (+BCNU or +H2O2; B, H). One way ANOVA and post-hoc Tukey’s test for further analysis was performed to compare and analyze A549 cells in different BCNU concentrations (E, F).
Figure 8.
Figure 8.. Knockdown of TRPC1 and 3 protects A549 cells from ROS mediated apoptosis.
To analyze the contributions of TRPC1 (C1) and TRPC3 (C3) in Oxidative stress induced cell death, (A) effect of silencing TRPC1 (siRNA 10nM) in A549 cells were presented through western blot analysis, [protein expression through BAX/BCL-2 ratios and p-ERK/ERK (total) ratios] following BCNU (50μM) or H2O2 (500μM) treatments for 18 h. The siRNA (10nM) inhibition of C1 and/or C3 genes was analyzed through mRNA expressions of BAX and BCL-2 following (B) H2O2 (500μM) and (C) BCNU (50μM) incubations respectively for 18 h. (D) A double knockdown of C1 and C3 (siRNA; 10nM) was also performed and analyzed through gene expressions of BAX and BCL-2 following H2O2 (500μM) incubation for 18 h. (E) The silencing of C3 and the double knockdown of C1 and C3 were analyzed through protein expression analysis of (F) BAX/BCL-2 ratios and (G) p-ERK/ ERK ratios following BCNU (50μM) treatments. A non-targeting siRNA (NS; scramble; 10nM) was used as a control in all siRNA experiments. Bar graphs are in means ± SEM. *, P < 0.05; **, P < 0.01. All expressions were normalized to β-actin. Experiments were performed n=3 times. One way ANOVA and post-hoc Tukey’s test were performed to compare and analyze A549 cells in different BCNU concentrations and siRNA (s) conditions (A-G).

References

    1. Pagano G, Manini P, Bagchi D, Oxidative stress-related mechanisms are associated with xenobiotics exerting excess toxicity to Fanconi anemia cells, Environ. Health Perspect. 2003; 111: 1699–1703. 10.1289/ehp.6229. - DOI - PMC - PubMed
    1. Brown DM, Donaldson K, Borm PJ, Schins RP, Dehnhardt M, Gilmour P, Jimenez LA, Stone V, Calcium and ROS-mediated activation of transcription factors and TNF-alpha cytokine gene expression in macrophages exposed to ultrafine particles, Am. J. Physiol. Lung Cell. Mol. Physiol. 2004; 286: L344–353. 10.1152/ajplung.00139.2003. - DOI - PubMed
    1. Cowley EA, Linsdell P, Characterization of basolateral K+ channels underlying anion secretion in the human airway cell line Calu-3, J. Physiol. 2002; 538: 747–757. 10.1113/jphysiol.2001.013300. - DOI - PMC - PubMed
    1. Cha M-J, Jang J-K, Ham O, Song B-W, Lee S-Y, Lee CY, Park J-H, Lee J, Seo H-H, Choi E, Jeon W, Hwang HJ, Shin H-T, Choi E, Hwang K-C, MicroRNA-145 suppresses ROS-induced Ca2+ overload of cardiomyocytes by targeting CaMKIIδ, Biochem. Biophys. Res. Commun. 2013; 435: 720–726. 10.1016/j.bbrc.2013.05.050. - DOI - PubMed
    1. Umemoto S, Tanaka M, Kawahara S, Kubo M, Umeji K, Hashimoto R, Matsuzaki M, Calcium antagonist reduces oxidative stress by upregulating Cu/Zn superoxide dismutase in stroke-prone spontaneously hypertensive rats, Hypertens. Res. Off. J. Jpn. Soc. Hypertens. 2004; 27: 877–885. 10.1291/hypres.27.877. - DOI - PubMed

Publication types

MeSH terms

Substances