. 2023 Jul 3;146(7):2957-2974.
doi: 10.1093/brain/awad037.

Visualizing reactive astrocyte-neuron interaction in Alzheimer's disease using 11C-acetate and 18F-FDG

Affiliations

Visualizing reactive astrocyte-neuron interaction in Alzheimer's disease using 11C-acetate and 18F-FDG

Min-Ho Nam et al. Brain. .

Abstract

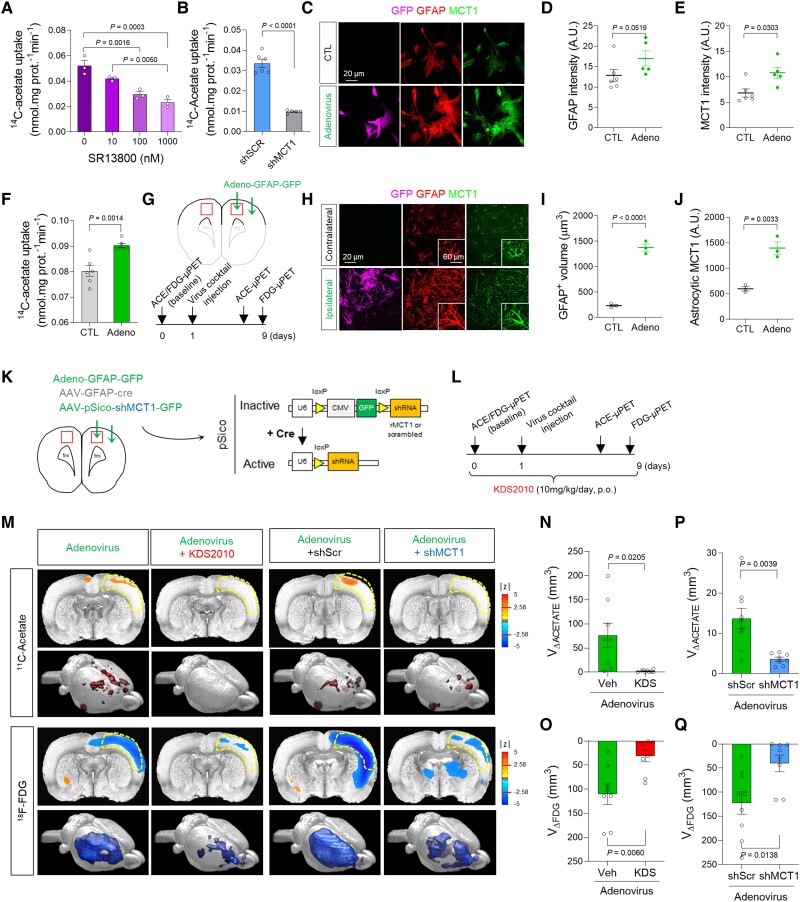
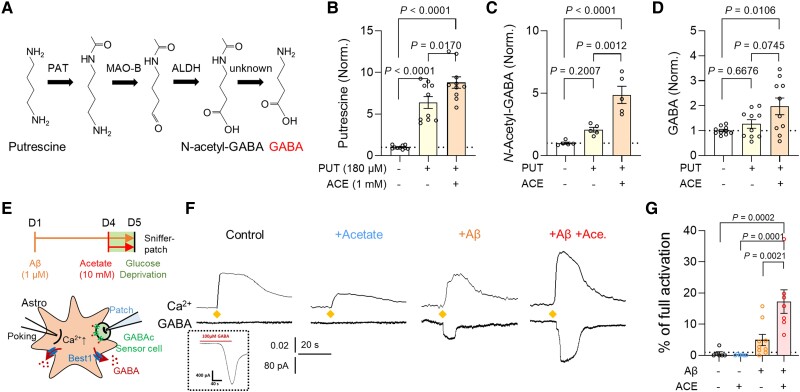
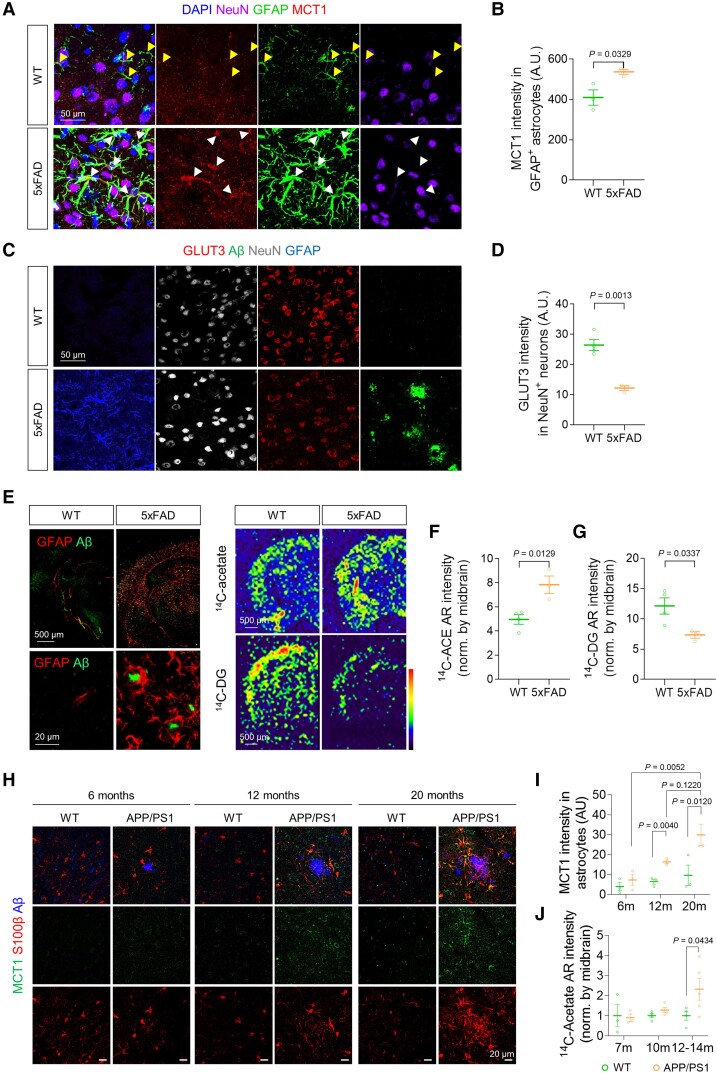
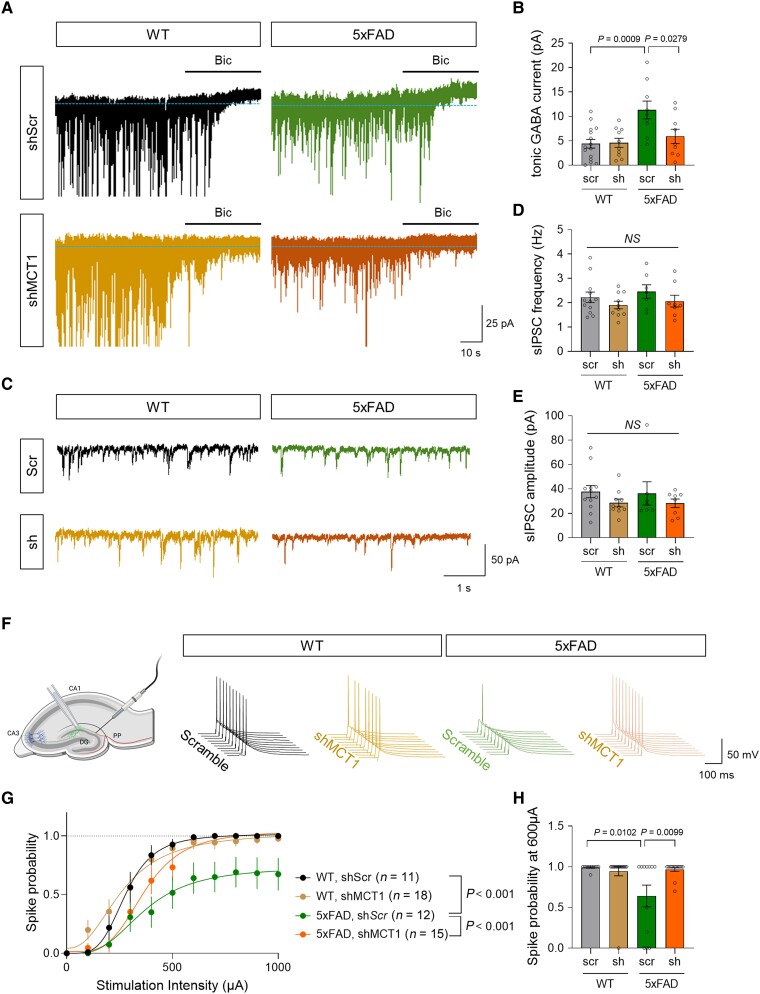
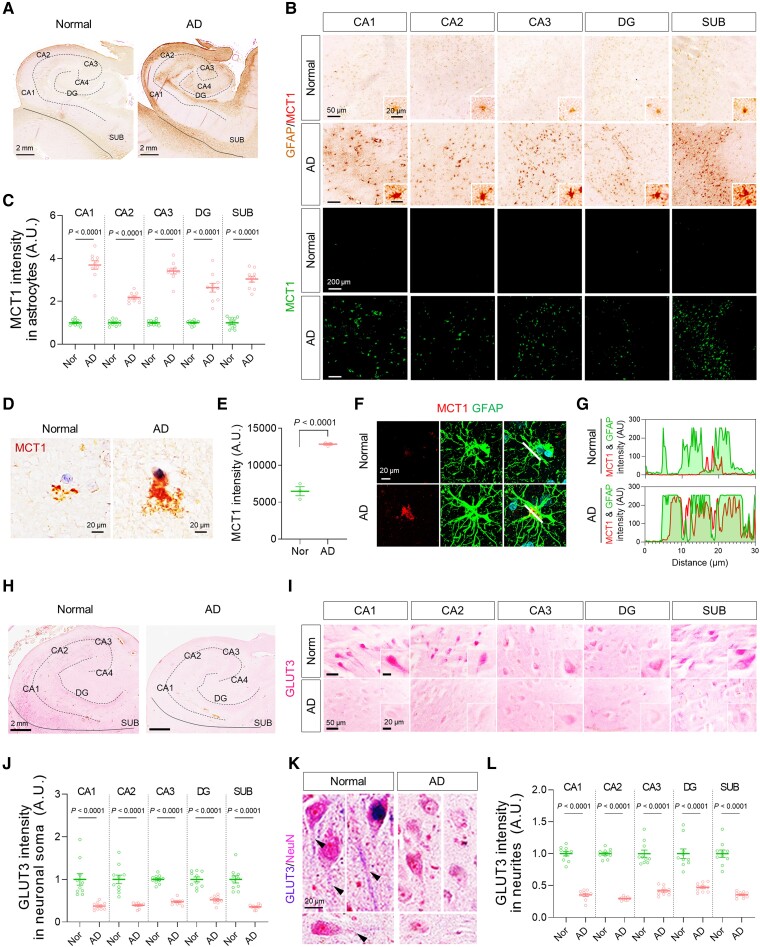
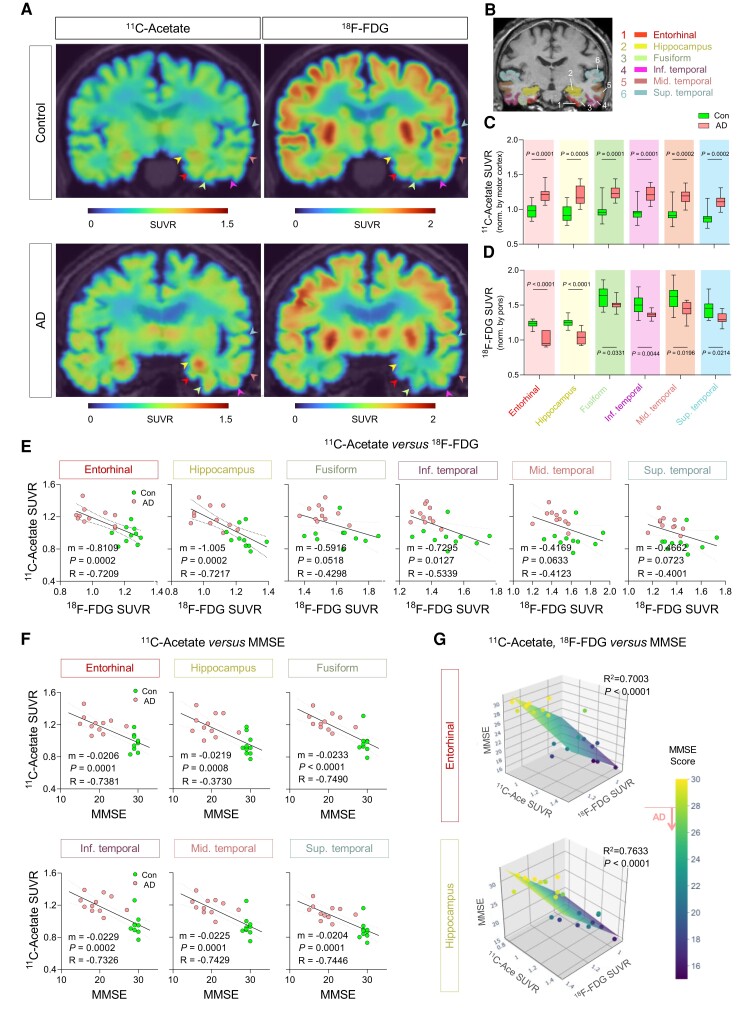
Reactive astrogliosis is a hallmark of Alzheimer's disease (AD). However, a clinically validated neuroimaging probe to visualize the reactive astrogliosis is yet to be discovered. Here, we show that PET imaging with 11C-acetate and 18F-fluorodeoxyglucose (18F-FDG) functionally visualizes the reactive astrocyte-mediated neuronal hypometabolism in the brains with neuroinflammation and AD. To investigate the alterations of acetate and glucose metabolism in the diseased brains and their impact on the AD pathology, we adopted multifaceted approaches including microPET imaging, autoradiography, immunohistochemistry, metabolomics, and electrophysiology. Two AD rodent models, APP/PS1 and 5xFAD transgenic mice, one adenovirus-induced rat model of reactive astrogliosis, and post-mortem human brain tissues were used in this study. We further curated a proof-of-concept human study that included 11C-acetate and 18F-FDG PET imaging analyses along with neuropsychological assessments from 11 AD patients and 10 healthy control subjects. We demonstrate that reactive astrocytes excessively absorb acetate through elevated monocarboxylate transporter-1 (MCT1) in rodent models of both reactive astrogliosis and AD. The elevated acetate uptake is associated with reactive astrogliosis and boosts the aberrant astrocytic GABA synthesis when amyloid-β is present. The excessive astrocytic GABA subsequently suppresses neuronal activity, which could lead to glucose uptake through decreased glucose transporter-3 in the diseased brains. We further demonstrate that 11C-acetate uptake was significantly increased in the entorhinal cortex, hippocampus and temporo-parietal neocortex of the AD patients compared to the healthy controls, while 18F-FDG uptake was significantly reduced in the same regions. Additionally, we discover a strong correlation between the patients' cognitive function and the PET signals of both 11C-acetate and 18F-FDG. We demonstrate the potential value of PET imaging with 11C-acetate and 18F-FDG by visualizing reactive astrogliosis and the associated neuronal glucose hypometablosim for AD patients. Our findings further suggest that the acetate-boosted reactive astrocyte-neuron interaction could contribute to the cognitive decline in AD.

Keywords: 11C-Acetate; 18F-Fluorodeoxyglucose; Alzheimer’s disease; PET imaging; monocarboxylate transporter 1 (MCT1); reactive astrocyte.


Conflict of interest statement

The authors report no competing interests.

Figures

Figure 1
Figure 1
MCT1-mediated acetate hypermetabolism and glucose hypometabolism in the adenovirus-induced reactive astrogliosis model. (A and B) Blockade effect of SR13800 (A) or Mct1 gene-silencing (B) on 14C-acetate uptake in primary cultured astrocytes. (C) Representative images displaying GFAP and MCT1 expressions in primary cultured astrocytes 48 h after adenovirus treatment. (D and E) Quantification of GFAP and MCT1 immunoreactivity (n = 6 and 5 replicates for CTL and Adeno groups, respectively). (F) The adenovirus effect on 14C-acetate uptake. (G) Schematic diagram of in vivo micro-PET imaging of adenovirus model. (H) Representative images displaying GFAP and MCT1 expressions in adenovirus model. (I and J) Quantification of the cell volume (I) and MCT1 expression (J) of GFAP-positive cells (n = 3 rats). (K) Schematic diagram of virus injection for astrocyte-specific Mct1 gene-silencing. (L) Timeline of PET imaging schedule. (M) Left: Parametric images from voxel-based comparison of 11C-acetate and 18F-FDG PET imaging in adenovirus model with or without KDS2010 treatment. Right: Parametric images from voxel-based comparison of 11C-acetate and 18F-FDG PET imaging in adenovirus model with scrambled-shRNA or MCT1-shRNA. (N and O) Quantification of the volume of increased 11C-acetate uptake (n = 8 and 9 rats for vehicle and KDS2010 groups, respectively). (P and Q) Quantification of the volume of decreased 18F-FDG uptake (n = 9 and 8 rats for shScr and shMct1 groups, respectively). Mean ± SEM. Significance was assessed by one-way ANOVA with Tukey (A), Mann-Whitney test (D, E, I and J), or two-tailed unpaired Student’s t-test with Welch’s correction (F, N and O) or without Welch’s correction (P and Q).
Figure 2
Figure 2
Acetate facilitates astrocytic GABA synthesis in AD-like conditions. (A) Schematic diagram of astrocytic GABA-synthetic pathway. (BD) The level of putrescine, N-acetyl-GABA and GABA analysed by LC-MS. (E) Schematic diagram of sniffer patch to record GABA current. (F) Representative traces of Ca2+ signal (top) and GABA current (bottom). Diamonds indicate the time point of poking the astrocyte. (G) Quantification of poking-induced GABA current. Mean ± SEM. Significance was assessed by one-way ANOVA with Tukey.
Figure 3
Figure 3
Increased MCT1 and reduced GLUT3 are associated with acetate hypermetabolism and glucose hypometabolism in AD mice. (A) Representative images displaying GFAP and MCT1 expressions in the cortex of 5xFAD mice. (B) Quantification of astrocytic MCT1 immunoreactivity (n = 3 mice for each group). (C) Representative images displaying NeuN and GLUT3 expressions in the cortex of 5xFAD mice. (D) Quantification of neuronal GLUT3 immunoreactivity (n = 3 mice for each group). (E) Top: Representative images displaying Aβ-plaque and GFAP expressions in 5xFAD mice. Bottom: Representative autoradiographic images of 14C-acetate and 14C-DG. (F and G) Quantification of 14C-acetate and 14C-DG (n = 4 and 3 mice for WT and 5xFAD, respectively). (H) Representative confocal images of MCT1 and S100b in 6-, 12- and 20-month-old (m) APP/PS1 transgenic mice. (I) Quantification of S100b-positive astrocytic MCT1 expression (n = 3 for each group). (J) Quantification of 14C intensity (n = 3, 3, 4, 4, 4 and 5 mice for 7 m WT, 7 m APP/PS1, 10 m WT, 10 m APP/PS1, 12–14 m WT, and 12–14 m APP/PS1, respectively). Mean ± SEM for bar graphs. Median and quartiles for violin plots. Significance was assessed by two-tailed unpaired Student’s t-test (B, D, F and G), Two-way ANOVA with Tukey (I), or Two-way ANOVA with Sidak (J).
Figure 4
Figure 4
Astrocytic MCT1 gene-silencing reduces tonic inhibition and spike probability in the hippocampus of an AD mouse model. (A) Representative traces of tonic GABA recording from hippocampal dentate granule cells of 5xFAD and WT littermates. (B) Quantification of tonic GABA current (n = 15, 10, 9 and 9 cells from three mice for each group). (C) Representative traces of spontaneous inhibitory postsynaptic current (sIPSC) recording. (D and E) Quantification of sIPSC frequency and amplitude (n = 12, 10, 7 and 8 cells from three mice for each group). (F) Schematic diagram of action potential recording from dentate granule cells upon electrical stimulation of hippocampal perforant path (left) and representative traces of spike probability. (G) Quantification of spike probability upon various stimulation intensities (n = 11, 18, 12 and 15 cells from three mice for each group). (H) Quantification of spike probability at 600 μA stimulation. Mean ± SEM. Significance was assessed by one-way ANOVA with Tukey.
Figure 5
Figure 5
Astrocytic MCT1 is increased while neuronal GLUT3 is decreased in the hippocampus of AD patients. (A and B) Representative images of double-staining of GFAP and MCT1 in post-mortem hippocampal tissues from normal subjects (n = 10) and AD post-mortem brains (n = 10). (C) Quantification of astrocytic MCT1 intensity in each hippocampal sub-region. (D) Representative images of MCT1 immunoreactivity in the cortex of normal subject and AD patient. (E) Quantification of MCT1 intensity in the cortex of normal subjects (n = 3) and AD patients (n = 3). (F) Representative images of double-staining of MCT1 (red) and GFAP (green) in the cortex of normal subject and AD patient. (G) Co-localization analysis of MCT1 and GFAP signals in the cortex of normal subject and AD patient. White lines in merged images were drawn to measure the space cross-correlation of MCT1 and GFAP signals. (H and I) Representative images of single-staining of GLUT3 in neuronal soma of post-mortem hippocampal tissues from normal subjects (n = 10) and AD post-mortem brains (n = 10). (J) Quantification of GLUT3 intensity in neuronal soma. (K) Representative images of double-staining of NeuN and GLUT3 in neurites. (L) Quantification of GLUT3 intensity in neurites. Mean ± SEM. Significance was assessed by two-tailed unpaired Student’s t-test (E), Mann-Whitney test (J, CA1, CA2, DG and SUB; L, SUB) or two-tailed unpaired Student’s t-test with Welch’s correction (others).
Figure 6
Figure 6
11C-acetate and 18F-FDG PET imaging for visualizing reactive astrogliosis and the associated neuronal glucose hypometabolism in AD patients’ brains. (A) Representative PET images of 11C-acetate and 18F-FDG in control and AD patients. (B) ROIs from an MR image. The ROI colours are matched with arrowheads in A. (C and D) Quantification of 11C-acetate and 18F-FDG SUVR in each ROI of control (n = 10) and AD patients (n = 11). (E) Correlation between 11C-acetate SUVR and MMSE scores. (F) Multiple correlations between 11C-acetate SUVR, 18F-FDG SUVR in entorhinal cortex and hippocampus, and MMSE scores. The multiple correlations in the fusiform, inferior, middle and superior temporal gyrus are displayed in Supplementary Fig. 7B. Mean ± SEM. Significance was assessed by two-tailed unpaired Student’s t-test (C and D), linear regression (E), or multiple linear regression (F) with Pearson’s correlation.

Comment in

References

    1. Chun H, Lee CJ. Reactive astrocytes in Alzheimer’s disease: A double-edged sword. Neurosci Res. 2018;126:44–52. - PubMed
    1. Nordberg A. Molecular imaging in Alzheimer’s disease: New perspectives on biomarkers for early diagnosis and drug development. Alzheimers Res Ther. 2011;3:34. - PMC - PubMed
    1. Carter SF, Scholl M, Almkvist O, et al. Evidence for astrocytosis in prodromal Alzheimer disease provided by 11C-deuterium-L-deprenyl: A multitracer PET paradigm combining 11C-Pittsburgh compound B and 18F-FDG. J Nucl Med. 2012;53:37–46. - PubMed
    1. Bi F, Huang C, Tong J, et al. Reactive astrocytes secrete lcn2 to promote neuron death. Proc Natl Acad Sci U S A. 2013;110:4069–4074. - PMC - PubMed
    1. Tao J, Wu H, Lin Q, et al. Deletion of astroglial dicer causes non-cell-autonomous neuronal dysfunction and degeneration. J Neurosci. 2011;31:8306–8319. - PMC - PubMed

Publication types