

Evaluating methods for measuring background connectivity in slow event-related functional magnetic resonance imaging designs
- PMID: 37062880
- PMCID: PMC10275534
- DOI: 10.1002/brb3.3015
Evaluating methods for measuring background connectivity in slow event-related functional magnetic resonance imaging designs
Abstract
Introduction: Resting-state functional magnetic resonance imaging (fMRI) is widely used for measuring functional interactions between brain regions, significantly contributing to our understanding of large-scale brain networks and brain-behavior relationships. Furthermore, idiosyncratic patterns of resting-state connections can be leveraged to identify individuals and predict individual differences in clinical symptoms, cognitive abilities, and other individual factors. Idiosyncratic connectivity patterns are thought to persist across task states, suggesting task-based fMRI can be similarly leveraged for individual differences analyses.
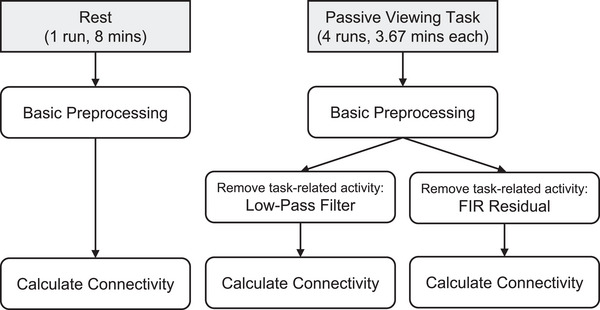
Method: Here, we tested the degree to which functional interactions occurring in the background of a task during slow event-related fMRI parallel or differ from those captured during resting-state fMRI. We compared two approaches for removing task-evoked activity from task-based fMRI: (1) applying a low-pass filter to remove task-related frequencies in the signal, or (2) extracting residuals from a general linear model (GLM) that accounts for task-evoked responses.
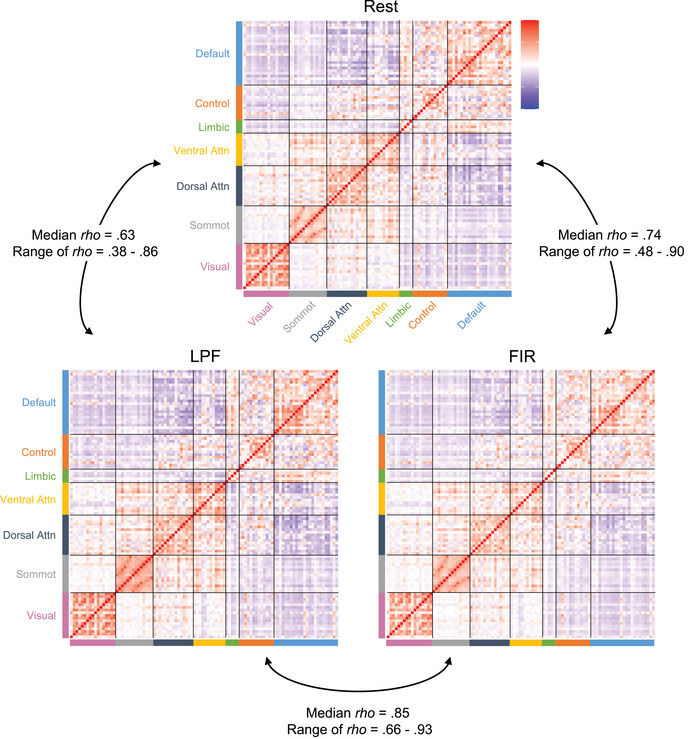
Result: We found that the organization of large-scale cortical networks and individual's idiosyncratic connectivity patterns are preserved during task-based fMRI. In contrast, individual differences in connection strength can vary more substantially between rest and task. Compared to low-pass filtering, background connectivity obtained from GLM residuals produced idiosyncratic connectivity patterns and individual differences in connection strength that more resembled rest. However, all background connectivity measures were highly similar when derived from the low-pass-filtered signal or GLM residuals, indicating that both methods are suitable for measuring background connectivity.
Conclusion: Together, our results highlight new avenues for the analysis of task-based fMRI datasets and the utility of each background connectivity method.
Keywords: background connectivity; connectivity fingerprint; individual differences; resting-state functional connectivity; task-based functional connectivity.
© 2023 The Authors. Brain and Behavior published by Wiley Periodicals LLC.
Conflict of interest statement
The authors declare no conflicts of interest.
Figures


Similar articles
-
The Functional Relevance of Task-State Functional Connectivity.J Neurosci. 2021 Mar 24;41(12):2684-2702. doi: 10.1523/JNEUROSCI.1713-20.2021. Epub 2021 Feb 4. J Neurosci. 2021. PMID: 33542083 Free PMC article.
-
A human brain atlas derived via n-cut parcellation of resting-state and task-based fMRI data.Magn Reson Imaging. 2016 Feb;34(2):209-18. doi: 10.1016/j.mri.2015.10.036. Epub 2015 Oct 31. Magn Reson Imaging. 2016. PMID: 26523655 Free PMC article.
-
Large-scale intrinsic connectivity is consistent across varying task demands.PLoS One. 2019 Apr 10;14(4):e0213861. doi: 10.1371/journal.pone.0213861. eCollection 2019. PLoS One. 2019. PMID: 30970031 Free PMC article.
-
Mapping cognitive and emotional networks in neurosurgical patients using resting-state functional magnetic resonance imaging.Neurosurg Focus. 2020 Feb 1;48(2):E9. doi: 10.3171/2019.11.FOCUS19773. Neurosurg Focus. 2020. PMID: 32006946 Free PMC article. Review.
-
The Prediction of Brain Activity from Connectivity: Advances and Applications.Neuroscientist. 2024 Jun;30(3):367-377. doi: 10.1177/10738584221130974. Epub 2022 Oct 17. Neuroscientist. 2024. PMID: 36250457 Free PMC article. Review.
Cited by
-
Patient-specific geometrical distortion corrections of MRI images improve dosimetric planning accuracy of vestibular schwannoma treated with gamma knife stereotactic radiosurgery.J Appl Clin Med Phys. 2023 Oct;24(10):e14072. doi: 10.1002/acm2.14072. Epub 2023 Jun 22. J Appl Clin Med Phys. 2023. PMID: 37345614 Free PMC article.
-
Balancing Data Quality and Bias: Investigating Functional Connectivity Exclusions in the Adolescent Brain Cognitive Development℠ (ABCD Study) Across Quality Control Pathways.Hum Brain Mapp. 2025 Jan;46(1):e70094. doi: 10.1002/hbm.70094. Hum Brain Mapp. 2025. PMID: 39788921 Free PMC article.
-
Age differences in functional connectivity and dedifferentiation of category representations.bioRxiv [Preprint]. 2025 Jun 24:2024.01.04.574135. doi: 10.1101/2024.01.04.574135. bioRxiv. 2025. PMID: 38260463 Free PMC article. Preprint.
References
-
- Al‐Aidroos, N. , Said, C. P. , & Turk‐Browne, N. B. (2012). Top‐down attention switches coupling between low‐level and high‐level areas of human visual cortex. Proceedings of the National Academy of Sciences of the United States of America, 109(36), 14675–14680. 10.1073/pnas.1202095109 - DOI - PMC - PubMed
-
- Clark, C. M. , Kessler, R. , Buchsbaum, M. S. , Margolin, R. A. , & Holcomb, H. H. (1984). Correlational methods for determining regional coupling of cerebral glucose metabolism: A pilot study. Biological Psychiatry, 19(5), 663–678. http://www.ncbi.nlm.nih.gov/pubmed/6610442 - PubMed
Publication types
MeSH terms
Grants and funding
LinkOut - more resources
Full Text Sources
