

A dual-task-embedded virtual reality system for intelligent quantitative assessment of cognitive processing speed
- PMID: 37063104
- PMCID: PMC10097903
- DOI: 10.3389/fnhum.2023.1158650
A dual-task-embedded virtual reality system for intelligent quantitative assessment of cognitive processing speed
Abstract
Introduction: Processing speed is defined as the ability to quickly process information, which is generally considered as one of the affected cognitive functions of multiple sclerosis and schizophrenia. Paper-pencil type tests are traditionally used in the assessment of processing speed. However, these tests generally need to be conducted under the guidance of clinicians in a specific environment, which limits their application in cognitive assessment or training in daily life. Therefore, this paper proposed an intelligent evaluation method of processing speed to assist clinicians in diagnosis.
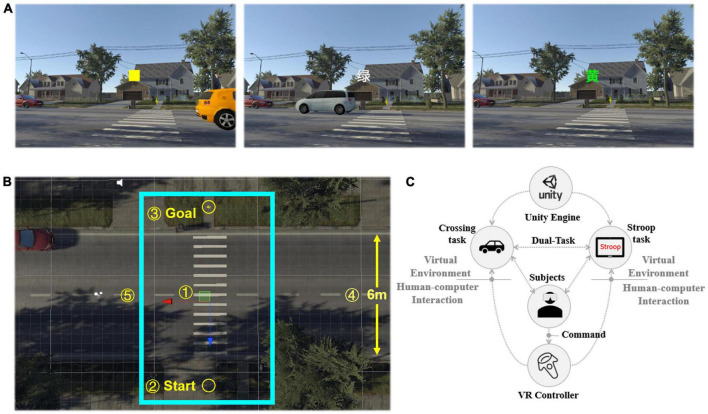
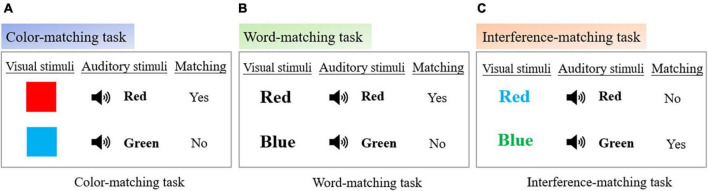
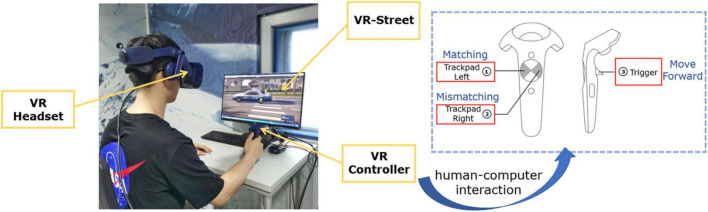
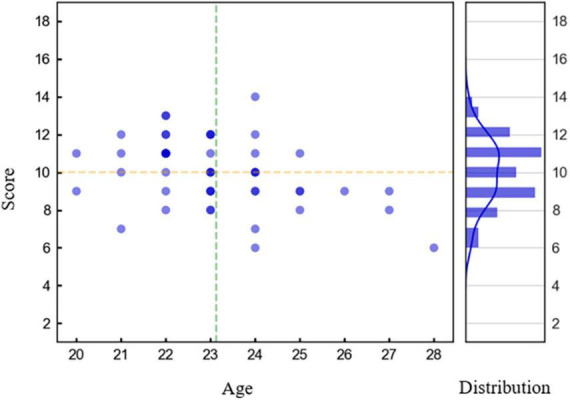
Methods: We created an immersive virtual street embedded with Stroop task (VR-Street). The behavior and performance information was obtained by performing the dual-task of street-crossing and Stroop, and a 50-participant dataset was established with the label of standard scale. Utilizing Pearson correlation coefficient to find the relationship between the dual-task features and the cognitive test results, and an intelligent evaluation model was developed using machine learning.
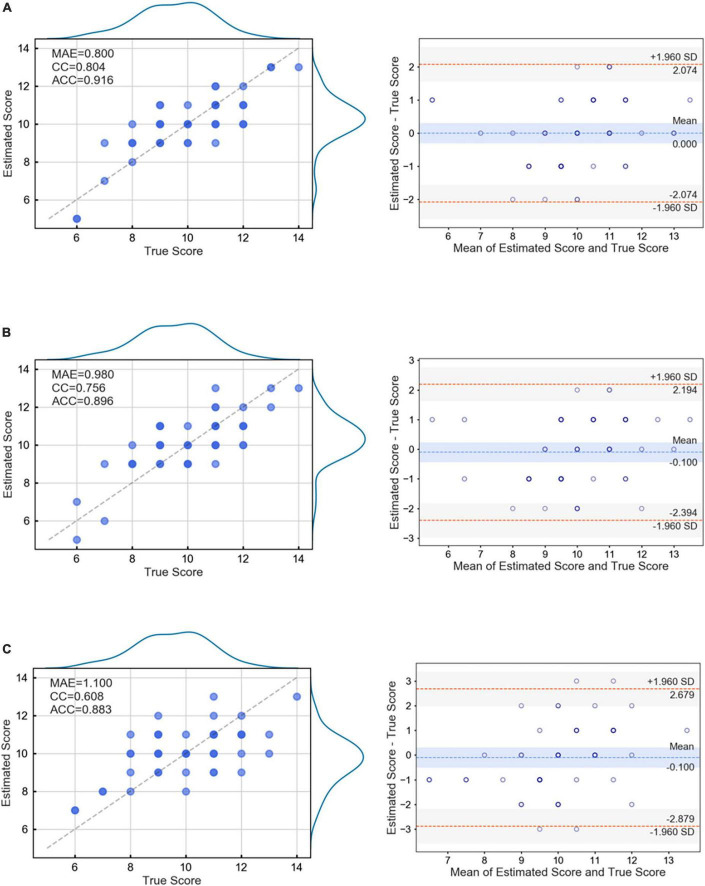
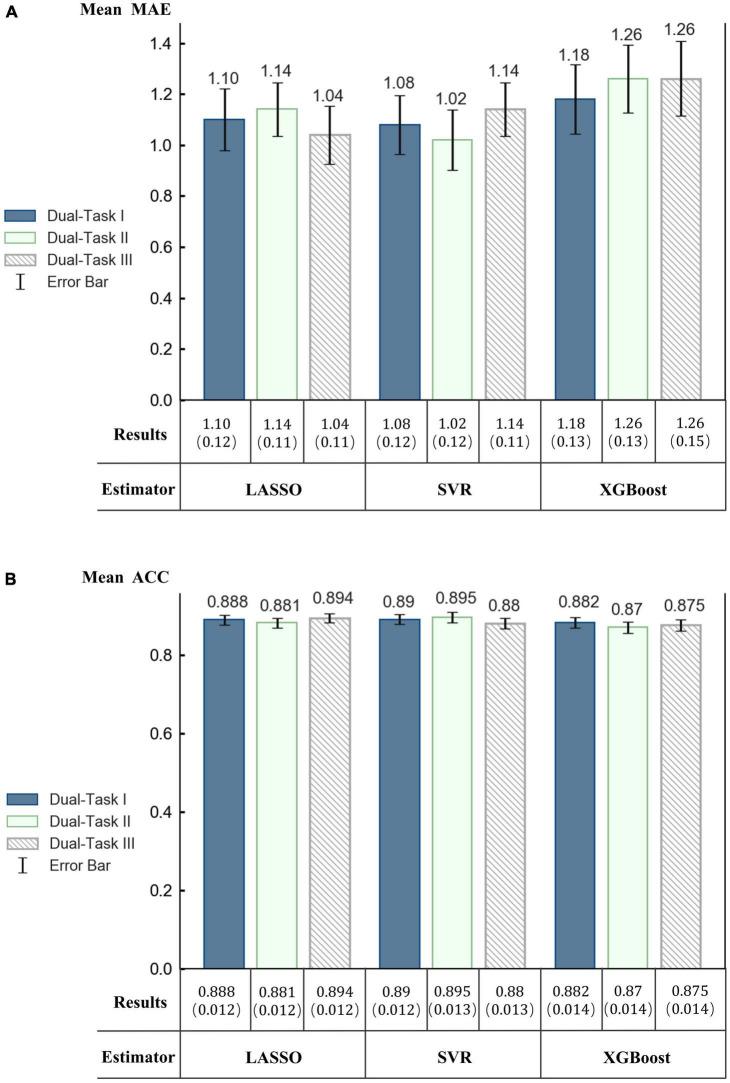
Results: Statistical analysis showed that all Stroop task features were correlated with cognitive test results, and some behavior features also showed correlation. The estimated results showed that the proposed method can estimate the processing speed score with an adequate accuracy (mean absolute error of 0.800, relative accuracy of 0.916 and correlation coefficient of 0.804). The combination of Stroop features and behavior features showed better performance than single task features.
Discussion: The results of this work indicates that the dual-task design in this study better mobilizes participants' attention and cognitive resources, and more fully reflects participants' cognitive processing speed. The proposed method provides a new opportunity for accurate quantitative evaluation of cognitive function through virtual reality.
Keywords: behavior data; cognitive processing speed; dual-task; evaluation; machine learning; virtual reality.
Copyright © 2023 Zhou, Zhao, Xiang, Yan, Shu, Xu, Zhang and Tian.
Conflict of interest statement
The authors declare that the research was conducted in the absence of any commercial or financial relationships that could be construed as a potential conflict of interest.
Figures


Similar articles
-
Effects of Virtual Reality-Based Physical and Cognitive Training on Executive Function and Dual-Task Gait Performance in Older Adults With Mild Cognitive Impairment: A Randomized Control Trial.Front Aging Neurosci. 2019 Jul 16;11:162. doi: 10.3389/fnagi.2019.00162. eCollection 2019. Front Aging Neurosci. 2019. PMID: 31379553 Free PMC article.
-
A multi-modal virtual reality treadmill intervention for enhancing mobility and cognitive function in people with multiple sclerosis: Protocol for a randomized controlled trial.Contemp Clin Trials. 2020 Oct;97:106122. doi: 10.1016/j.cct.2020.106122. Epub 2020 Aug 26. Contemp Clin Trials. 2020. PMID: 32858229
-
A Virtual-Reality System Integrated With Neuro-Behavior Sensing for Attention-Deficit/Hyperactivity Disorder Intelligent Assessment.IEEE Trans Neural Syst Rehabil Eng. 2020 Sep;28(9):1899-1907. doi: 10.1109/TNSRE.2020.3004545. Epub 2020 Jun 24. IEEE Trans Neural Syst Rehabil Eng. 2020. PMID: 32746303
-
Virtual reality simulation training for health professions trainees in gastrointestinal endoscopy.Cochrane Database Syst Rev. 2018 Aug 17;8(8):CD008237. doi: 10.1002/14651858.CD008237.pub3. Cochrane Database Syst Rev. 2018. PMID: 30117156 Free PMC article.
-
Ecological assessment of divided attention: What about the current tools and the relevancy of virtual reality.Rev Neurol (Paris). 2016 Apr-May;172(4-5):270-80. doi: 10.1016/j.neurol.2016.01.399. Epub 2016 Apr 20. Rev Neurol (Paris). 2016. PMID: 27108241 Review.
References
-
- Acta Psychologica Sinica, (2001). The construction of “basic cognitive capacity test” and its standardization. Acta Psychol. Sin. 33 453–460.
-
- Bodling A. M., Denney D. R., Lynch S. G. (2009). Cognitive aging in patients with multiple sclerosis: A cross-sectional analysis of speeded processing. Arch. Clin. Neuropsychol. 24 761–767. - PubMed
LinkOut - more resources
Full Text Sources
Medical