

Optical control of neuronal activities with photoswitchable nanovesicles
- PMID: 37063114
- PMCID: PMC10103898
- DOI: 10.1007/s12274-022-4853-x
Optical control of neuronal activities with photoswitchable nanovesicles
Abstract
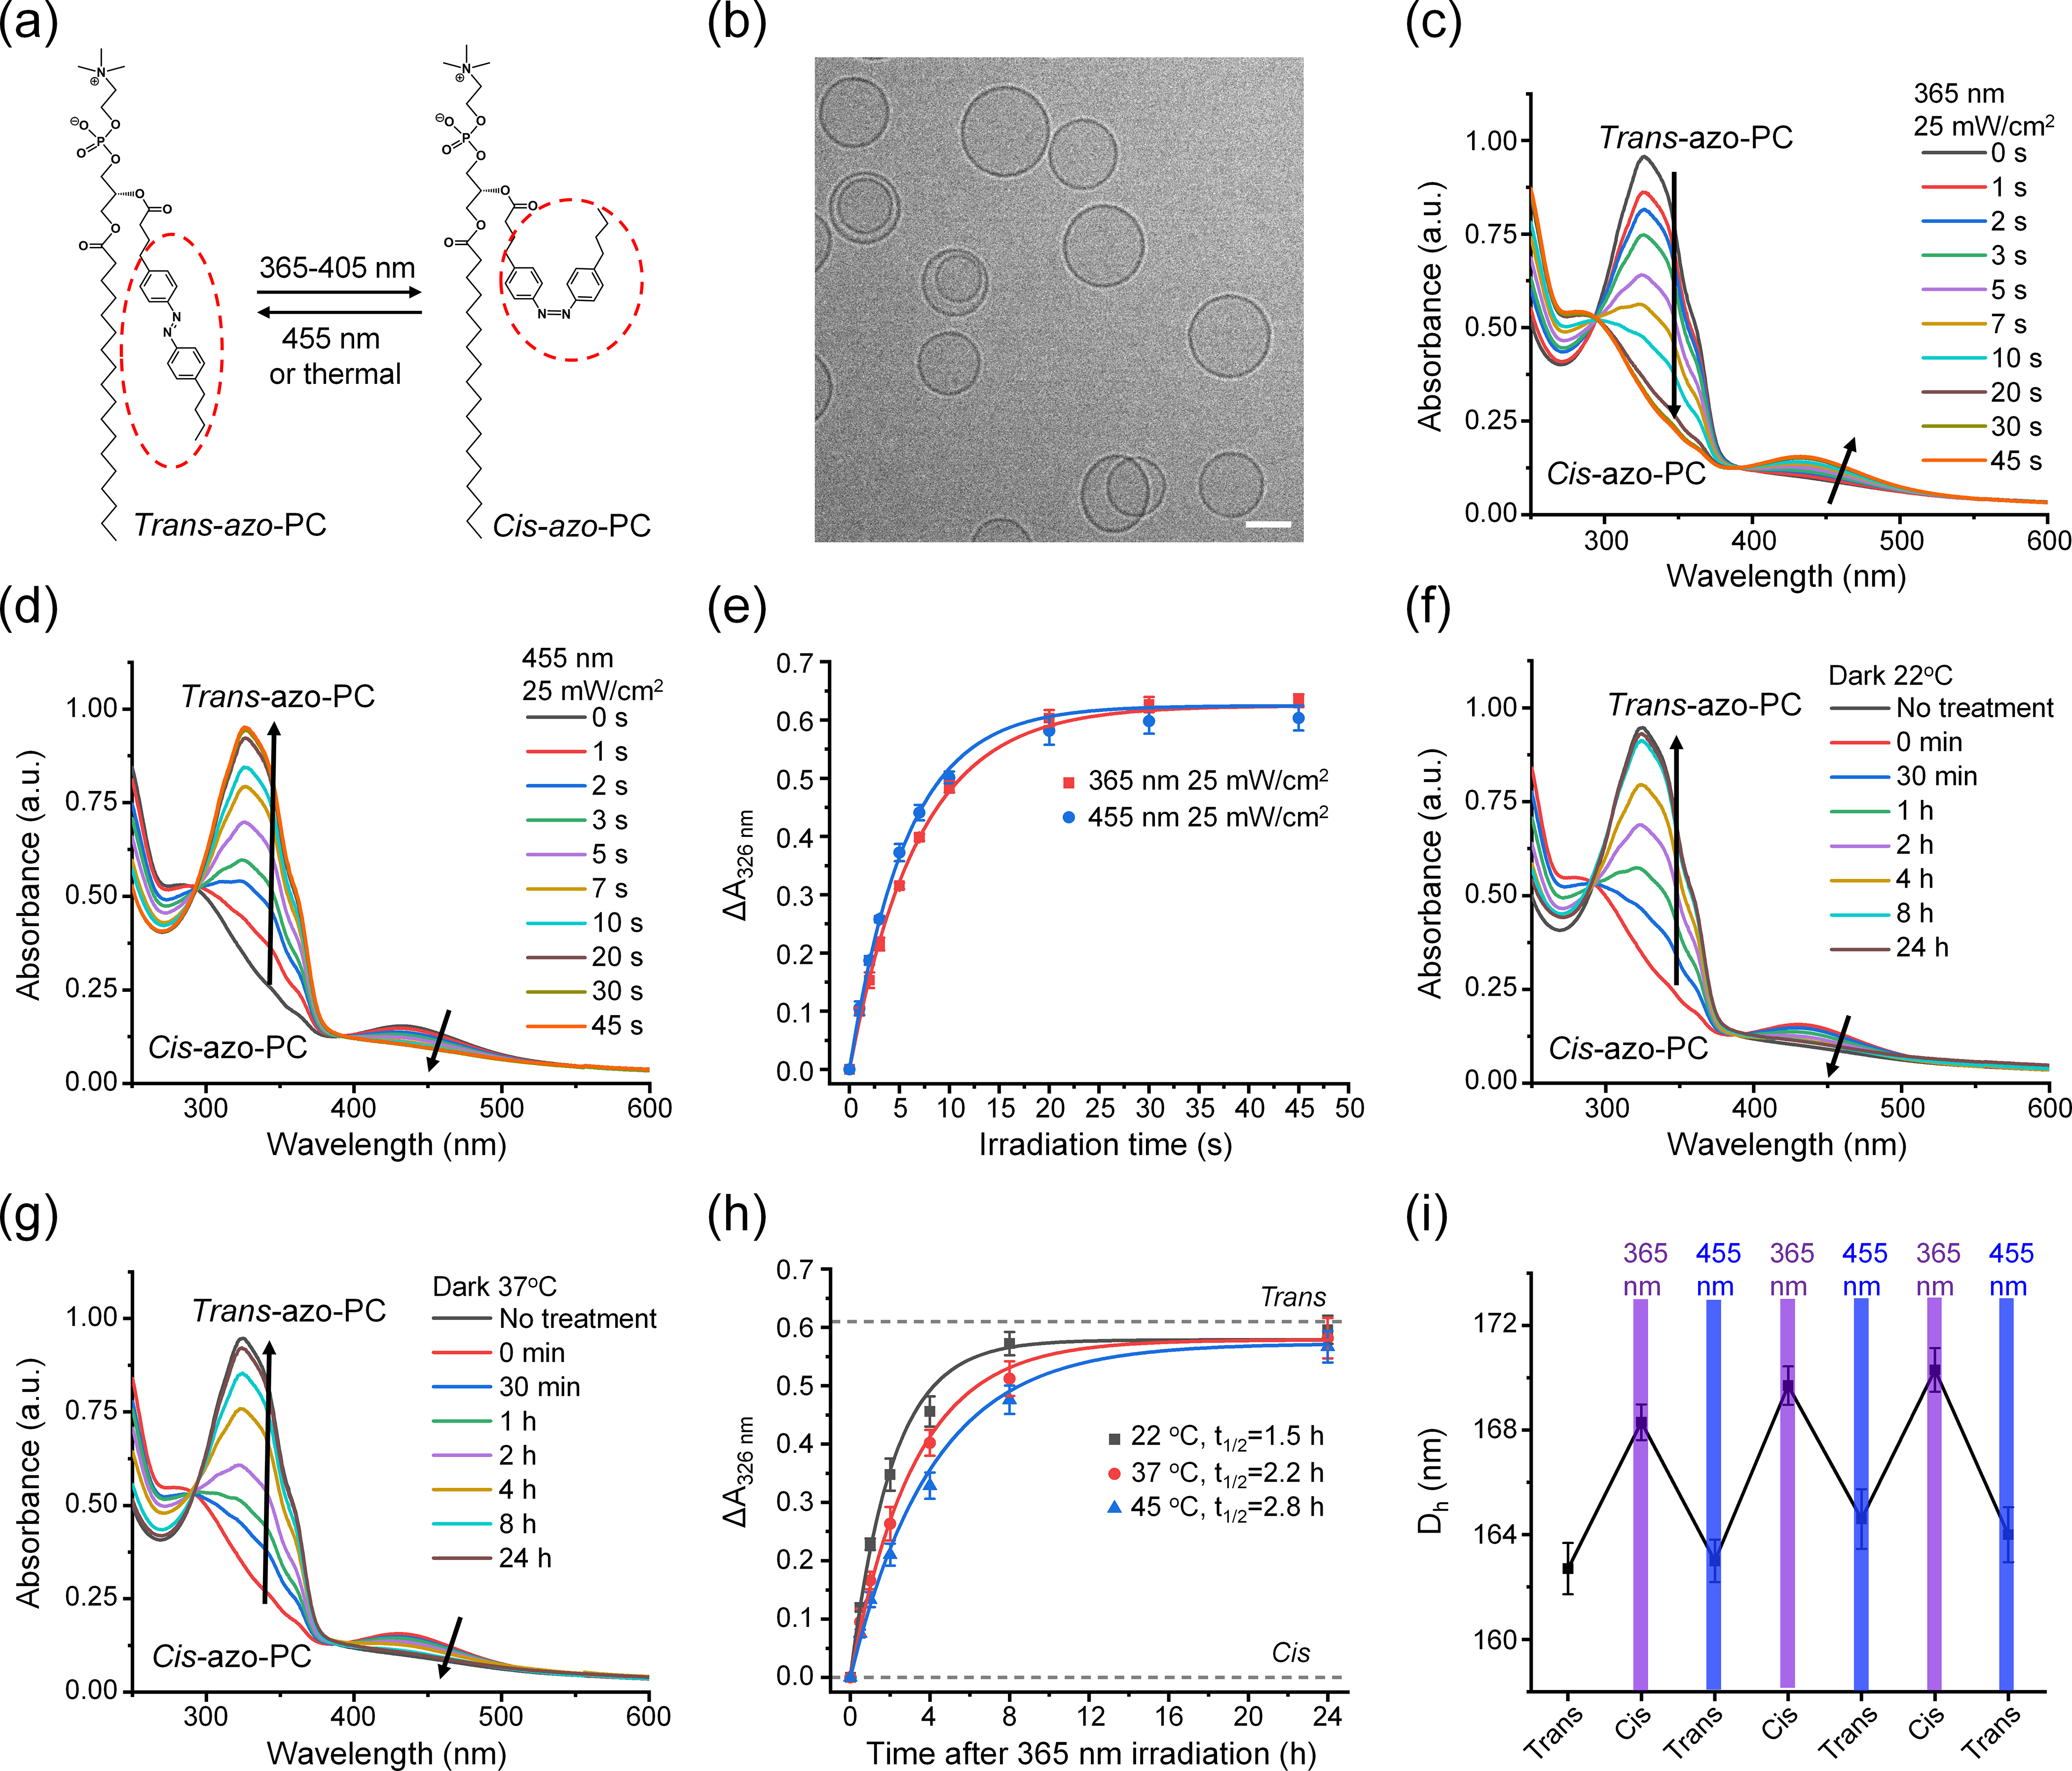
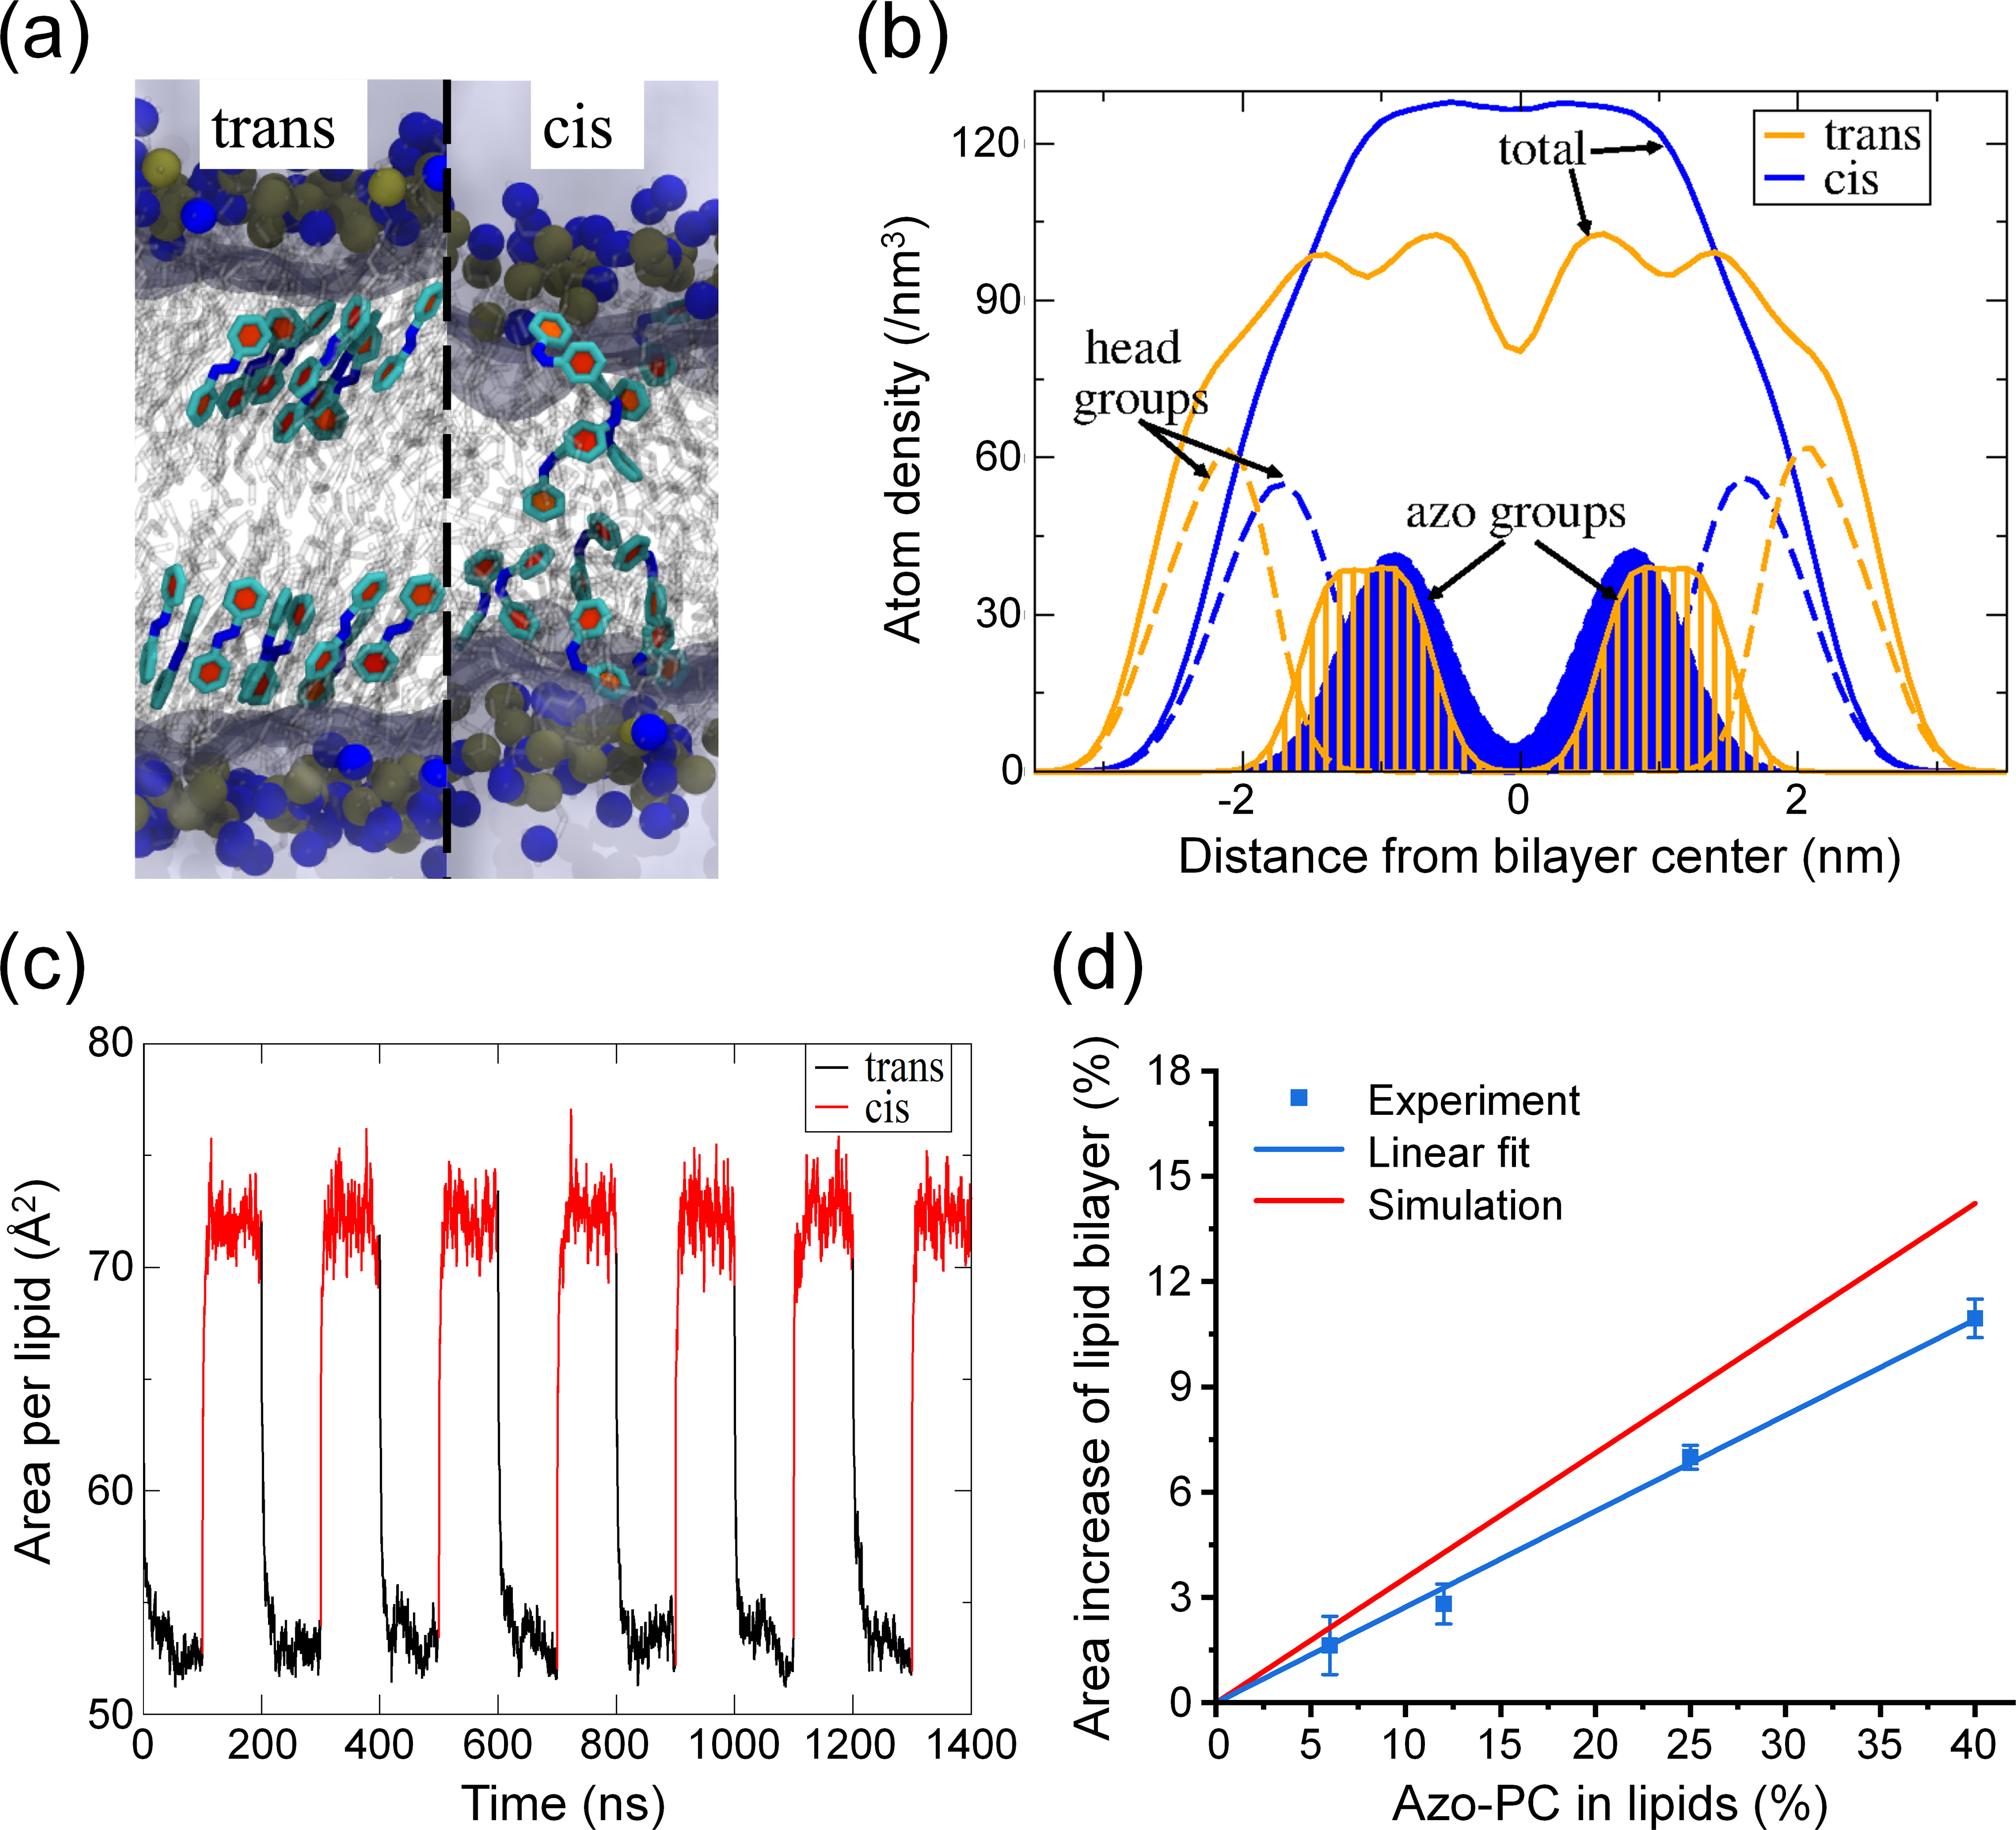
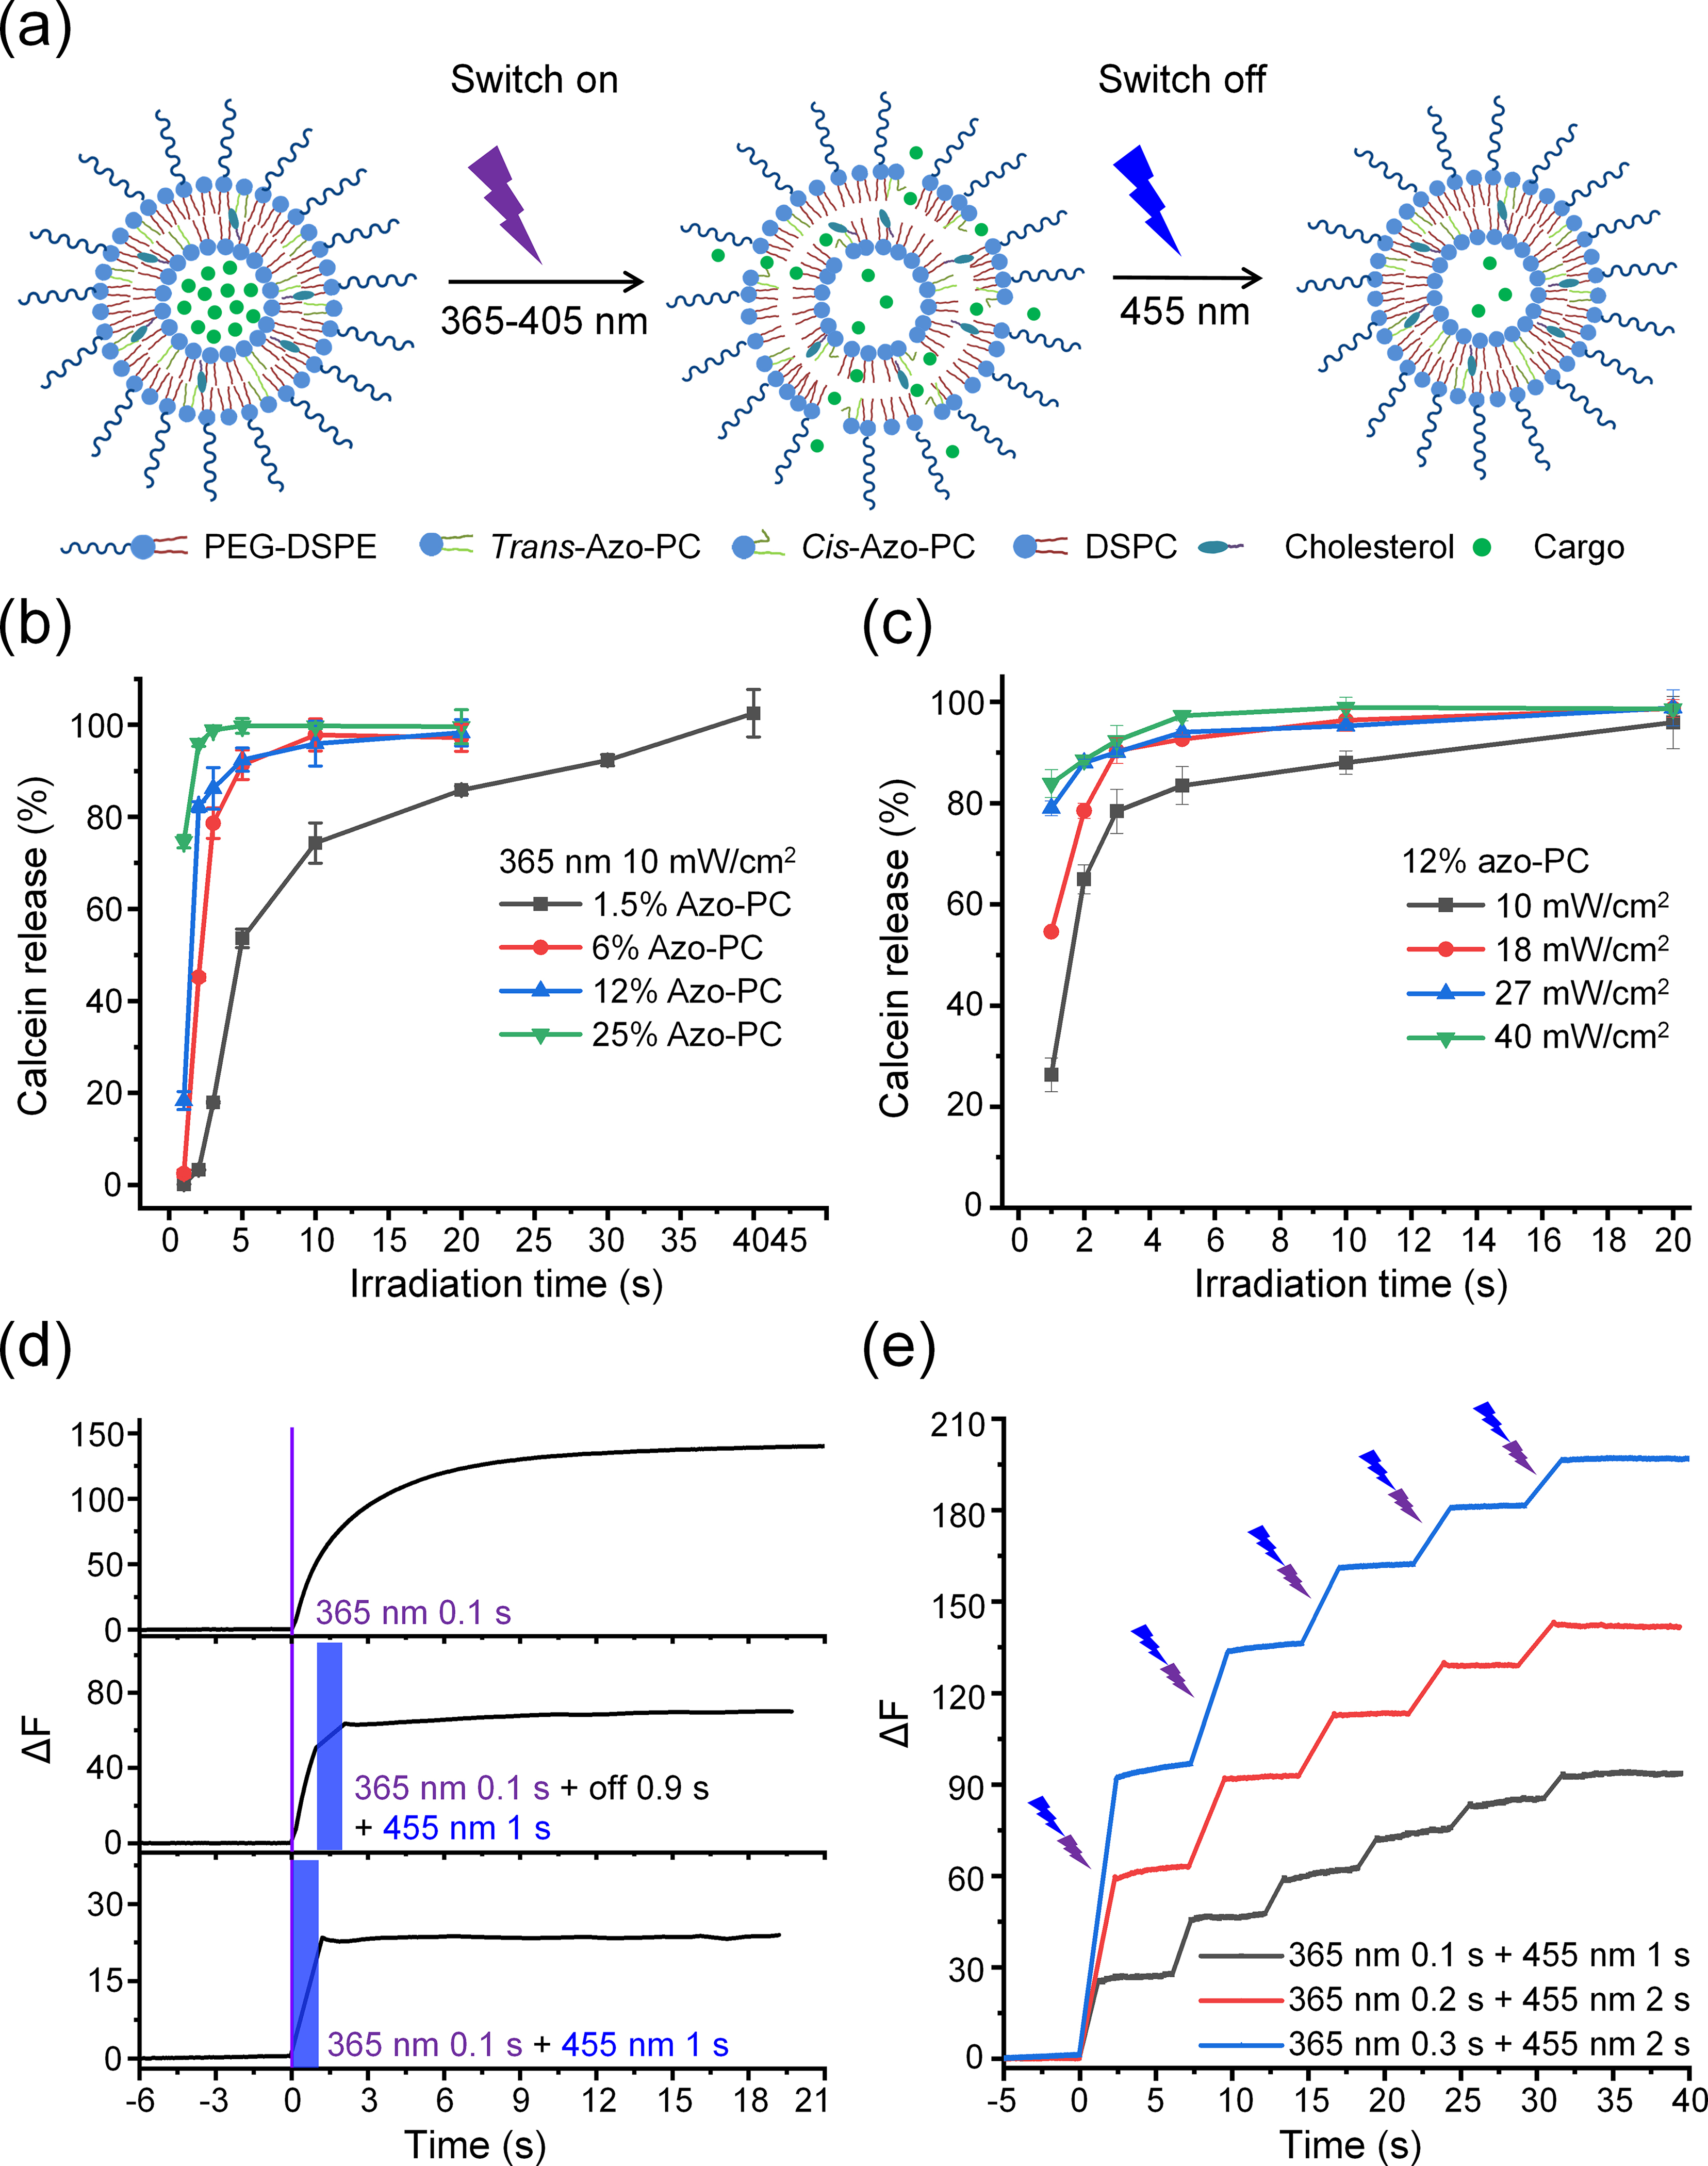
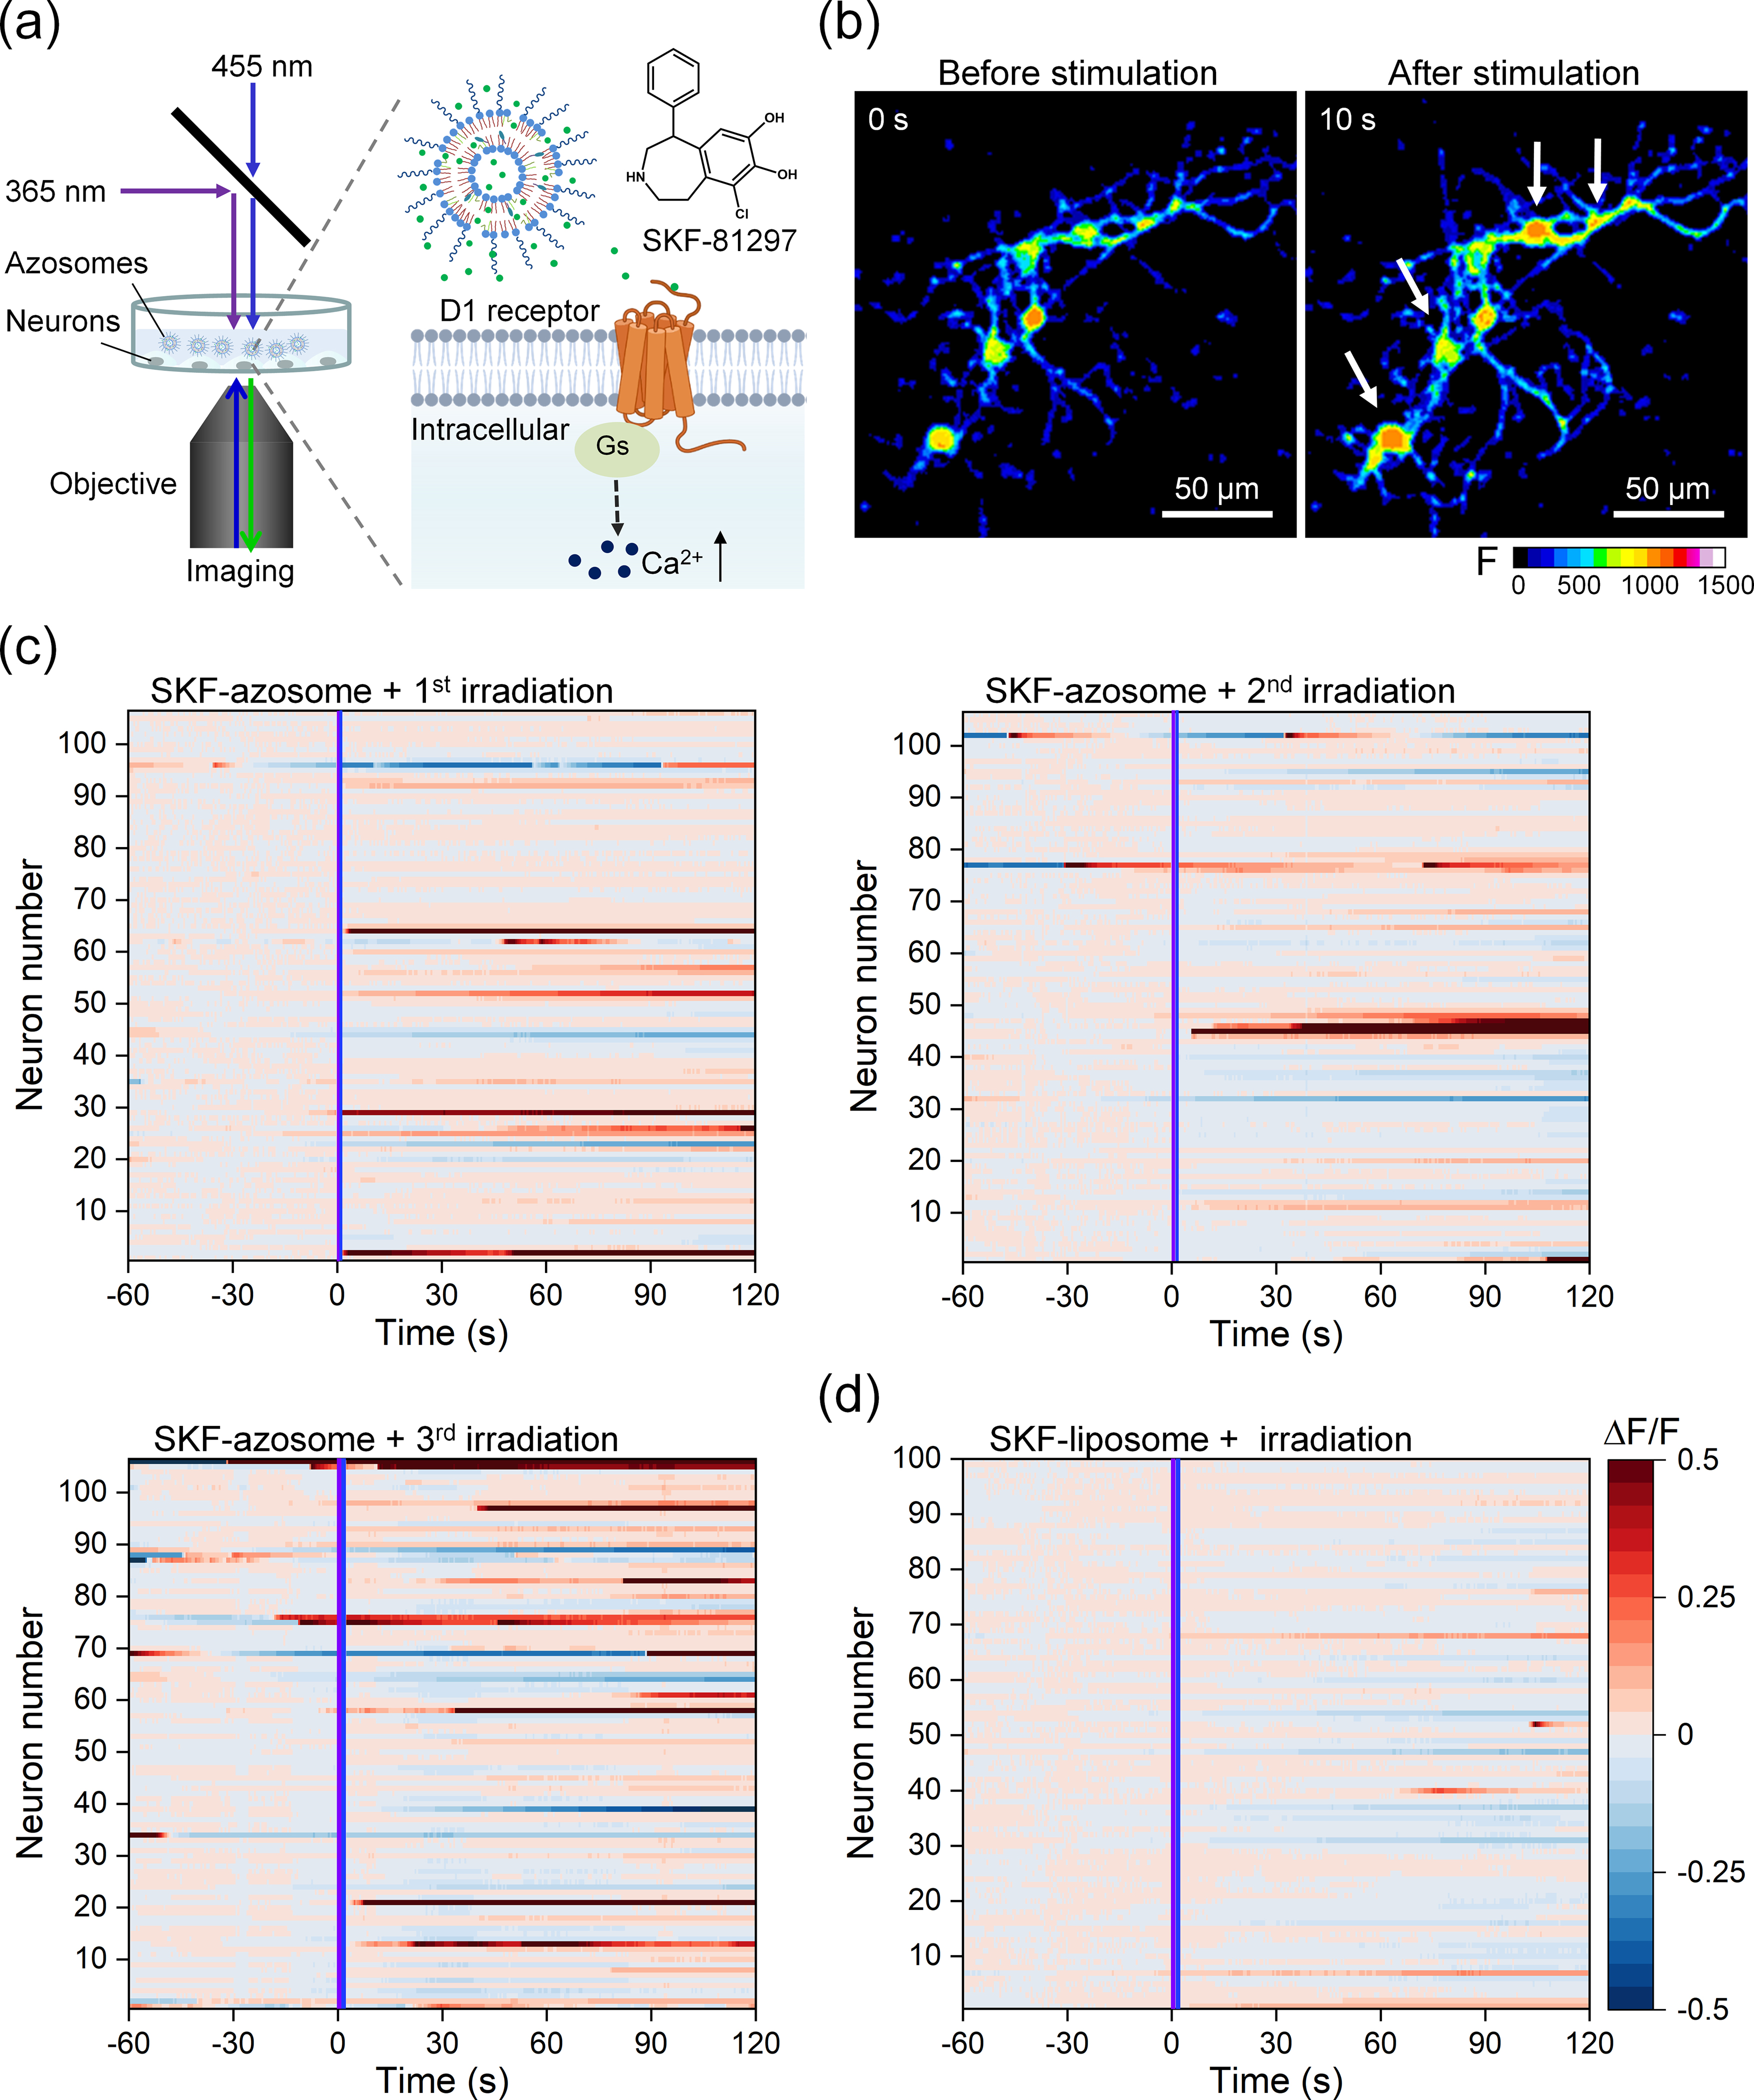
Precise modulation of neuronal activity by neuroactive molecules is essential for understanding brain circuits and behavior. However, tools for highly controllable molecular release are lacking. Here, we developed a photoswitchable nanovesicle with azobenzene-containing phosphatidylcholine (azo-PC), coined 'azosome', for neuromodulation. Irradiation with 365 nm light triggers the trans-to-cis isomerization of azo-PC, resulting in a disordered lipid bilayer with decreased thickness and cargo release. Irradiation with 455 nm light induces reverse isomerization and switches the release off. Real-time fluorescence imaging shows controllable and repeatable cargo release within seconds (< 3 s). Importantly, we demonstrate that SKF-81297, a dopamine D1-receptor agonist, can be repeatedly released from the azosome to activate cultures of primary striatal neurons. Azosome shows promise for precise optical control over the molecular release and can be a valuable tool for molecular neuroscience studies.
Keywords: azobenzene; controlled release; liposome; neuromodulation; photoswitch.
Figures
Similar articles
-
Isomerization reactions on single adsorbed molecules.Acc Chem Res. 2009 Feb 17;42(2):213-23. doi: 10.1021/ar800021q. Acc Chem Res. 2009. PMID: 19138111
-
Optical Membrane Control with Red Light Enabled by Red-Shifted Photolipids.Langmuir. 2022 Jan 11;38(1):385-393. doi: 10.1021/acs.langmuir.1c02745. Epub 2021 Dec 31. Langmuir. 2022. PMID: 34969246
-
Triggered azobenzene-based prodrugs and drug delivery systems.J Control Release. 2022 May;345:475-493. doi: 10.1016/j.jconrel.2022.03.041. Epub 2022 Mar 23. J Control Release. 2022. PMID: 35339578 Review.
-
A Lipid Photoswitch Controls Fluidity in Supported Bilayer Membranes.Langmuir. 2020 Mar 17;36(10):2629-2634. doi: 10.1021/acs.langmuir.9b02942. Epub 2020 Mar 3. Langmuir. 2020. PMID: 32069411
-
Azobenzene Photoswitch for Isomerization-Dependent Cancer Therapy via Azo-Combretastatin A4 and Phototrexate.Photochem Photobiol. 2020 Nov;96(6):1163-1168. doi: 10.1111/php.13292. Epub 2020 Jul 6. Photochem Photobiol. 2020. PMID: 32521572 Review.
Cited by
-
Light-Switchable Membrane Permeability in Giant Unilamellar Vesicles.Pharmaceutics. 2022 Dec 12;14(12):2777. doi: 10.3390/pharmaceutics14122777. Pharmaceutics. 2022. PMID: 36559270 Free PMC article.
-
Understanding Neuropeptide Transmission in the Brain by Optical Uncaging and Release.ACS Chem Neurosci. 2023 Feb 15;14(4):516-523. doi: 10.1021/acschemneuro.2c00684. Epub 2023 Jan 31. ACS Chem Neurosci. 2023. PMID: 36719384 Free PMC article. Review.
-
Photoswitchable phospholipids for the optical control of membrane processes, protein function, and drug delivery.Commun Mater. 2025;6(1):59. doi: 10.1038/s43246-025-00773-8. Epub 2025 Apr 1. Commun Mater. 2025. PMID: 40182703 Free PMC article. Review.
-
Photocatalytic manipulation of Ca2+ signaling for regulating cellular and animal behaviors via MOF-enabled H2O2 generation.Sci Adv. 2024 Apr 19;10(16):eadl0263. doi: 10.1126/sciadv.adl0263. Epub 2024 Apr 19. Sci Adv. 2024. PMID: 38640246 Free PMC article.
-
Nanotechnology-Fortified Manipulation of Cell Ca2+ Signaling.Small Sci. 2024 Jun 26;4(10):2400169. doi: 10.1002/smsc.202400169. eCollection 2024 Oct. Small Sci. 2024. PMID: 40212247 Free PMC article.
References
-
- Feiner R; Dvir T Tissue-electronics interfaces: from implantable devices to engineered tissues. Nat. Rev. Mater. 2017, 3, 1–16.
Grants and funding
LinkOut - more resources
Full Text Sources