Calcium dynamics and modulation in carrot somatic embryogenesis
- PMID: 37063186
- PMCID: PMC10102378
- DOI: 10.3389/fpls.2023.1150198
Calcium dynamics and modulation in carrot somatic embryogenesis
Abstract
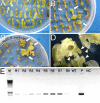
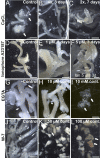
Free calcium (Ca2+) is a pivotal player in different in vivo and in vitro morphogenic processes. In the induction of somatic embryogenesis, its role has been demonstrated in different species. In carrot, however, this role has been more controversial. In this work, we developed carrot lines expressing cameleon Ca2+ sensors. With them, Ca2+ levels and distribution in the different embryogenic structures formed during the induction and development of somatic embryos were analyzed by FRET. We also used different chemicals to modulate intracellular Ca2+ levels (CaCl2, ionophore A23187, EGTA), to inhibit calmodulin (W-7) and to inhibit callose synthesis (2-deoxy-D-glucose) at different times, principally during the first stages of embryo induction. Our results showed that high Ca2+ levels and the development of a callose layer are markers of cells induced to embryogenesis, which are the precursors of somatic embryos. Disorganized calli and embryogenic masses have different Ca2+ patterns associated to their embryogenic competence, with higher levels in embryogenic cells than in callus cells. The efficiency of somatic embryogenesis in carrot can be effectively modulated by allowing, within a range, more Ca2+ to enter the cell to act as a second messenger to trigger embryogenesis induction. Once induced, Ca2+-calmodulin signaling seems related with the transcriptional remodeling needed for embryo progression, and alterations of Ca2+ or calmodulin levels negatively affect the efficiency of the process.
Keywords: DAUCUS carota; EGTA; FRET; W-7; callose; in vitro culture; ionophore A23187; morphogenesis.
Copyright © 2023 Calabuig-Serna, Mir, Arjona and Seguí-Simarro.
Conflict of interest statement
The authors declare that this research was conducted in the absence of any commercial or financial relationships that could be construed as a potential conflict of interest.
Figures


Similar articles
-
Calcium levels modulate embryo yield in Brassica napus microspore embryogenesis.Front Plant Sci. 2025 Jan 16;15:1512500. doi: 10.3389/fpls.2024.1512500. eCollection 2024. Front Plant Sci. 2025. PMID: 39886677 Free PMC article.
-
Calcium Dynamics, WUSCHEL Expression and Callose Deposition during Somatic Embryogenesis in Arabidopsis thaliana Immature Zygotic Embryos.Plants (Basel). 2023 Feb 23;12(5):1021. doi: 10.3390/plants12051021. Plants (Basel). 2023. PMID: 36903882 Free PMC article.
-
[Role of exogenous Ca2+ in the somatic embryogenesis of Lycium barbarum L].Zhi Wu Sheng Li Yu Fen Zi Sheng Wu Xue Xue Bao. 2004 Jun;30(3):261-8. Zhi Wu Sheng Li Yu Fen Zi Sheng Wu Xue Xue Bao. 2004. PMID: 15599021 Chinese.
-
Addition of ionophore A23187 increases the efficiency of Cocos nucifera somatic embryogenesis.3 Biotech. 2018 Aug;8(8):366. doi: 10.1007/s13205-018-1392-y. Epub 2018 Aug 10. 3 Biotech. 2018. PMID: 30105191 Free PMC article.
-
Apoplastic and Symplasmic Markers of Somatic Embryogenesis.Plants (Basel). 2023 May 11;12(10):1951. doi: 10.3390/plants12101951. Plants (Basel). 2023. PMID: 37653868 Free PMC article. Review.
Cited by
-
Small molecules, enormous functions: potential approach for overcoming bottlenecks in embryogenic tissue induction and maintenance in conifers.Hortic Res. 2024 Jul 10;11(8):uhae180. doi: 10.1093/hr/uhae180. eCollection 2024 Aug. Hortic Res. 2024. PMID: 39108576 Free PMC article. Review.
-
Characterisation and Expression Analysis of LdSERK1, a Somatic Embryogenesis Gene in Lilium davidii var. unicolor.Plants (Basel). 2024 May 29;13(11):1495. doi: 10.3390/plants13111495. Plants (Basel). 2024. PMID: 38891306 Free PMC article.
-
Calcium levels modulate embryo yield in Brassica napus microspore embryogenesis.Front Plant Sci. 2025 Jan 16;15:1512500. doi: 10.3389/fpls.2024.1512500. eCollection 2024. Front Plant Sci. 2025. PMID: 39886677 Free PMC article.
-
Involvement of 5mC DNA demethylation via 5-aza-2'-deoxycytidine in regulating gene expression during early somatic embryo development in white spruce (Picea glauca).For Res (Fayettev). 2023 Dec 26;3:30. doi: 10.48130/fr-0023-0030. eCollection 2023. For Res (Fayettev). 2023. PMID: 39526256 Free PMC article.
References
LinkOut - more resources
Full Text Sources
Miscellaneous

