. 2023 Mar 31:14:1172275.
doi: 10.3389/fpls.2023.1172275. eCollection 2023.

Peptide chain release factor DIG8 regulates plant growth by affecting ROS-mediated sugar transportation in Arabidopsis thaliana

Affiliations

Peptide chain release factor DIG8 regulates plant growth by affecting ROS-mediated sugar transportation in Arabidopsis thaliana

Xiangxiang Zhang et al. Front Plant Sci. .

Abstract

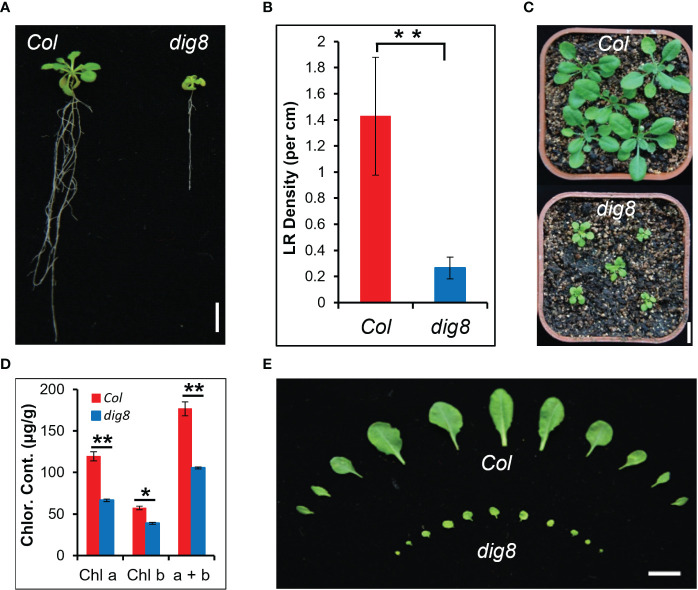
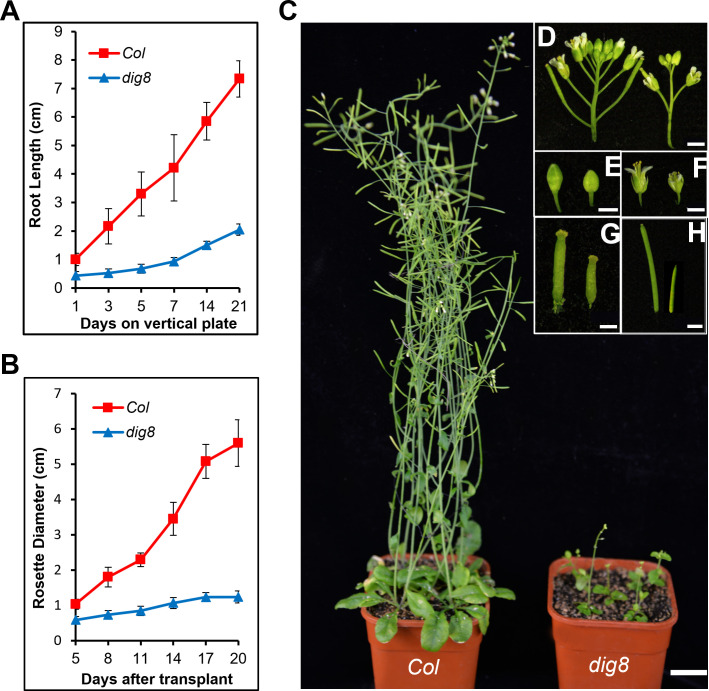
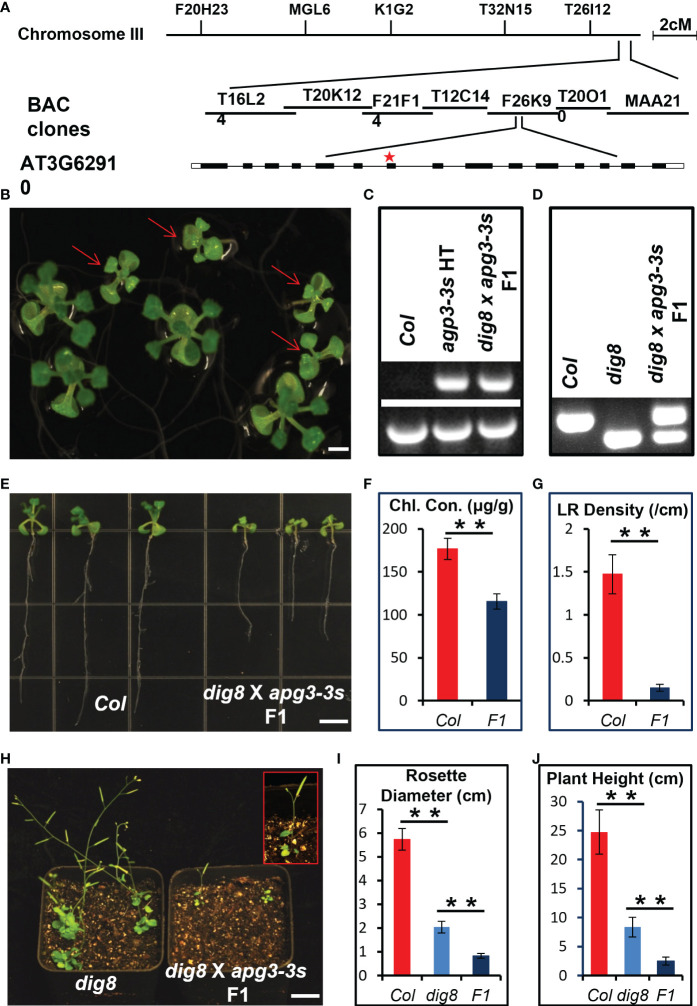
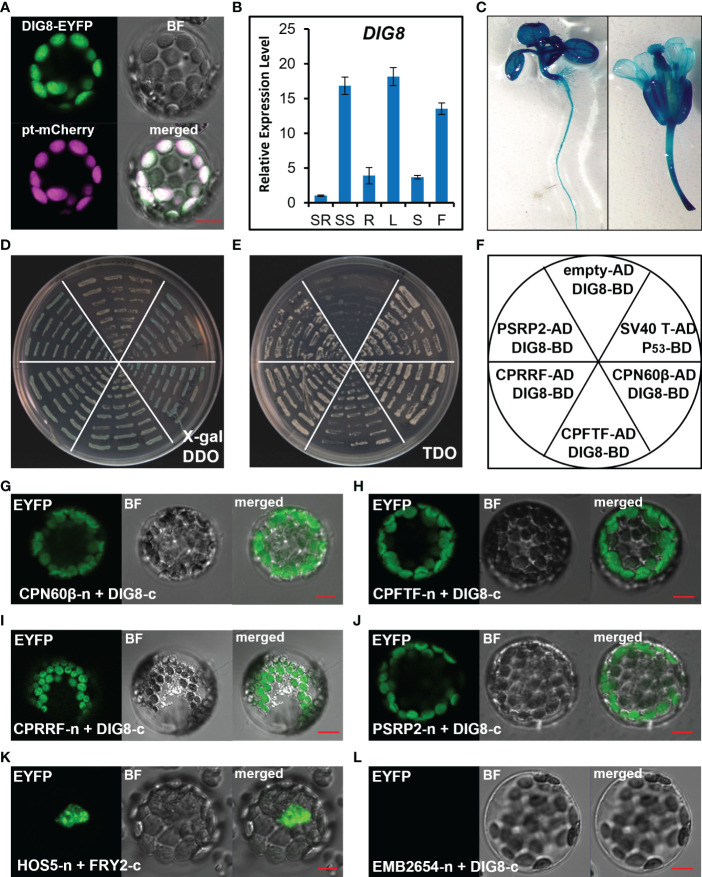
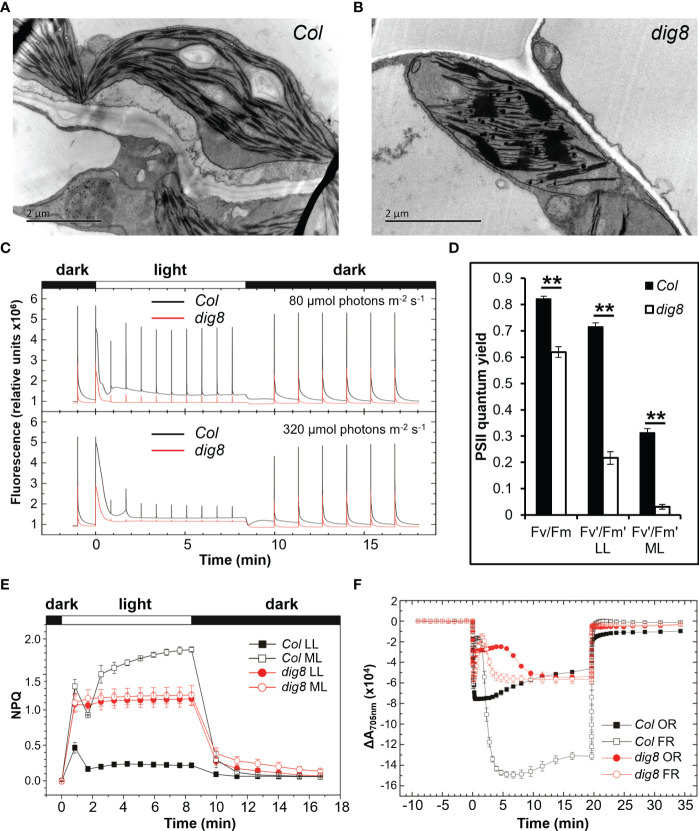
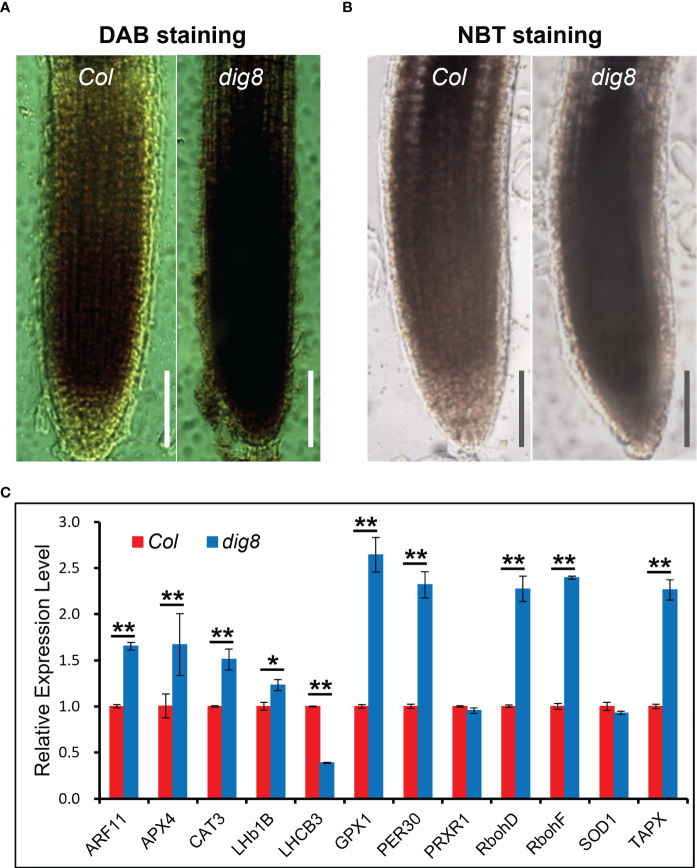
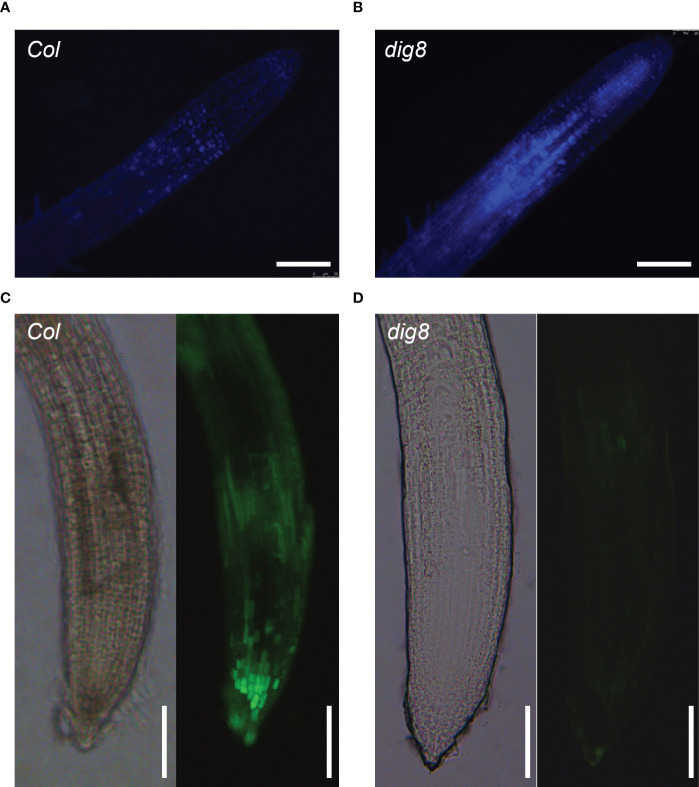
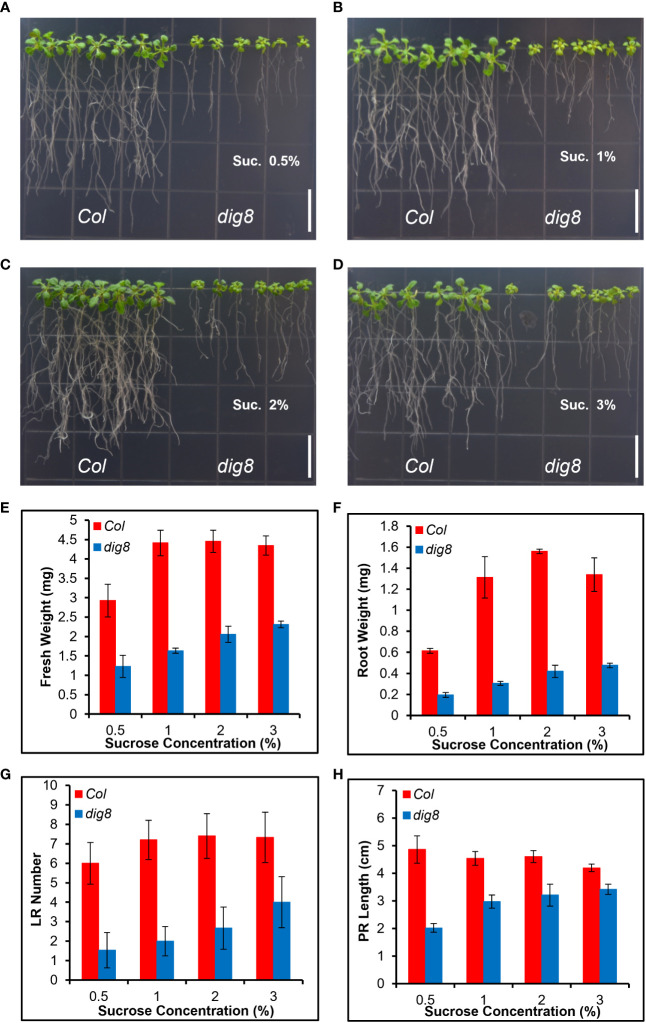
Chloroplasts have important roles in photosynthesis, stress sensing and retrograde signaling. However, the relationship between chloroplast peptide chain release factor and ROS-mediated plant growth is still unclear. In the present study, we obtained a loss-of-function mutant dig8 by EMS mutation. The dig8 mutant has few lateral roots and a pale green leaf phenotype. By map-based cloning, the DIG8 gene was located on AT3G62910, with a point mutation leading to amino acid substitution in functional release factor domain. Using yeast-two-hybrid and BiFC, we confirmed DIG8 protein was characterized locating in chloroplast by co-localization with plastid marker and interacting with ribosome-related proteins. Through observing by transmission electron microscopy, quantifying ROS content and measuring the transport efficiency of plasmodesmata in dig8 mutant, we found that abnormal thylakoid stack formation and chloroplast dysfunction in the dig8 mutant caused increased ROS activity leading to callose deposition and lower PD permeability. A local sugar supplement partially alleviated the growth retardation phenotype of the mutant. These findings shed light on chloroplast peptide chain release factor-affected plant growth by ROS stress.

Keywords: ROS; callose; chloroplast; peptide chain release factor; sugar transportation.


Conflict of interest statement

The authors declare that the research was conducted in the absence of any commercial or financial relationships that could be construed as a potential conflict of interest.

Figures

Figure 1
Figure 1
Identification of the dig8 mutant. (A), The dig8 mutant has fewer lateral roots. Scale bar, 1 cm. (B), Lateral root (LR) density in the dig8 mutant and Col. Error bars represent SD (n=30). **P < 0.01 (Student’s t test). (C), Morphology of Col and dig8 seedlings in soil. Scale bar, 1 cm. (D), Chlorophyll contents in Col and dig8 mutant. Shown are means of chlorophyll a, chlorophyll b and their total contents. Error bars represent SD from three replicates. *P < 0.05 and **P < 0.01 (Student’s t test). (E), Comparison of the rosette leaves at transition from the vegetative to the reproductive stage. Scale Bar, 1 cm.
Figure 2
Figure 2
Retarded growth of the dig8 mutant. (A), Root growth rates of Col and dig8 mutant on a vertical plate. 10-day-old seedlings were transferred to a vertically placed plate and root length was recorded daily for 3 weeks. Error bars represent SD (n=20). (B), Growth rate measured daily by rosette diameters. Error bars represent SD (n=20). (C), Phenotypes of Col and dig8 mutant adult plants. Scale bar, 2 cm. (D–H), Enlarged view of flowers and siliques of Col (on the left) and dig8 mutant (on the right). (D), inflorescences; (E), flower buds; (F), pollinated flowers; (G), developing siliques; (H), siliques. Scale bars, 0.2 cm.
Figure 3
Figure 3
Mapping and allelic verification of DIG8. (A), Map-based cloning of the DIG8 locus. The dig8 mutant was crossed with the Ler ecotype and the F2 population was used for mapping. DIG8 was localized on Chromosome 3. Schematic structure of the DIG8 gene (AT3G62910); black boxes, exons; white boxes, UTRs; lines, introns; star, dig8 mutation site. (B), Allelic verification of DIG8 gene. Then dig8 mutant was crossed with an apg3-3s heterozygote. F1 seedlings on MS medium showed segregation ratio of 1 normal: 1 defective (arrows) seedling as expected for allelic mutations. Scale bars, 0.2 cm. (C), PCR verification of T-DNA insertion in the apg3-3s mutant allele. Lower bands were generated by PCR using primers LP and RP; upper bands by PCR using primers LB and RP. (D), dCAPS verification of dig8 mutant site. The BglII site was designed in reverse primer for dig8 mutant site. PCR products were digested with BglII to verify the point mutation in dig8 mutant. (E), Lateral root and pale green phenotypes of dig8 x apg3-3s F1 seedlings compared to Col. (F), Total chlorophyll contents in Col and dig8 x apg3-3s F1 seedlings. Error bars represent SD from three independent replicates. (G), Lateral root (LR) densities of Col and F1 mutant seedlings. Error bars represent SD (n=20). Scale bars, 0.5 cm. (H), Comparison of dig8 x apg3-3s F1 with dig8 mutant. Enlarged view of a dig8 x apg3-3s F1 plant in red rectangle showing 3 rosette leaves and 1 silique at the reproductive stage. Scale bars, 1 cm. I and J, Comparisons of rosette width (I) and plant height (J) of Col, dig8 and dig8 x apg3-3s F1 seedlings. Error bars represent SD (n=20). Asterisks indicate a significant difference between the indicated samples (t-test, **P < 0.01).
Figure 4
Figure 4
Characterization of the DIG8 protein. (A), DIG8 co-localized with a plastid marker. A DIG8-EYFP construct was co-transformed with plastid-localized marker pt-mCherry in protoplasts. The fluorescence signals were detected by confocal microscopy. BF, bright field. (B), qRT-PCR analysis of DIG8 expression. SR, seedling root; SS, seedling shoot; R, root; L, leaf; S, stem; F, flower. ACT2 was used as the internal control in qRT-PCR assays. Error bars represent the standard deviations (n=3). (C), DIG8 promoter-driven GUS expression. Transgenic plants expressing GUS under control of the DIG8 promoter were stained with X-Gluc and imaged under a microscope. (D–F), Confirmation of interactions between DIG8 and predicted DIG8- interacting proteins in the yeast 2-hybrid system. DIG8 was subcloned into the BD vector. CPN60β, CPFTF, CPRRF, PSRP2 were subcloned into the AD vector. DIG8-BD was co-transformed into yeast with each AD construct. The interactions were expressed on DDO medium with X-gal (D) and TDO medium (E). (F), Arrangement of yeast strains shown in (D) and (E). The empty-AD and DIG8-BD pair was used as a negative control, and the SV40T-AD and P53-BD pair was used as a positive control. (G–L), Confirmation of interactions between DIG8 and predicted DIG8-interacting proteins in protoplasts. DIG8 was subcloned into the c-EYFP vector; the others were subcloned into the n-EYFP vector. DIG8-c was co-transformed into protoplasts with each n-YFP construct. The EYFP signals of DIG8-c with CPN60β-n (G), CPFTF-n (H), CPRRF-n (I), PSRP2-n (J) were observed by confocal microscopy. (K), Interaction of HOS5-n and FRY2-c was used as the positive control. (L), Interaction of EMB2654-n and DIG8-c was used the negative control. Scale bars=10 µm.
Figure 5
Figure 5
The dig8 mutation causes aberrant grana structure in chloroplasts. A and B, images of transmission electron microscopy of grana structures in leaf chloroplasts of Col (A) and dig8 mutant (B). Scale bar, 2 μm. (C), Fluorescence of Col and dig8 mutant measured by a Joliot-type spectrophotometer. Leaves of Col and dig8 mutant were dark-adapted for 15 min, illuminated with either low (80 μmol photons m-2 s-1) or medium (320 μmol photons m-2 s-1) orange actinic light (630 nm), and allowed to recover in darkness. Saturating pulses (7,900 μmol photons m-2 s-1, 200 ms duration) were applied to measure maximum fluorescence Fm and Fm’. (D), maximum PSII quantum yield of Col and dig8 mutant in darkness and light. Darkness adapted Arabidopsis leaves were exposed to different intensities of actinic light followed by recovery in darkness. Maximum quantum yield of PSII was calculated. LL: 80 μmol photons m-2 s-1, ML: 320 μmol photons m-2 s-1. **P < 0.01 (Student’s t test). (E), Chlorophyll a fluorescence quenching of Col and dig8 mutant. Leaves of Col and dig8 mutant were darkness-adapted for 15 min. NPQ was induced by 500 s of orange actinic light (630 nm, LL: 80 μmol photons m-2 s-1, ML: 320 μmol photons m-2 s-1), followed by recovery in darkness. Four independent biological replicates were analyzed. (F), P700 oxidation and reduction in Col and dig8 mutant. Darkness adapted (15 min) leaves of Col and dig8 mutant were illuminated with orange (630 nm, 320 μmol photons m-2 s-1) or far-red (725 nm, 1400 μmol photons m-2 s-1) actinic light. P700 oxidation and reduction were monitored by absorbance changes at 705 nm. Four independent biological replicates were analyzed.
Figure 6
Figure 6
Higher ROS levels in the dig8 mutant. A and B, ROS was detected by DAB (A) and NBT (B) staining. Seedlings of Col and dig8 mutant were immersed in DAB and NBT solution at room temperature, and decolorization in ethanol. The images were captured with a Leica M80 stereo microscope. Scale Bar, 1 mm. (C), qRT-PCR analysis of ROS-related genes in Col and dig8 mutant. Error bars represent SDs among three independent replicates. Asterisks indicate a significant difference between the indicated samples (t-test, *P < 0.05, **P < 0.01).
Figure 7
Figure 7
ROS caused lower PD permeability in the dig8 mutant. (A, B), Callose deposition in Col and dig8 mutant. Seedlings were cleared and stained with aniline blue. Roots images were taken with fluorescence microscopy. (C, D), PD permeability of Col and dig8 mutant. Cotyledons of 10-day-old seedlings were wounded and CFDA dye solution was applied to the wound. Roots images of Col and dig8 mutant (D) were taken with a microscope. Scale bar, 1 mm.
Figure 8
Figure 8
The dig8 mutant phenotype can be partially rescued by sugar supplementation. (A–D), Col and dig8 mutant grown on MS media supplemented with sucrose at the rate (w/v) of 0.5% (A), 1% (B), 2% (C), or 3% (D), respectively. Scale bar, 1 cm.10-d-old seedlings were transferred to the shown vertical plates and pictures were taken 2 weeks after the transfer. (E–H), fresh weight (E), root weight (F), lateral root number (G) and primary root length (H) of Col and dig8 mutant seedlings at different sucrose concentrations. Error bars represent SD (n=20).

Similar articles

Cited by

References

    1. Abdallah F., Salamini F., Leister D. (2000). A prediction of the size and evolutionary origin of the proteome of chloroplasts of arabidopsis. Trends Plant Sci. 5, 141–142. doi: 10.1016/s1360-1385(00)01574-0 - DOI - PubMed
    1. Adio S., Sharma H., Senyushkina T., Karki P., Maracci C., Wohlgemuth I., et al. . (2018). Dynamics of ribosomes and release factors during translation termination in e. coli. Elife 7:e34252. doi: 10.7554/eLife.34252 - DOI - PMC - PubMed
    1. Albrecht V., Ingenfeld A., Apel K. (2006). Characterization of the snowy cotyledon 1 mutant of arabidopsis thaliana: The impact of chloroplast elongation factor G on chloroplast development and plant vitality. Plant Mol. Biol. 60, 507–518. doi: 10.1007/s11103-005-4921-0 - DOI - PubMed
    1. Apel K., Hirt H. (2004). Reactive oxygen species: Metabolism, oxidative stress, and signal transduction. Annu. Rev. Plant Biol. 55, 373–399. doi: 10.1146/Annurev.Arplant.55.031903.141701 - DOI - PubMed
    1. Apuya N. R., Yadegari R., Fischer R. L., Harada J. J., Zimmerman J. L., Goldberg R. B. (2001). The arabidopsis embryo mutant schlepperless has a defect in the chaperonin-60alpha gene. Plant Physiol. 126, 717–730. doi: 10.1104/Pp.126.2.717 - DOI - PMC - PubMed

LinkOut - more resources