

Inequalities in SARS-CoV-2 case rates by ethnicity, religion, measures of socioeconomic position, English proficiency, and self-reported disability: cohort study of 39 million people in England during the alpha and delta waves
- PMID: 37063237
- PMCID: PMC10568121
- DOI: 10.1136/bmjmed-2022-000187
Inequalities in SARS-CoV-2 case rates by ethnicity, religion, measures of socioeconomic position, English proficiency, and self-reported disability: cohort study of 39 million people in England during the alpha and delta waves
Abstract
Objective: To examine sociodemographic inequalities in people with SARS-CoV-2 during the second (alpha) and third (delta) waves of the covid-19 pandemic.
Design: Retrospective, population based cohort study.
Setting: Resident population of England.
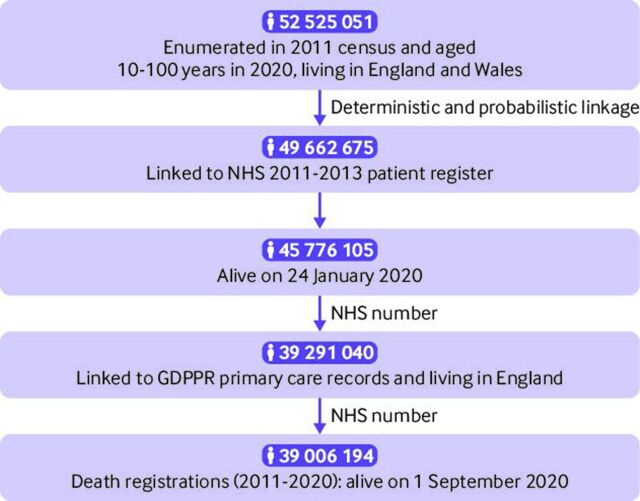
Participants: 39 006 194 people aged 10 years and older who were enumerated in the 2011 census, registered with the NHS, and alive on 1 September 2020.
Main outcome measures: Age standardised SARS-CoV-2 case rates (ie, the number of people who received a positive test result per 100 000 person weeks at risk) during the second wave (1 September 2020 to 22 May 2021) or third wave (23 May to 10 December 2021) of the pandemic. Age standardised rates were calculated by sociodemographic characteristics and adjusted rate ratios were estimated using generalised linear regression models with a Poisson distribution (models were adjusted for covariates including sex, age, geographical variables, and sociodemographic characteristics).
Results: During the study period, 5 767 584 people (14.8% of the study population) tested positive for SARS-CoV-2. In the second wave, the fully adjusted relative risks of having a positive test were highest for the Bangladeshi and Pakistani ethnic groups compared with the white British group, with rate ratios of 1.75 (95% confidence interval 1.73 to 1.77) and 1.69 (1.68 to 1.70), respectively. Muslim and Sikh religious groups had fully adjusted rate ratios of 1.51 (1.50 to 1.51) and 1.64 (1.63 to 1.66), respectively, compared with the Christian group. Greater area deprivation, disadvantaged socioeconomic position, living in a care home, and low English language proficiency were also associated with higher relative risk of having a positive test. However, the inequalities among groups varied over time. Being Christian, white British, without a disability, and from a more advantaged socioeconomic position were associated with increased relative risk of testing positive during the third wave.
Conclusion: Research is urgently needed to understand the large sociodemographic inequalities in SARS-CoV-2 case rates in order to inform policy interventions in future waves or pandemics.
Keywords: COVID-19; epidemiology; public health; socioeconomic factors; statistics.
© Crown copyright 2023.
Conflict of interest statement
Competing interests: All authors have completed the ICMJE uniform disclosure form at www.icmje.org/disclosure-of-interest/ and declare: no support from any organisation for the submitted work; KK chairs the Ethnicity Subgroup of the UK Scientific Advisory Group for Emergencies (SAGE), and is a member of SAGE; ASW’s institution received grants from the Department of Health and Social Care and the National Institutes of Health Research; RA received grants from New York University Abu Dhabi and Upjohn.
Figures
Similar articles
-
Ethnic differences in COVID-19 mortality in the second and third waves of the pandemic in England during the vaccine rollout: a retrospective, population-based cohort study.BMC Med. 2023 Jan 8;21(1):13. doi: 10.1186/s12916-022-02704-7. BMC Med. 2023. PMID: 36617562 Free PMC article.
-
Ethnic differences in COVID-19 mortality during the first two waves of the Coronavirus Pandemic: a nationwide cohort study of 29 million adults in England.Eur J Epidemiol. 2021 Jun;36(6):605-617. doi: 10.1007/s10654-021-00765-1. Epub 2021 Jun 16. Eur J Epidemiol. 2021. PMID: 34132940 Free PMC article.
-
Sociodemographic inequality in COVID-19 vaccination coverage among elderly adults in England: a national linked data study.BMJ Open. 2021 Jul 23;11(7):e053402. doi: 10.1136/bmjopen-2021-053402. BMJ Open. 2021. PMID: 34301672 Free PMC article.
-
Ethnic inequalities in positive SARS-CoV-2 tests, infection prognosis, COVID-19 hospitalisations and deaths: analysis of 2 years of a record linked national cohort study in Scotland.J Epidemiol Community Health. 2023 Oct;77(10):641-648. doi: 10.1136/jech-2023-220501. Epub 2023 Jul 31. J Epidemiol Community Health. 2023. PMID: 37524538 Free PMC article.
-
Ethnic minority status as social determinant for COVID-19 infection, hospitalisation, severity, ICU admission and deaths in the early phase of the pandemic: a meta-analysis.BMJ Glob Health. 2021 Nov;6(11):e007433. doi: 10.1136/bmjgh-2021-007433. BMJ Glob Health. 2021. PMID: 34740916 Free PMC article.
Cited by
-
Tracking the progress of inequalities in SARS-CoV-2 infections into the third covid-19 wave.BMJ Med. 2023 Feb 27;2(1):e000512. doi: 10.1136/bmjmed-2023-000512. eCollection 2023. BMJ Med. 2023. PMID: 37063236 Free PMC article. No abstract available.
-
Ethnic differences in COVID-19 mortality in the second and third waves of the pandemic in England during the vaccine rollout: a retrospective, population-based cohort study.BMC Med. 2023 Jan 8;21(1):13. doi: 10.1186/s12916-022-02704-7. BMC Med. 2023. PMID: 36617562 Free PMC article.
-
Trends and social inequalities in self-reported health and activity limitations in France between 2017 and 2021: results from four nationwide representative surveys.BMC Public Health. 2024 Jul 17;24(1):1916. doi: 10.1186/s12889-024-19437-2. BMC Public Health. 2024. PMID: 39020354 Free PMC article.
References
-
- GOV.UK . Coronavirus (COVID-19) in the UK dashboard. 2021.
-
- Lilleker D, Coman IA, Gregor M, et al. . Political communication and covid-19. 2021. 10.4324/9781003120254 - DOI
-
- Bosworth ML, Ayoubkhani D, Nafilyan V, et al. . Deaths involving COVID-19 by self-reported disability status during the first two waves of the COVID-19 pandemic in england: a retrospective, population-based cohort study. Lancet Public Health 2021;6:e817–25. 10.1016/S2468-2667(21)00206-1 - DOI - PMC - PubMed
LinkOut - more resources
Full Text Sources
Miscellaneous