. 2023 Mar 13;19(6):1764-1777.
doi: 10.7150/ijbs.81317. eCollection 2023.

SB Digestor: a tailored driver gene identification tool for dissecting heterogeneous Sleeping Beauty transposon-induced tumors

Affiliations

SB Digestor: a tailored driver gene identification tool for dissecting heterogeneous Sleeping Beauty transposon-induced tumors

Aiping Zhang et al. Int J Biol Sci. .

Abstract

Sleeping Beauty (SB) insertional mutagenesis has been widely used for genome-wide functional screening in mouse models of human cancers, however, intertumor heterogeneity can be a major obstacle in identifying common insertion sites (CISs). Although previous algorithms have been successful in defining some CISs, they also miss CISs in certain situations. A major common characteristic of these previous methods is that they do not take tumor heterogeneity into account. However, intertumoral heterogeneity directly influences the sequence read number for different tumor samples and then affects CIS identification. To precisely detect and define cancer driver genes, we developed SB Digestor, a computational algorithm that overcomes biological heterogeneity to identify more potential driver genes. Specifically, we define the relationship between the sequenced read number and putative gene number to deduce the depth cutoff for each tumor, which can reduce tumor complexity and precisely reflect intertumoral heterogeneity. Using this new tool, we re-analyzed our previously published SB-based screening dataset and identified many additional potent drivers involved in Brca1-related tumorigenesis, including Arhgap42, Tcf12, and Fgfr2. SB Digestor not only greatly enhances our ability to identify and prioritize cancer drivers from SB tumors but also substantially deepens our understanding of the intrinsic genetic basis of cancer.

Keywords: Fgfr2; SB Digestor; Sleeping Beauty transposon; common insertion sites; intertumor heterogeneity.


Conflict of interest statement

Competing Interests: The authors have declared that no competing interest exists.

Figures

Figure 1
Figure 1
Overview of SB Digestor analysis pipeline. A. Raw data pre-processing. The raw data were processed by filtering the low-quality reads and trimming the adapters. B. Define significant insertional genes by binomial test. C. Saturation analysis. To determine the sequencing depth cutoff, 50 sample sizes of reads were extracted randomly, followed by gene annotation. Then, a curve was fitted, and an adapted formula was obtained to reflect the correlation between the number of annotated genes and the 50 sample sizes of reads for each sample. D. Defining depth for each sample. The depth cutoff value for each sample was calculated with the formula depth=reads num/gene number. E. Identify drivers. The candidate driver genes for each sample were sorted out based on the depth cutoff. Then, generate common insertion genes list for all tumors. F. Characterize drivers. The driver genes were further characterized based on the SB transposon insertion patterns, including both locations and transposon promoter directions.
Figure 2
Figure 2
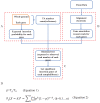
Define significant SB insertional genes. A. Calculate the expected SB insertion probability of each gene. The expected trapping probability of each gene in the mouse genome was calculated based on the gene size and the number of TA dinucleotides. B. Clean data alignment and annotation. After the data pre-processing, the clean data was mapped to the mouse reference genome, and did the loci annotation. C. The binomial test was applied to sort the significant SB insertional genes for each sample and generate a gene library for each sample. D. The equations to calculate the expected SB insertion probability (Equation 1) and the binomial P value of each gene (Equation 2), where Tg is the number of TA sites in a given gene and TG is the number of TA dinucleotides in the whole genome. p is the probability of a transposon jumping into the given gene within the whole mouse genome (Equation 1); k is the observed insertion number in a certain gene, which is also the mapped read number of the gene. Pg is the binomial probability (Equation 2).
Figure 3
Figure 3
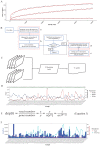
Read depth determination. A. Correlation curve of input read number and annotated significant insertional gene number. Here, the three curves represent 3 different tumor samples. For each sample, we extracted the same number of reads and then mapped and annotated them one by one. For a certain sample, if an annotated gene exists in the previous binomial test statistics library, we deemed it to be a reliable insertional gene. B. The strategy of saturation analysis. B-a. For each sample, 50 sample sizes of reads were randomly extracted. B-b. Alignment and gene annotation were applied for each sample size of reads, then counted the number of reads number for each gene. B-c.d. Statistical the significant SB insertional gene number and generate 50 gene sets for each sample. B-e. Fitting a curve to descript the relationship between reads number and gene number by the 50 sample sizes of reads and the corresponding gene sets. C. Flowchart of fitting curve calculation. We used the R function nls to deduce the relationship between the read number and gene number (X: 50 sample sizes of read number, Y: corresponding gene number, both a and b are constant). D. The a, b, and R squared values of each sample. E. The depth calculation formula, where y is the total significant insertion gene number of each sample; and x is the total clean read number of each sample. F. The read number, the calculated depth cutoff, and the detected candidate driver gene numbers of 67 test samples.
Figure 4
Figure 4
Comparison of SB Digestor and other tools. A-E. Comparison of the top 50 candidate genes identified with three different tools by Venn diagram (A) and scatter plot (B). To further demonstrate the performance stability of each tool, different numbers of reads were extracted randomly for candidate gene calling with different tools, namely, SB Digestor (C), TAPDANCE (D), and SB Driver (E). Then, the top genes were listed in the heatmap. The color indicates the abundance of each gene in tumor samples.
Figure 5
Figure 5
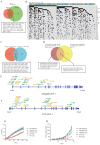
Candidate gene validation. A. Venn diagram indicating CIS genes for the BrWSB and BrMSB groups by using SB Digestor. B. Oncoplot shows the top overlapping 35 genes in both BrWSB and BrMSB tumors and their frequency in all tumor samples. C. Venn diagram showing the candidate genes identified by SB Digestor and previously by TAPDANCE. D. Venn diagram showing 18 overlapping genes among the 35 common genes identified by SB Digestor (Fig. 5A) and 50 common genes (Fig. 5C). E-F. SB transposon insertion patterns (appearing at more than 0.2%) in Arhgap42 and Tcf12. G. Candidate tumor suppressor genes were knocked out by using the CRISPR‒Cas9 system in G600 cells to evaluate their function. Cell proliferation was monitored with real-time cell analysis. H. Candidate gene knockout tumor cells and control cells were inoculated into nude mice for tumorigenesis evaluation.
Figure 6
Figure 6
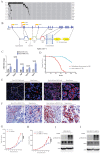
The Fgf/Fgfr pathway is a potent gain-of-function pathway for tumorigenesis. A. Oncoplot of the Fgf/Fgfr-related genes in both BrWSB and BrMSB tumors showing their frequency in all tumor samples. B. Representation of the distribution (percentage more than 5%) of CISs in the gene Fgfr2. Predicted effect of candidate genes, as indicated by their sense fraction of insertions based on the direction of the CAG promoter and the transcriptional direction of the inserted gene. C. The qPCR data revealed the Fgfs (Fgf7, Fgf10, Fgf12) and Fgfr2 (Fgfr2b, Fgfr2c) mRNA levels in Brca1 wild-type and deficient tumors (n=3). D. Kaplan-Meier curve showing the mammary tumor-free rate for SB mice with Fgfs/Fgfr-driven mice (n = 88) and control mice (n=118): BrW (n = 62) and BrM (n = 56). Fgf/Fgfr-related tumors tended to show earlier onset than control tumors (p < 0.0001) according to the log-rank test. E-F. IF/IHC staining shows the comparison of Fgfr2 expression (E) and Fgfr2 downstream phosphorylation (F) levels between Brca1 wild-type and Brca1-deficient mouse tumors. G. Cell viability comparison between control and Fgfr2-activated MDA-MB-231 cells. H. Brca1 knockdown and Brca1 knockdown with Fgfr2 activation in MDA-MB-231 cell lines. I. J. Representative Western blot showing Fgfr2 activation and Brca1 knockdown with Fgfr2 activation in the MDA-MB-231 cell line.

Similar articles

References

    1. Ivics Z, Hackett PB, Plasterk RH, Izsvak Z. Molecular reconstruction of Sleeping Beauty, a Tc1-like transposon from fish, and its transposition in human cells. Cell. 1997;91:501–10. - PubMed
    1. Weber J, Braun CJ, Saur D, Rad R. In vivo functional screening for systems-level integrative cancer genomics. Nat Rev Cancer. 2020;20:573–93. - PubMed
    1. de Ruiter JR, Kas SM, Schut E, Adams DJ, Koudijs MJ, Wessels LFA. et al. Identifying transposon insertions and their effects from RNA-sequencing data. Nucleic Acids Res. 2017;45:7064–77. - PMC - PubMed
    1. Takeda H, Jenkins NA, Copeland NG. Identification of cancer driver genes using Sleeping Beauty transposon mutagenesis. Cancer Science. 2021;112:2089–96. - PMC - PubMed
    1. Miao K, Lei JHP, Valecha MV, Zhang AP, Xu J, Wang LJ, NOTCH1 activation compensates BRCA1 deficiency and promotes triple-negative breast cancer formation. Nature Communications. 2020. 11. - PMC - PubMed

Publication types