. 2023;55(2):343-371.
doi: 10.1007/s10686-022-09873-6. Epub 2022 Oct 25.

Proton irradiation of SiPM arrays for POLAR-2

Affiliations

Proton irradiation of SiPM arrays for POLAR-2

Slawomir Mianowski et al. Exp Astron (Dordr). 2023.

Abstract

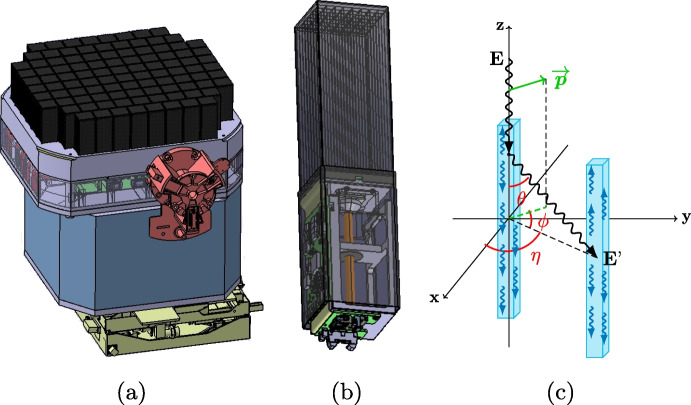
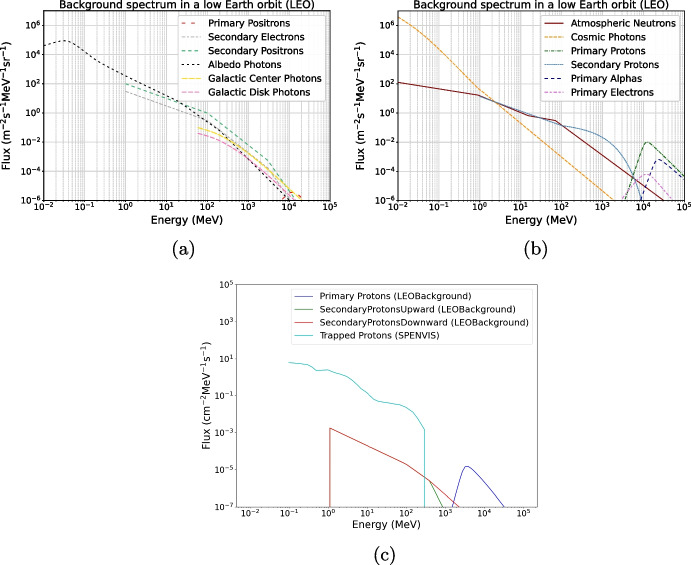
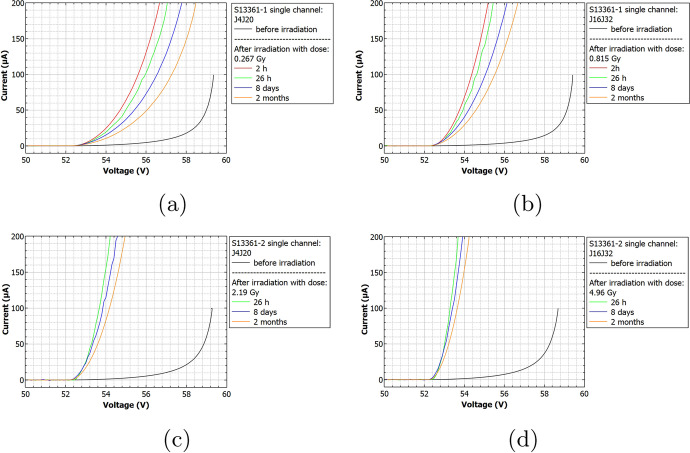
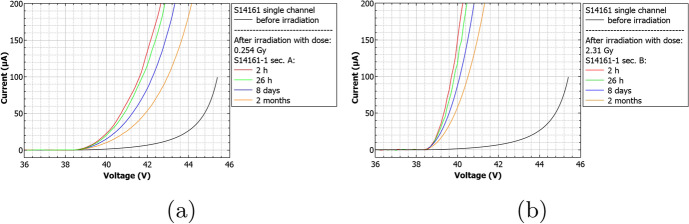
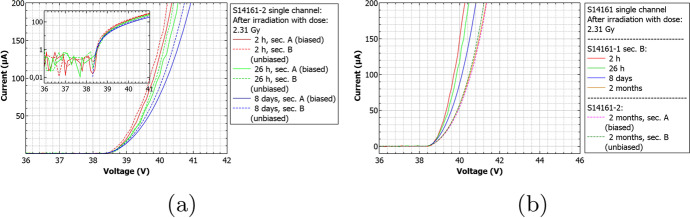
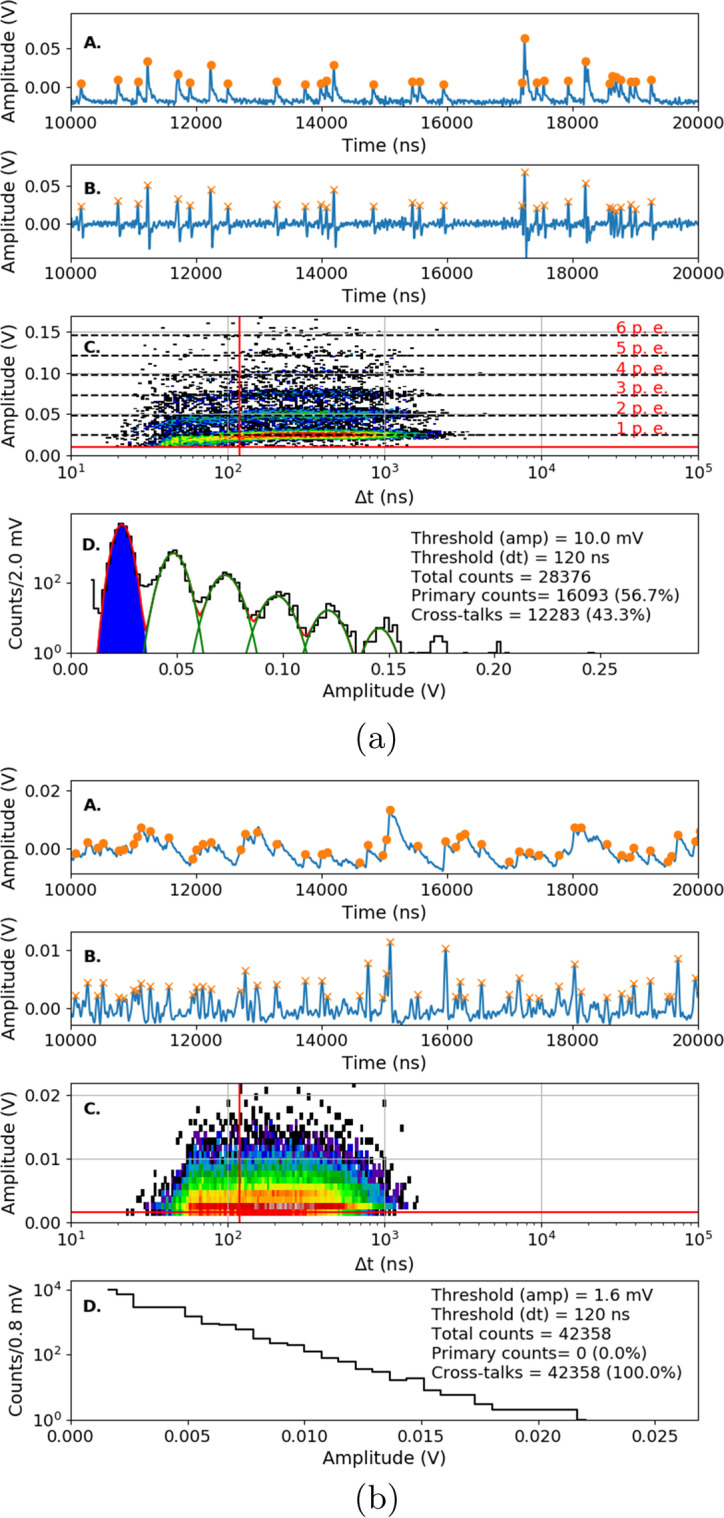
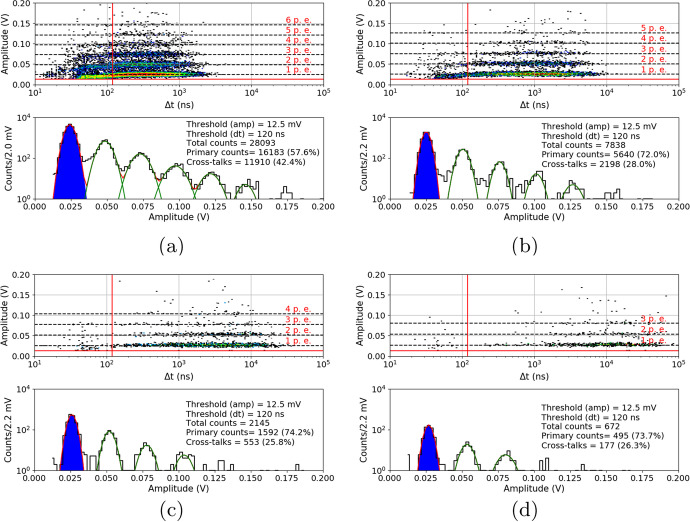
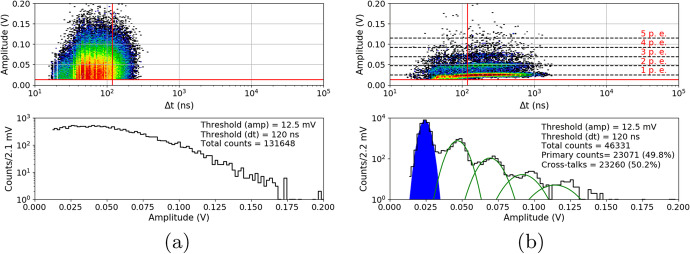
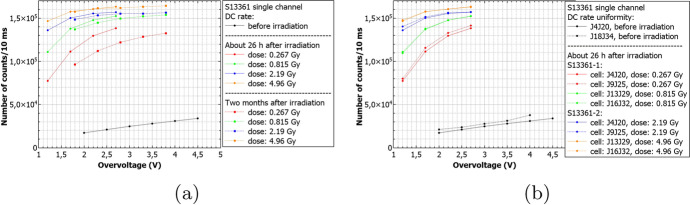
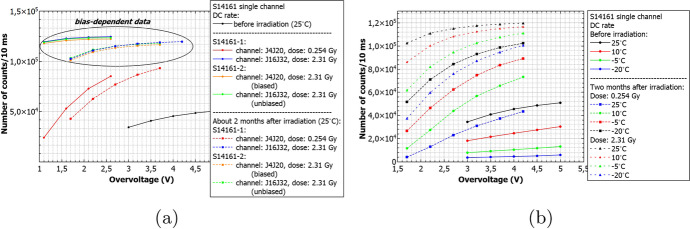
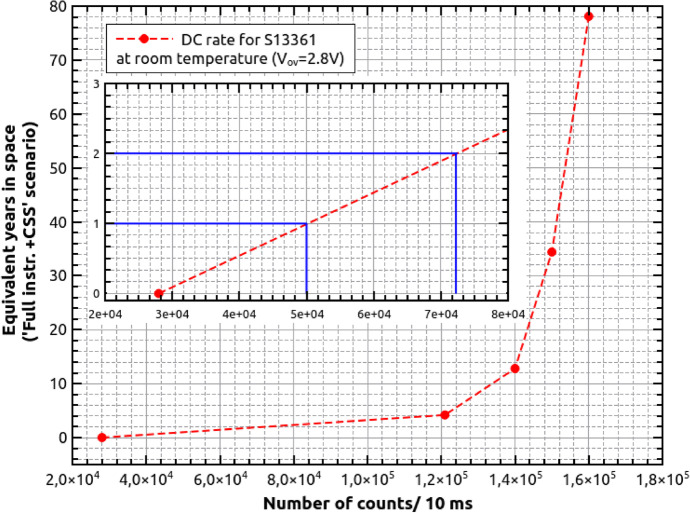
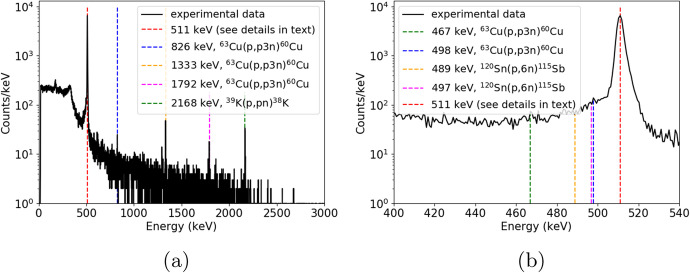
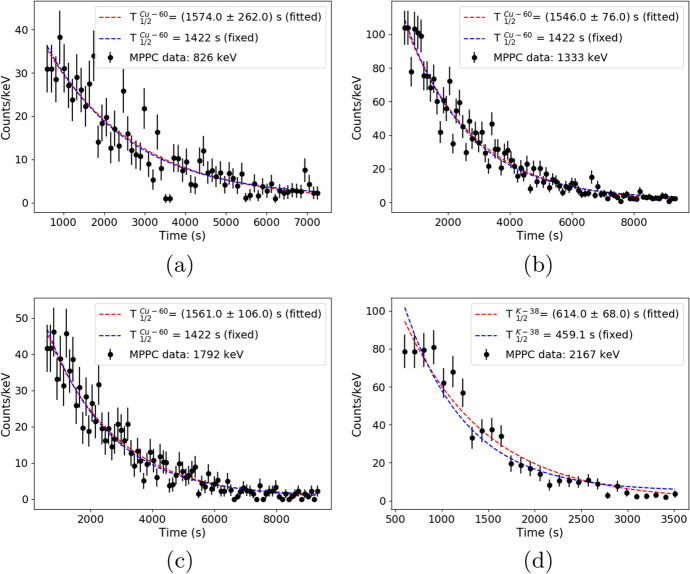
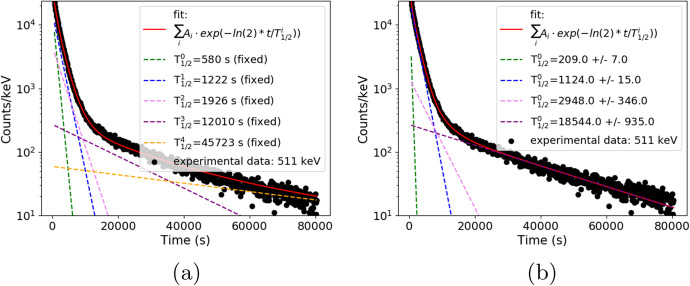
POLAR-2 is a space-borne polarimeter, built to investigate the polarization of Gamma-Ray Bursts and help elucidate their mechanisms. The instrument is targeted for launch in 2024 or 2025 aboard the China Space Station and is being developed by a collaboration between institutes from Switzerland, Germany, Poland and China. The instrument will orbit at altitudes between 340km and 450km with an inclination of 42 and will be subjected to background radiation from cosmic rays and solar events. It is therefore pertinent to better understand the performance of sensitive devices under space-like conditions. In this paper we focus on the radiation damage of the silicon photomultiplier arrays S13361-6075NE-04 and S14161-6050HS-04 from Hamamatsu. The S13361 are irradiated with 58MeV protons at several doses up to 4.96Gy, whereas the newer series S14161 are irradiated at doses of 0.254Gy and 2.31Gy. Their respective performance degradation due to radiation damage are discussed. The equivalent exposure time in space for silicon photomultipliers inside POLAR-2 with a dose of 4.96Gy is 62.9years (or 1.78years when disregarding the shielding from the instrument). Primary characteristics of the I-V curves are an increase in the dark current and dark counts, mostly through cross-talk events. Annealing processes at 25 C were observed but not studied in further detail. Biasing channels while being irradiated have not resulted in any significant impact. Activation analyses showed a dominant contribution of β + particles around 511 keV. These resulted primarily from copper and carbon, mostly with decay times shorter than the orbital period.

Keywords: Cosmic rays; POLAR-2; Protons; Radiation; SiPM.


Conflict of interest statement

Conflicts of interestThe authors declare that the research was conducted in the absence of any commercial or financial relationships that could be construed as a potential conflict of interest.

Figures

Fig. 1
Fig. 1
a) A preliminary CAD model of POLAR-2 and b) the polarimeter module [8]. c) A schematic of a photon scattering between two scintillator bars. These bars do not necessarily need to be inside the same module
Fig. 2
Fig. 2
Top left shows a 3D rendering of the CSS. Top right provides a simplified version of the experimental module, whereas in the bottom you can see the full POLAR-2 instrument in GEANT4 [12]
Fig. 3
Fig. 3
a) and b) The spectrum of various background particles [13] expected to be seen at an altitude of 383km and an inclination of 42 (typical POLAR-2 orbit). c) Comparison between the proton energy spectrum from LEOBackground [13] and SPENVIS [14]
Fig. 4
Fig. 4
Normalized dose distribution per detector module in the POLAR-2 instrument (seen from the top) due to background radiation. The asymmetry is due to shielding from neighbor instruments on the payload platform and from the robotic arm adapter piece. The bottom right corner is not facing any neighbor payload, and the adapter is installed on the bottom side
Fig. 5
Fig. 5
a) A schematic of the proton radiation therapy facility at IFJ. b) A photo of the exit of proton beam line
Fig. 6
Fig. 6
Scaled beam profile (to its average) of 58MeV protons along the x-axis and y-axis
Fig. 7
Fig. 7
The model of SiPM single channel used for different dose calculations. The first layer corresponds to 100μm of epoxy resin, the second layer to 450μm of silicon
Fig. 8
Fig. 8
The Hamamatsu MPPC S13361-6075NE-04 array mounted on PCB plate. Yellow line divide the array to two sections ’A’ and ’B’. Single channel J4J20 is also marked with orange line
Fig. 9
Fig. 9
Current-voltage S13361 single channel characteristics before and after its irradiation for a dose of a) 0.267Gy, b) 0.815Gy, c) 2.19Gy and d) 4.96Gy
Fig. 10
Fig. 10
Current-voltage MPPC S14161 single channel characteristics before and after its irradiation for a dose of a) 0.254Gy and b) 2.31Gy
Fig. 11
Fig. 11
Current-voltage single channel characteristics for biased (channel: J4J20) and unbiased (channel: J16J32) S14161 subarray irradiated with dose 2.31Gy for different times after irradiation. The inset in figure a) shows the breakdown voltage region in y-log scale. Figure b) compares also two S14161 arrays (two single channels unbiased, one biased) two months after irradiation
Fig. 12
Fig. 12
An example of a single channel waveform analysis of a) S13361 b) S14161, measured at temperature 25C before proton irradiation. A - a part of 10ms waveform, B - transformed waveform with peak identification, C - 3D distribution of dark pulse amplitudes as a function of time difference between two subsequent events, where the Z-axis is represented by a colour scale. D - projection of the dark counts with amplitude and time cut conditions. Blue color describes 1 p.e. position and primary counts (not visible in the S14161 case)
Fig. 13
Fig. 13
S13361 single channel DC spectra measured before proton irradiation for various temperatures and the same Vov=3.5V: a) 25C, b) 10C, c) -5C, d) -20C. The Z-axis is represented here by a colour scale
Fig. 14
Fig. 14
S14161 single channel DC spectra measured before proton irradiation for various temperatures and the same Vov=3.5V: a) 25C, b) 10C, c) -5C, d) -20C. The Z-axis is represented here by a colour scale
Fig. 15
Fig. 15
The number of dark counts measured for a single channel of a) S13361 and b) S14161 array for chosen overvoltage ranges at different temperatures
Fig. 16
Fig. 16
An example of waveform analysis for data taken for S13361 single channel measured at 27C for doses: a) 0.267Gy, b) 0.815Gy, c) 2.19Gy and d) 4.96Gy. The Z-axis is represented here by a colour scale. The overvoltage was set to 2.8 V in each case
Fig. 17
Fig. 17
An example of waveform analysis for data taken two months after irradiation with dose 0.267Gy for S13361 single channel at a) 25C and b) -20C. The Z-axis is represented here by a colour scale. The overvoltage was set to 2.8V
Fig. 18
Fig. 18
An example of waveform analysis for data taken two months after irradiation with dose 0.815Gy for S13361 single channel at a) 25C and b) -20C. The Z-axis is represented here by a colour scale. The overvoltage was set to 2.8V
Fig. 19
Fig. 19
An example of waveform analysis for data taken two months after S13361 irradiation with doses a) 2.19Gy and b) 4.96Gy at temperature -20C. The Z-axis is represented here by a colour scale. The overvoltage was set to 2.8V
Fig. 20
Fig. 20
The number of dark counts per 10ms interval time measured at room temperature for S13361 a) before irradiation, 26h and two months after b) for two different channels before and 26h after irradiated. Different doses are presented
Fig. 21
Fig. 21
The number of dark counts per 10ms interval time measured before irradiation and two months after for S13361 for different doses and temperatures
Fig. 22
Fig. 22
The number of dark counts per 10ms interval time measured for S14161 a) before irradiation, 26h and 2 months after at room temperature b) for two different channels irradiated with the same dose 26h after proton irradiation. As it is shown in a) the bias-dependent effect is not visible
Fig. 23
Fig. 23
The number of DC measured at room temperature and Vov=2.8V, when ’Full Instrument + CSS’ scenario is assumed (more details in the text). The inset shows expected DC rate after one and two years equivalent in cosmic space
Fig. 24
Fig. 24
The example of gamma-ray energy spectrum measured with HPGe detector after SiPM proton irradiation. Black line shows experimental data. Dashed colour lines show identified peaks
Fig. 25
Fig. 25
Decay time distributions (black points) measured for 58MeV proton irradiated SiPM. Subfigures corresponds to different energy gated lines a) 826keV, b) 1333keV, c) 1792keV and d) 2167keV. Red dashed lines correspond to fitting procedure, where amplitudes and decay times were set as a free parameters. Blue dashed lines describe the cases with fixed decay times (see details in text)
Fig. 26
Fig. 26
Decay time distribution of 511keV line (black points) measured for 58MeV proton irradiated SiPM. Red lines show the results of fitting procedure for a) N=4 (8 free parameters) and b) N=5 (5 free parameters - only amplitudes). Dashed lines show each component contribution (see more details in text)

References

    1. Abbott, B.P., Abbott, R., Abbott, T. D., Acernese, F., Ackley, K., Adams, C., Adams, T., Addesso, P., Adhikari, R. X., Adya, V. B., et al.: Gravitational waves and gamma-rays from a binary neutron star merger: GW170817 and GRB 170817a. Astrophys. J. 848, 13 (2017). 10.3847/2041-8213/aa920c
    1. Woosley SE, Bloom JS. The supernova-gamma-ray burst connection. Ann. Rev. Astron. Astrophys. 2006;44:507–556. doi: 10.1146/annurev.astro.43.072103.150558. - DOI
    1. Yonetoku D, Murakami T, Gunji S, Mihara T, Sakashita T, Morihara Y, Kikuchi Y, Takahashi T, Fujimoto H, Toukairin N, et al. Gamma-ray burst polarimeter (gap) aboard the small solar power sail demonstrator ikaros. Pub. Astron. Soc. Japan. 2011;63:625–638. doi: 10.1093/pasj/63.3.625. - DOI
    1. Produit, N., Bao, T.W., Batsch, T., Bernasconi, T., Britvich, I., Cadoux, F., Cernuda, I., Chai, J.Y., Dong, Y.W., Gauvin, N., et al.: Design and construction of the polar detector. Nucl. Instruments Methods Phys. Res. Sect. A Acc. Spectromet. Detect. Assoc. Equip. 877, 259–268 (2018). 10.1016/j.nima.2017.09.053
    1. Lowell AW, Boggs SE, Chiu CL, Kierans CA, Sleator C, Tomsick JA, Zoglauer AC, Chang H-K, Tseng C-H, Yang C-Y, et al. Polarimetric analysis of the long duration gamma-ray burst grb 160530a with the balloon borne compton spectrometer and imager. Astrophys. J. 2017;848:119. doi: 10.3847/1538-4357/aa8ccb. - DOI

LinkOut - more resources