

Single-cell analyses reveal the dynamic functions of Itgb2+ microglia subclusters at different stages of cerebral ischemia-reperfusion injury in transient middle cerebral occlusion mice model
- PMID: 37063847
- PMCID: PMC10098327
- DOI: 10.3389/fimmu.2023.1114663
Single-cell analyses reveal the dynamic functions of Itgb2+ microglia subclusters at different stages of cerebral ischemia-reperfusion injury in transient middle cerebral occlusion mice model
Abstract
Introduction: The underlying pathophysiological mechanisms of cerebral ischemia reperfusion injury (CIRI) is intricate, and current studies suggest that neuron, astrocyte, microglia, endothelial cell, and pericyte all have different phenotypic changes of specific cell types after ischemic stroke. And microglia account for the largest proportion after CIRI. Previous transcriptomic studies of ischemic stroke have typically focused on the 24 hours after CIRI, obscuring the dynamics of cellular subclusters throughout the disease process. Therefore, traditional methods for identifying cell types and their subclusters may not be sufficient to fully unveil the complexity of single-cell transcriptional profile dynamics caused by an ischemic stroke.
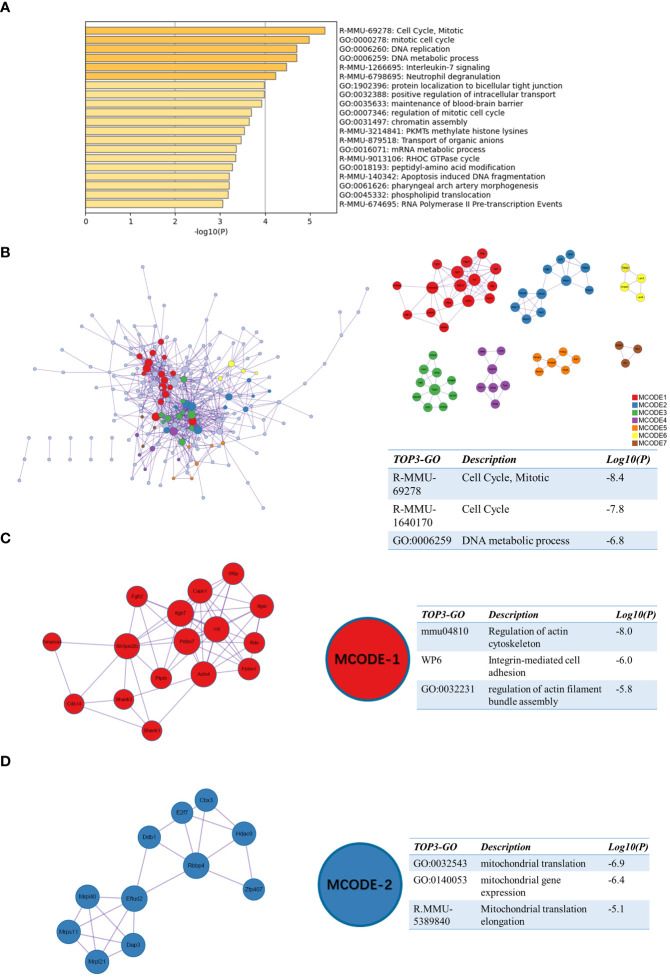
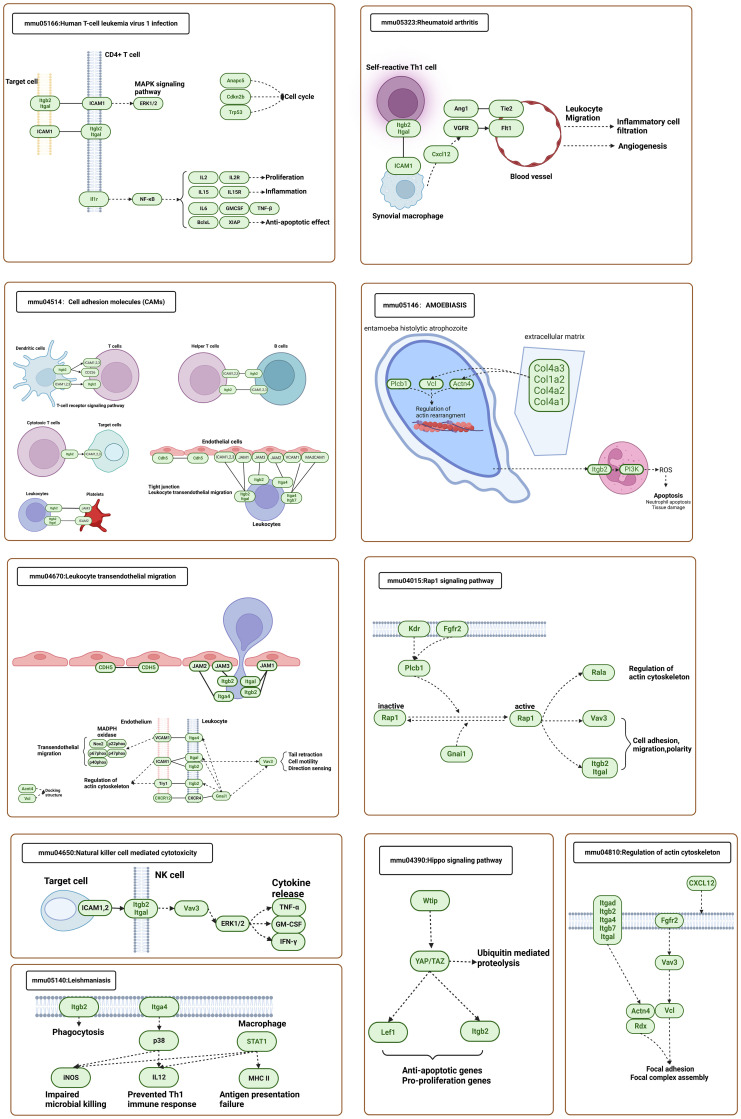
Methods: In this study, to explore the dynamic transcriptional profile of single cells after CIRI, we used single-cell State Transition Across-samples of RNA-seq data (scSTAR), a new bioinformatics method, to analyze the single-cell transcriptional profile of day 1, 3, and 7 of transient middle cerebral artery occlusion (tMCAO) mice. Combining our bulk RNA sequences and proteomics data, we found the importance of the integrin beta 2 (Itgb2) gene in post-modeling. And microglia of Itgb2+ and Itgb2- were clustered by the scSTAR method. Finally, the functions of the subpopulations were defined by Matescape, and three different time points after tMCAO were found to exhibit specific functions.
Results: Our analysis revealed a dynamic transcriptional profile of single cells in microglia after tMCAO and explored the important role of Itgb2 contributed to microglia by combined transcriptomics and proteomics analysis after modeling. Our further analysis revealed that the Itgb2+ microglia subcluster was mainly involved in energy metabolism, cell cycle, angiogenesis, neuronal myelin formation, and repair at 1, 3, and 7 days after tMCAO, respectively.
Discussion: Our results suggested that Itgb2+ microglia act as a time-specific multifunctional immunomodulatory subcluster during CIRI, and the underlying mechanisms remain to be further investigated.
Keywords: Itgb2; cerebral ischemia-reperfusion injury; microglia; scSTAR; single cell RNA-seq.
Copyright © 2023 Zeng, Cao, Hong, Liu, Hao, Qin, Zou and Tao.
Conflict of interest statement
The authors declare that the research was conducted in the absence of any commercial or financial relationships that could be construed as a potential conflict of interest.
Figures


References
-
- Avan A, Digaleh H, Di Napoli M, Stranges S, Behrouz R, Shojaeianbabaei G, et al. . Socioeconomic status and stroke incidence, prevalence, mortality, and worldwide burden: An ecological analysis from the global burden of disease study 2017. BMC Med (2019) 17:191. doi: 10.1186/s12916-019-1397-3 - DOI - PMC - PubMed
-
- Feigin VL, Abajobir AA, Abate KH, Abd-Allah F, Abdulle AM, Abera SF, et al. . Global, regional, and national burden of neurological disorders during 1990–2015: A systematic analysis for the global burden of disease study 2015. Lancet Neurol (2017) 16:877–97. doi: 10.1016/S1474-4422(17)30299-5 - DOI - PMC - PubMed
-
- Powers WJ, Rabinstein AA, Ackerson T, Adeoye OM, Bambakidis NC, Becker K, Biller J, et al. et al. . Guidelines for the early management of patients with acute ischemic stroke: 2019 update to the 2018 guidelines for the early management of acute ischemic stroke: A guideline for healthcare professionals from the American heart Association/American stroke association. Stroke (2019) 50:e344–418. doi: 10.1161/STR.0000000000000211 - DOI - PubMed
Publication types
MeSH terms
LinkOut - more resources
Full Text Sources
Medical
Molecular Biology Databases
Miscellaneous