. 2023 Mar 31:14:1172477.
doi: 10.3389/fimmu.2023.1172477. eCollection 2023.

Comparable cellular and humoral immunity upon homologous and heterologous COVID-19 vaccination regimens in kidney transplant recipients

Affiliations

Comparable cellular and humoral immunity upon homologous and heterologous COVID-19 vaccination regimens in kidney transplant recipients

Nina Körber et al. Front Immunol. .

Abstract

Background: Kidney transplant recipients (KTRs) are at high risk for a severe course of coronavirus disease 2019 (COVID-19); thus, effective vaccination is critical. However, the achievement of protective immunogenicity is hampered by immunosuppressive therapies. We assessed cellular and humoral immunity and breakthrough infection rates in KTRs vaccinated with homologous and heterologous COVID-19 vaccination regimens.

Method: We performed a comparative in-depth analysis of severe acute respiratory syndrome coronavirus 2 (SARS-CoV-2)-specific T-cell responses using multiplex Fluorospot assays and SARS-CoV-2-specific neutralizing antibodies (NAbs) between three-times homologously (n = 18) and heterologously (n = 8) vaccinated KTRs.

Results: We detected SARS-CoV-2-reactive T cells in 100% of KTRs upon third vaccination, with comparable frequencies, T-cell expression profiles, and relative interferon γ and interleukin 2 production per single cell between homologously and heterologously vaccinated KTRs. SARS-CoV-2-specific NAb positivity rates were significantly higher in heterologously (87.5%) compared to homologously vaccinated (50.0%) KTRs (P < 0.0001), whereas the magnitudes of NAb titers were comparable between both subcohorts after third vaccination. SARS-CoV-2 breakthrough infections occurred in equal numbers in homologously (38.9%) and heterologously (37.5%) vaccinated KTRs with mild-to-moderate courses of COVID-19.

Conclusion: Our data support a more comprehensive assessment of not only humoral but also cellular SARS-CoV-2-specific immunity in KTRs to provide an in-depth understanding about the COVID-19 vaccine-induced immune response in a transplant setting.

Keywords: COVID-19 vaccination; T-cell responses; immunosuppressive therapy; kidney transplant recipients; multiplex Fluorospot; neutralizing antibodies.


Conflict of interest statement

UP received personal fees from Abbott, Abbvie, Arbutus, Gilead, GSK, J&J, MSD, Roche, Sanofi, Sobi, and Vaccitech. UP is a cofounder and share-holder of SCG Cell Therapy. The lab of UP received grants from Hoehnle AG and SCG Cell Therapy. The remaining authors declare that the research was conducted in the absence of any commercial or financial relationships that could be construed as a potential conflict of interest.

Figures

Figure 1
Figure 1
Study design. (A) Diagram describing the flow of patient enrollment and exclusion. (B) A schematic of the study design illustrating applied coronavirus disease 2019 (COVID-19) vaccination regimens, doses, and the time of blood sampling.
Figure 2
Figure 2
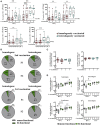
Severe acute respiratory syndrome coronavirus 2 (SARS)-CoV-2-specific T-cell responses of homologously and heterologously vaccinated kidney transplant recipients (KTRs) after second and third COVID-19 vaccination. (A) Numbers of spike (S1 or S2)-reactive interferon γ (IFN-γ), interleukin 2 (IL-2), and bifunctional IFN-γ/IL-2 cytokine-secreting cells of homologously (hoVac) (pink) or heterologously (turquoise) (heVac) vaccinated KTRs after two or three doses of COVID-19 vaccines depicted as spot-forming cells (SFCs) per 106 PBMC. (B) Cytokine expression profile of spike (S1 or S2)-reactive T cells of hoVac or heVac KTRs after two or three doses of COVID-19 vaccines. Pie charts show the proportions of mono- (gray) and bifunctional (green) cells, respectively. (C) Comparison of IFN-γ and IL-2 production per spike S1-reactive cytokine-secreting cells of hoVac or heVac KTRs after two or three doses of COVID-19 vaccines. Cytokine production per cell was determined by the parameters’ spot size and spot intensity as described in methods. (D) Comparison of cytokine production per spike (S1 or S2)-reactive mono- and bifunctional cytokine-secreting cells of hoVac or heVac KTRs after two or three doses of COVID-19 vaccines. Cytokine production per cell was determined as described in (C) and methods. Statistical analyses by two-sided Mann–Whitney U and Wilcoxon signed-rank tests and Fisher’s exact t test. Solely significant differences are indicated with an asterisk in the graphs. *P < 0.05; **P < 0.01; ***p < 0.001; ****P < 0.0001. LLOQ, lower limit of quantification.
Figure 3
Figure 3
SARS-CoV-2-specific NAb and serum neutralization capacity for Omicron BA.5 of homologously and heterologously COVID-19 vaccinated KTRs. Illustrated is (A) the percentage and (B) NAb titers of homologously (hoVac) and heterologously (heVac) vaccinated KTRs who developed SARS-CoV-2-specific NAbs after two or three doses of COVID-19 vaccines determined by a surrogate neutralization assay and given in AU/ml. (C) Exemplarily staining of RBD-specific memory B cells of hoVac KTRs with (responder) or without (non-responder) spike-specific IgG NAbs after three doses of COVID-19 vaccines. (D) Correlation of SARS-CoV-2-specific NAbs and the numbers of RBD-specific memory B cells of hoVac and heVac KTRs after three doses of COVID-19 vaccines. (E) Percentage of hoVac and heVac KTRs showing infection neutralization activity for Omicron BA.5 after second and third vaccination. (F) Changes in serum neutralization capacities for Omicron BA.5 after second and third COVID-19 vaccination. Inhibitory concentration (IC50) dilution values are given. Dots indicate the measurement of an individual patient with lines connecting individual values after second and third vaccination. (G, H) Spearman correlation of serum neutralization capacities for Omicron BA.5 and the NAb titer (G) and the numbers of spike S1-specific IFN-γ- and IL-2-secreting cells depicted as spot-forming cells (SFCs) per 106 PBMCs (H) after third vaccination of hoVac and heVac KTRs. Statistical analyses by the two-sided Mann–Whitney U test, Wilcoxon signed-rank test, Fisher’s exact t test, and Spearman correlation and linear regression analysis. Solely significant differences are indicated with an asterisk in the graphs. *P < 0.05; **P < 0.01; ****P < 0.001. LLOD = lower limit of detection. rs denotes the Spearman correlation coefficient.
Figure 4
Figure 4
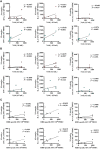
Correlation of SARS-CoV-2-specific T- and B-cell responses after two and three doses of COVID-19 vaccines. (A, B) Correlation of the numbers of spike S1-reactive IFN-γ, IL-2, and bifunctional IFN-γ/IL-2-secreting cells (depicted as SFCs per 106 PBMC) of homologously (hoVac) (pink) or heterologously (heVac) (turquoise) vaccinated KTRs with SARS-CoV-2-specific NAb titers after two (A) or three (B) doses of COVID-19 vaccines. (C) Correlation of the numbers of spike (S1 or S2)-reactive IFN-γ, IL-2, and bifunctional IFN-γ/IL-2 SFC per 106 PBMC with the numbers of RBD-specific memory B cells of hoVac and heVac KTRs after three doses of COVID-19 vaccines. Statistical analyses by correlation and linear regression; rs denotes the Spearman correlation coefficient.
Figure 5
Figure 5
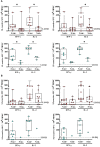
Comparison of SARS-CoV-2-specific T-cell responses of homologously or heterologously vaccinated KTRs with or without SARS-CoV-2-specific NAbs upon second or third COVID-19 vaccination. (A) and (B) Numbers of spike (S1 or S2)-reactive IFN-γ- and IL-2- secreting cells (depicted as SFCs per 106 PBMC) of homologously (pink) or heterologously (turquoise) vaccinated KTRs with (pink and turquoise; open circle) or without (pink and turquoise, circle/cross) SARS-CoV-2-specific NAbs after second (A) or third vaccination (B). Statistical analyses by two-sided Mann–Whitney U tests. Solely significant differences are indicated with an asterisk in the graphs. *P < 0.05. LLOQ, lower limit of quantification.
Figure 6
Figure 6
SARS-CoV-2-specific T- and B-cell responses and serum neutralization capacities for Omicron BA.5 stratified by KTRs with a SARS-CoV-2 breakthrough infection after third vaccination. (A) Numbers of SARS-CoV-2 spike S1- and S2-reactive T cells (depicted as the SFCs per 106 PBMCs), SARS-CoV-2-specific NAb titers (AU/ml) (B), the numbers of RBD-specific IgG- secreting memory B cells (C), and serum neutralization capacities for Omicron BA.5 (D) stratified by KTRs with a SARS-CoV-2 breakthrough infection after third vaccination. Statistical analyses by two-sided Mann–Whitney U tests. Solely significant differences are indicated with an asterisk in the graphs. *P < 0.05.

References

    1. Dong E, Du H, Gardner L. An interactive web-based dashboard to track COVID-19 in real time. Lancet Infect Dis (2020) 20(5):533–4. doi: 10.1016/s1473-3099(20)30120-1 - DOI - PMC - PubMed
    1. Maia Chagas A, Molloy JC, Prieto-Godino LL, Baden T. Leveraging open hardware to alleviate the burden of COVID-19 on global health systems. PloS Biol (2020) 18(4):e3000730. doi: 10.1371/journal.pbio.3000730 - DOI - PMC - PubMed
    1. The L. India Under COVID-19 lockdown. Lancet (2020) 395(10233):1315. doi: 10.1016/S0140-6736(20)30938-7 - DOI - PMC - PubMed
    1. Haider N, Osman AY, Gadzekpo A, Akipede GO, Asogun D, Ansumana R, et al. . Lockdown measures in response to COVID-19 in nine sub-Saharan African countries. BMJ Glob Health (2020) 5(10). doi: 10.1136/bmjgh-2020-003319 - DOI - PMC - PubMed
    1. Kantrowitz-Gordon I. A new normal after the COVID-19 pandemic. J Midwifery Womens Health (2021) 66(3):293–4. doi: 10.1111/jmwh.13247 - DOI - PMC - PubMed

Publication types

Substances