. 2023 Mar 30:14:1153789.
doi: 10.3389/fimmu.2023.1153789. eCollection 2023.

Uncovering the significance of expanded CD8+ large granular lymphocytes in inclusion body myositis: Insights into T cell phenotype and functional alterations, and disease severity

Affiliations

Uncovering the significance of expanded CD8+ large granular lymphocytes in inclusion body myositis: Insights into T cell phenotype and functional alterations, and disease severity

Emily McLeish et al. Front Immunol. .

Abstract

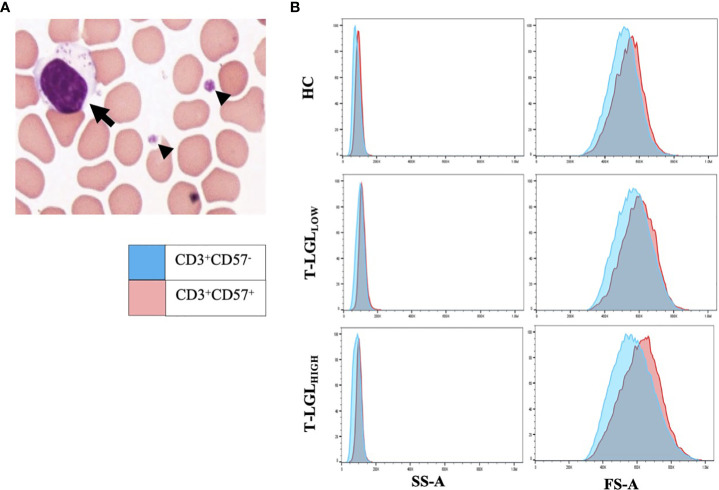
Introduction: Inclusion body myositis (IBM) is a progressive inflammatory myopathy characterised by skeletal muscle infiltration and myofibre invasion by CD8+ T lymphocytes. In some cases, IBM has been reported to be associated with a systemic lymphoproliferative disorder of CD8+ T cells exhibiting a highly differentiated effector phenotype known as T cell Large Granular Lymphocytic Leukemia (T-LGLL).

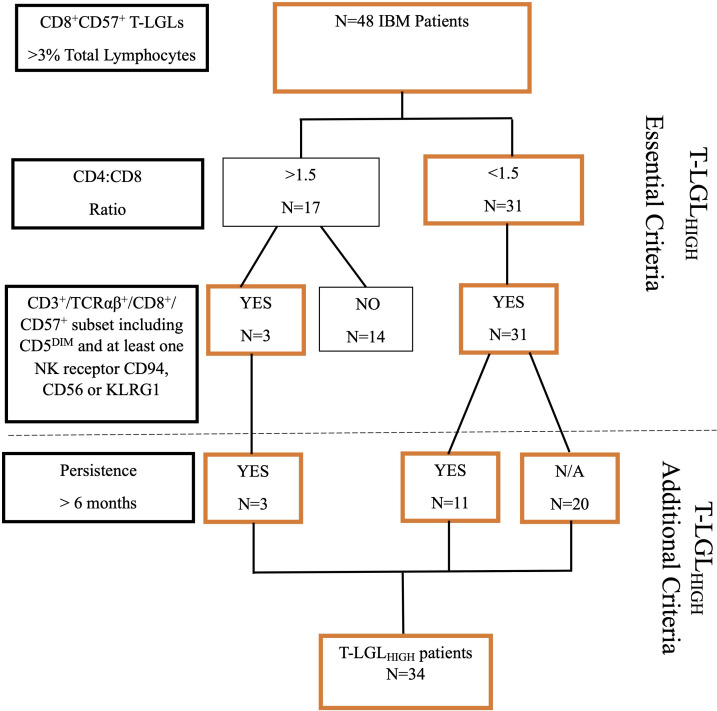
Methods: We investigated the incidence of a CD8+ T-LGL lymphoproliferative disorder in 85 IBM patients and an aged-matched group of 56 Healthy Controls (HC). Further, we analysed the phenotypical characteristics of the expanded T-LGLs and investigated whether their occurrence was associated with any particular HLA alleles or clinical characteristics.

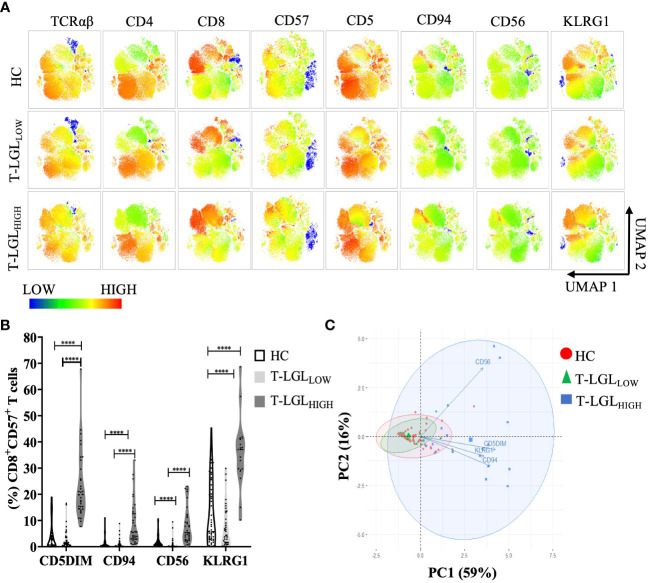
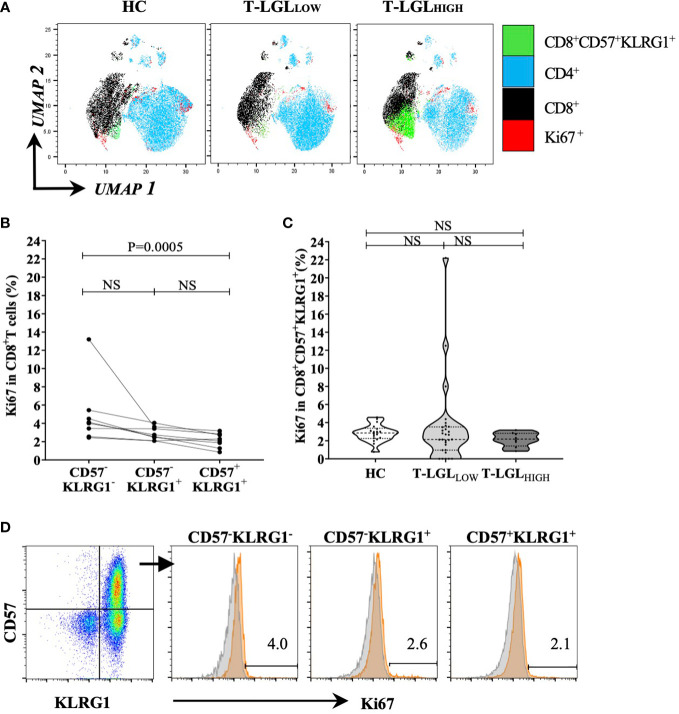
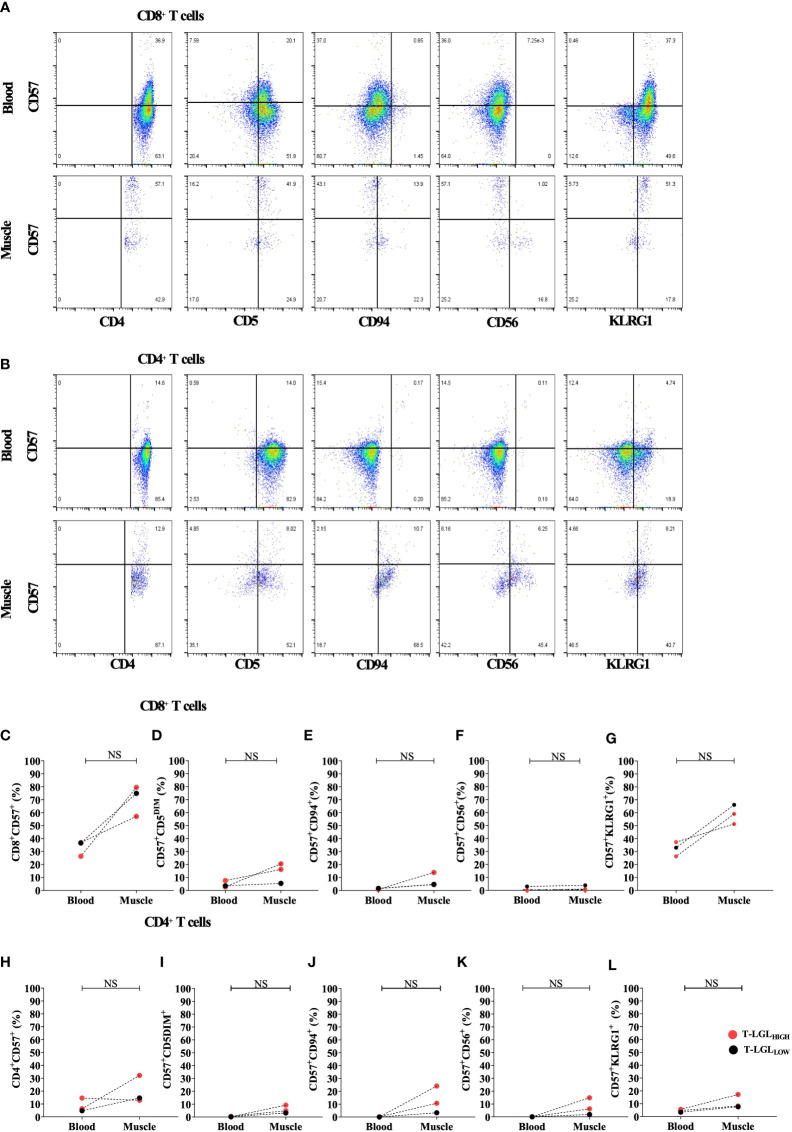
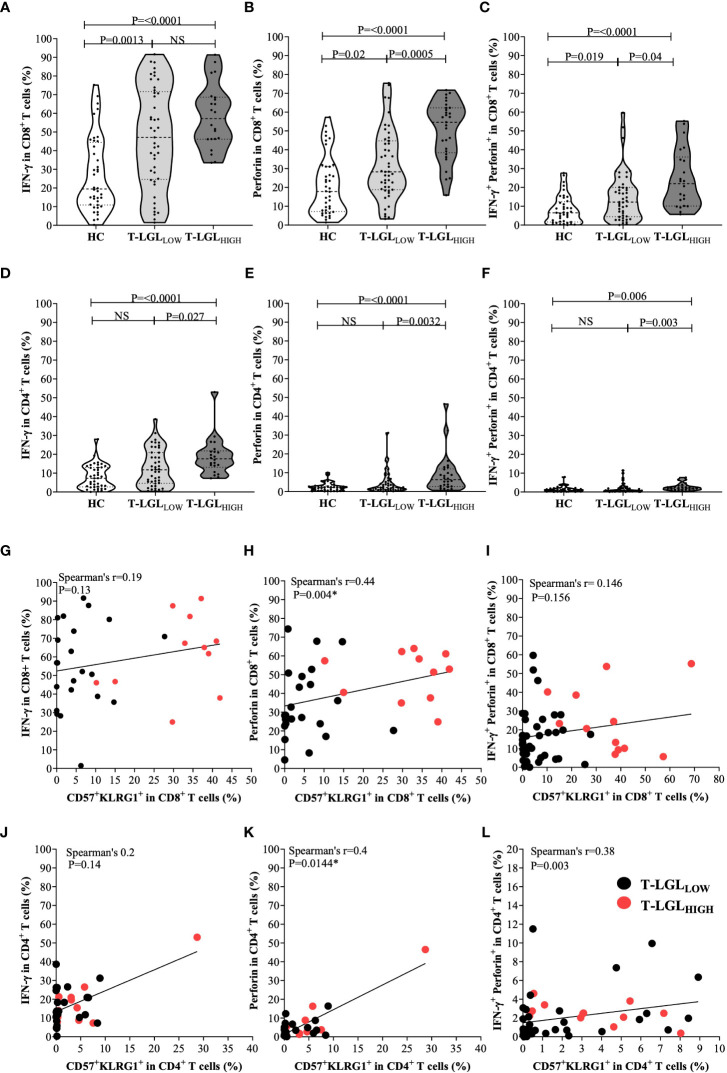
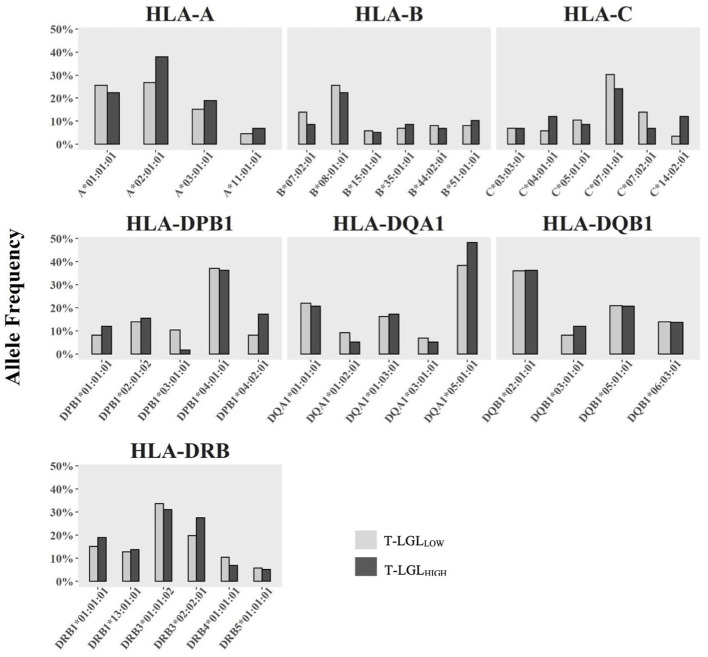
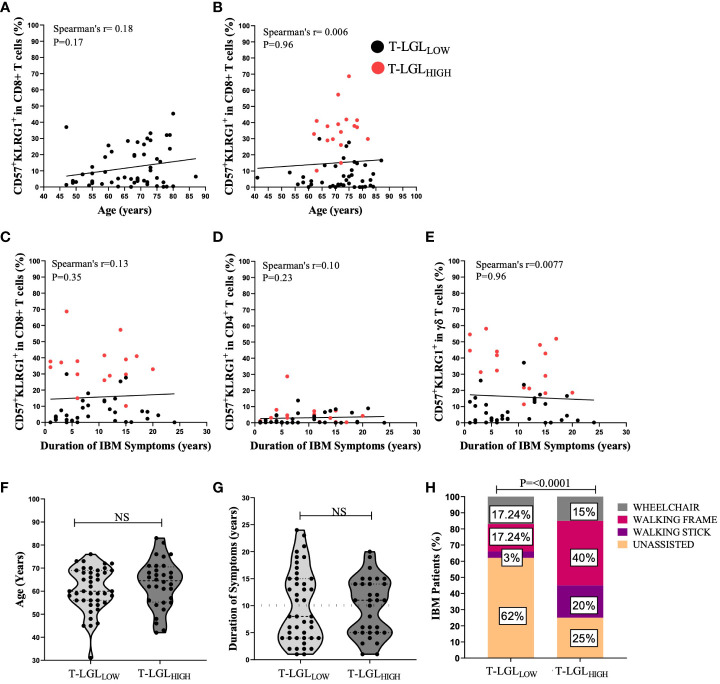
Results: Blood cell analysis by flow cytometry revealed expansion of T-LGLs in 34 of the 85 (40%) IBM patients. The T cell immunophenotype of T-LGLHIGH patients was characterised by increased expression of surface molecules including CD57 and KLRG1, and to a lesser extent of CD94 and CD56 predominantly in CD8+ T cells, although we also observed modest changes in CD4+ T cells and γδ T cells. Analysis of Ki67 in CD57+ KLRG1+ T cells revealed that only a small proportion of these cells was proliferating. Comparative analysis of CD8+ and CD4+ T cells isolated from matched blood and muscle samples donated by three patients indicated a consistent pattern of more pronounced alterations in muscles, although not significant due to small sample size. In the T-LGLHIGH patient group, we found increased frequencies of perforin-producing CD8+ and CD4+ T cells that were moderately correlated to combined CD57 and KLRG1 expression. Investigation of the HLA haplotypes of 75 IBM patients identified that carriage of the HLA-C*14:02:01 allele was significantly higher in T-LGLHIGH compared to T-LGLLOW individuals. Expansion of T-LGL was not significantly associated with seropositivity patient status for anti-cytosolic 5'-nucleotidase 1A autoantibodies. Clinically, the age at disease onset and disease duration were similar in the T-LGLHIGH and T-LGLLOW patient groups. However, metadata analysis of functional alterations indicated that patients with expanded T-LGL more frequently relied on mobility aids than T-LGLLOW patients indicating greater disease severity.

Conclusion: Altogether, these results suggest that T-LGL expansion occurring in IBM patients is correlated with exacerbated immune dysregulation and increased disease burden.

Keywords: KLRG1; T cell large granular lymphocytes; inclusion body myositis; inhibitory natural killer receptors; senescence.


Conflict of interest statement

The authors declare that the research was conducted in the absence of any commercial or financial relationships that could be construed as a potential conflict of interest.

Figures

Figure 1
Figure 1
Flowchart of selection criteria for T-LGLHIGH patients.
Figure 2
Figure 2
LGLs are enlarged cells with granular content. (A) Representative LGL cell showing increased size (15μm) with multiple cytotoxic granules (arrow). Small arrowheads indicate platelets. The image was taken at 100x magnification. (B) Forward (FS-A) and Side (SS-A) Scatter area measures of representative blood samples from the HC, T-LGLLOW and -HIGH patient groups. Comparative SS-A and FS-A parameter measures are illustrated for the CD3+CD57+ (red histograms) and the CD3+CD57- cells (blue histograms) subsets.
Figure 3
Figure 3
Immunophenotyping of CD3+ T cells in HC and IBM patients. (A) UMAP heat-map analysis. We selected a total of 50,000 T cells per donor group (HC n=54, T-LGLNEG n=42, T-LGLPOS n=17), and concatenated into a single matrix. T cells were identified based on the signal expression intensity of the phenotypical markers TCRαβ, CD4, CD8, CD57, CD5, CD94, and KLRG1. (B) Median frequency of surface markers in CD8+CD57+ T cells. Statistical analysis was performed individually for each surface antigen using the Kruskal-Wallis ANOVA with Dunn’s post-hoc test for multiple comparisons. Healthy controls (n=56), IBM T-LGLLOW (n=51), and IBM T-LGLHIGH (n=34). KLRG1 was analyzed in HC (n=54), IBM T-LGLLOW (n=41), and IBM T-LGLHIGH patients (n=17). The full comparison of the descriptive statistics for each surface marker is shown in Supplementary Table 2 . (C). Principal Component Analysis of immune cell phenotypes in CD8+CD57+ T cells. Each immunophenotype was visualized in 2 dimensions (PC1 and PC2). **** : P < 0.0001.
Figure 4
Figure 4
Proportion of Ki67 between HC and IBM. (A) UMAP analysis. we selected a total of 20,000 T cells per donor group (HC n=19, T-LGLNEG n=31, T-LGLHIGH n=8), and concatenated into a single matrix. T cells were identified based on the number of cells expressing phenotypical markers CD4, CD8, CD57, KLRG1 and Ki67. (B) Percentage of Ki67-expressing CD8+ T cells in the CD57-/+, KLRG1-/+ subsets in IBM T-LGLHIGH patients (n=8). (C) Percentage of CD8+ CD57+KLRG1+ T cells expressing Ki67 in the HC and IBM T-LGLLOW and T-LGLHIGH donor groups. Statistical analysis was performed using Friedman test with Dunn’s post-hoc test for multiple comparisons. The P-values are indicated; NS= Not Significant. (D) Representative flow cytometry biplot and histograms showing the median frequency of Ki67 in the three CD57-/+, KLRG1-/+ populations.
Figure 5
Figure 5
Immunophenotyping of T cell populations in healthy controls, IBM T-LGLLOW, and IBM T-LGLHIGH. Frequency of CD57+CD5DIM cells (A), CD94+ T cells (B), CD56+ T cells (C), and KLRG1+ cells (D) in CD4+, CD8+ and γδ T cells (identified as CD3+, TCRαβ- cells). Statistical analysis was performed individually for each surface antigen using the Scheirer–Ray–Hare analysis for Factor analysis with Tukey post-hoc test for multiple comparisons. Healthy controls (n=56, grey violin plots), IBM T-LGLLOW (n=51, purple violin plots), and IBM T-LGLHIGH (n=34, orange violin plots). ** : P < 0.01, *** : P < 0.001, **** : P < 0.0001. KLRG1 was analyzed in HC (n=54), IBM T-LGLLOW (n=41), and IBM T-LGLHIGH patients (n=17). The full comparison of the descriptive statistics for each surface marker and representative flow cytometry plots are shown in Supplementary Table 2 .
Figure 6
Figure 6
Comparison of CD8+ and CD4+ T cell phenotype in blood and muscle. Representative Flow cytometry plots gated on (A) and CD4+ T cells (B). Comparison of the proportion in blood and muscle of CD57+ in CD8+ (C) and CD4+ (H) T cells, and of CD5DIM, CD94+, CD56+ and KLRG1+ in CD8+CD57+ (D–G) and in CD4+CD57+ (I–L) cells. Statistical analysis was performed using one-tailed Wilcoxon matched pairs signed rank test T-LGLHIGH n=2, T-LGLLOW n=1). NS, Not Significant.
Figure 7
Figure 7
Inflammatory and cytotoxic potential of CD8+ and CD4+ T cells in healthy controls, IBM T-LGLLOW, and IBM T-LGLHIGH. (A) Median frequency of IFN-γ in CD8+ T cells HC (n=40), IBM T-LGLLOW (n=45), and IBM T-LGLHIGH (n=22). (B) Median frequency of perforin in CD8+ T cells HC (n=40), IBM T-LGLLOW (n=47), and IBM T-LGLHIGH (n=29). (C) Median frequency of IFN-γ +perforin+ in CD8+ T cells HC (n=40), IBM T-LGLLOW (n=45), and IBM T-LGLHIGH (n=22). (D) Median frequency of IFN-γ in CD4+ T cells HC (n=40), IBM T-LGLLOW (n=45), and IBM T-LGLHIGH (n=22). (E) Median frequency of perforin in CD4+ T cells HC (n=40), IBM T-LGLLOW (n=47), and IBM T-LGLHIGH (n=29). (F) Median frequency of IFN-γ+ perforin+ in CD4+ T cells HC (n=40), IBM T-LGLLOW (n=45), and IBM T-LGLHIGH (n=22). Statistical analysis was performed using Kruskal-Wallis ANOVA and Bonferroni post hoc test for multiple comparisons. The P-values are indicated; NS, Not Significant. (G) Spearman’s correlation between the proportion of CD8+ IFN-γ+ and CD57+KLRG1+ cells in T-LGLLOW (n=23) and T-LGLHIGH patients (n=11). (H) Spearman’s correlation between the proportion of CD8+ perforin+ and CD57+KLRG1+ cells in T-LGLLOW (n=23) and T-LGLHIGH patients (n=11). (I) Spearman’s correlation between the proportion of CD8+IFN-γ+ perforin+ and CD57+KLRG1+ cells in T-LGLLOW (n=38) and T-LGLHIGH patients (n=12). (J) Spearman’s correlation between the proportion of CD4+ IFN-γ+ and CD57+KLRG1+ cells in T-LGLLOW (n=23) and T-LGLHIGH patients (n=11). (K) Spearman’s correlation between the proportion of CD4+perforin+ and CD57+KLRG1+ cells in T-LGLLOW (n=23) and T-LGLHIGH patients (n=11). (L) Spearman’s correlation between the proportion of CD4+ IFN-γ+ perforin+ and CD57+KLRG1+ cells in T-LGLLOW (n=38) and T-LGLHIGH patients (n=12).
Figure 8
Figure 8
Comparison of HLA Class I and Class II allele frequency (%) between IBM T-LGLLOW and IBM T-LGLHIGH patients. Comparative analysis of HLA allele frequencies in 43 T-LGLLOW and 29 T-LGLHIGHIBM patients was performed using the Fisher’s exact test. Minor alleles present at a frequency less than 5% in either group were omitted.
Figure 9
Figure 9
Clinical correlations of T-LGL expansions within IBM patients. (A, B) Spearman’s correlation between the proportion of CD8+CD57+KLRG1+ versus age in H.C (n=54) and IBM (n=59) respectively. (C–E) Spearman’s correlation shows the duration of IBM duration of symptoms (years) versus the proportion of CD8+CD57+KLRG1+ and CD4+CD57+KLRG1+ and γδ CD57+KLRG1+ respectively (n=52). (F) Difference between the age at onset (years) in IBM T-LGLLOW patients (n=43) and IBM T-LGLHIGH patients (n=32). Statistical analysis was performed using the two-tailed Mann-Whitney test for non-parametric data. (G) Difference between the duration of IBM symptoms (years) between IBM T-LGLLOW (n=43) and IBM T-LGLHIGH (n=32). Statistical analysis was performed using the two-tailed Mann-Whitney test for non-parametric data. (H) Graphical Representation shows the proportion of IBM patients and the various mobility aids used among IBM T-LGLLOW patients (n=29) and IBM T-LGLHIGH patients (n=20). Statistical analysis was performed using Pearson’s Chi-Square analysis. The P-values are indicated; NS, Not Significant.

References

    1. Naddaf E, Barohn RJ, Dimachkie MM. Inclusion body myositis: Update on pathogenesis and treatment. Neurotherapeutics (2018) 15(4):995–1005. doi: 10.1007/s13311-018-0658-8 - DOI - PMC - PubMed
    1. Allenbach Y, Chaara W, Rosenzwajg M, Six A, Prevel N, Mingozzi F, et al. . Th1 response and systemic treg deficiency in inclusion body myositis. PLoS One (2014) 9(3):e88788. doi: 10.1371/journal.pone.0088788 - DOI - PMC - PubMed
    1. Greenberg SA, Pinkus JL, Kong SW, Baecher-Allan C, Amato AA, Dorfman DM. Highly differentiated cytotoxic T cells in inclusion body myositis. Brain (2019) 142(9):2590–604. doi: 10.1093/brain/awz207 - DOI - PubMed
    1. Amlani A, Choi MY, Tarnopolsky M, Brady L, Clarke AE, Garcia-De La Torre I, et al. . Anti-Nt5c1a autoantibodies as biomarkers in inclusion body myositis. Front Immunol (2019) 10:745. doi: 10.3389/fimmu.2019.00745 - DOI - PMC - PubMed
    1. Goyal NA, Cash TM, Alam U, Enam S, Tierney P, Araujo N, et al. . Seropositivity for Nt5c1a antibody in sporadic inclusion body myositis predicts more severe motor, bulbar and respiratory involvement. J Neurol Neurosurg Psychiatry (2016) 87(4):373–8. doi: 10.1136/jnnp-2014-310008 - DOI - PMC - PubMed

Publication types