

Uncovering the cytotoxic effects of air pollution with multi-modal imaging of in vitro respiratory models
- PMID: 37063998
- PMCID: PMC10090883
- DOI: 10.1098/rsos.221426
Uncovering the cytotoxic effects of air pollution with multi-modal imaging of in vitro respiratory models
Abstract
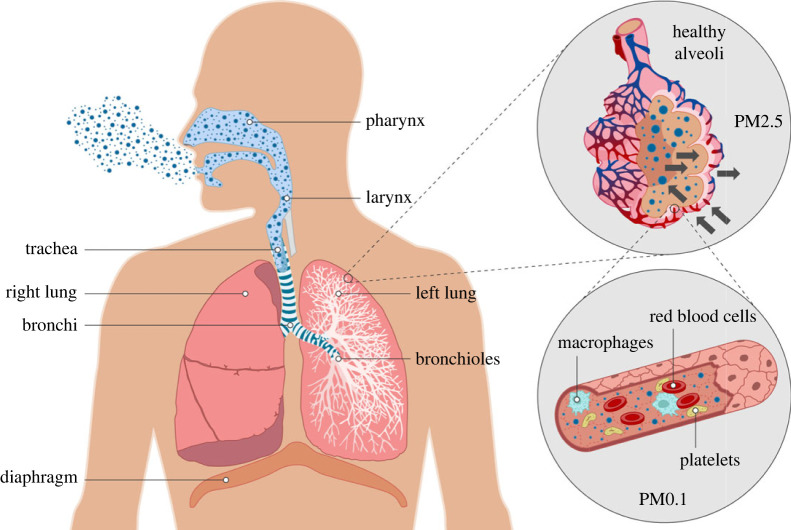
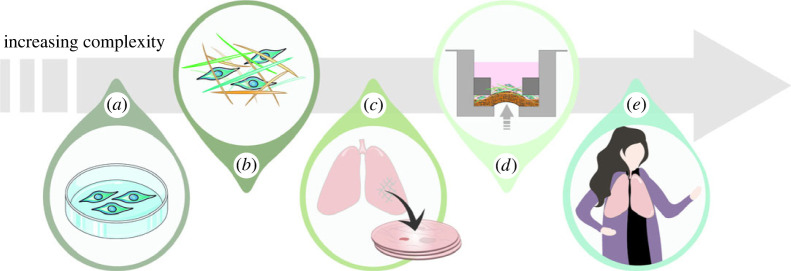
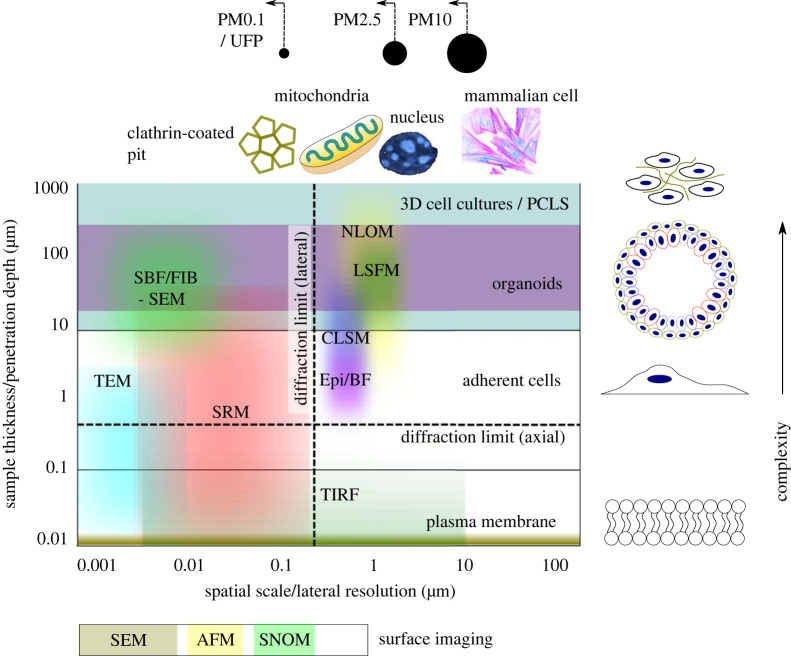
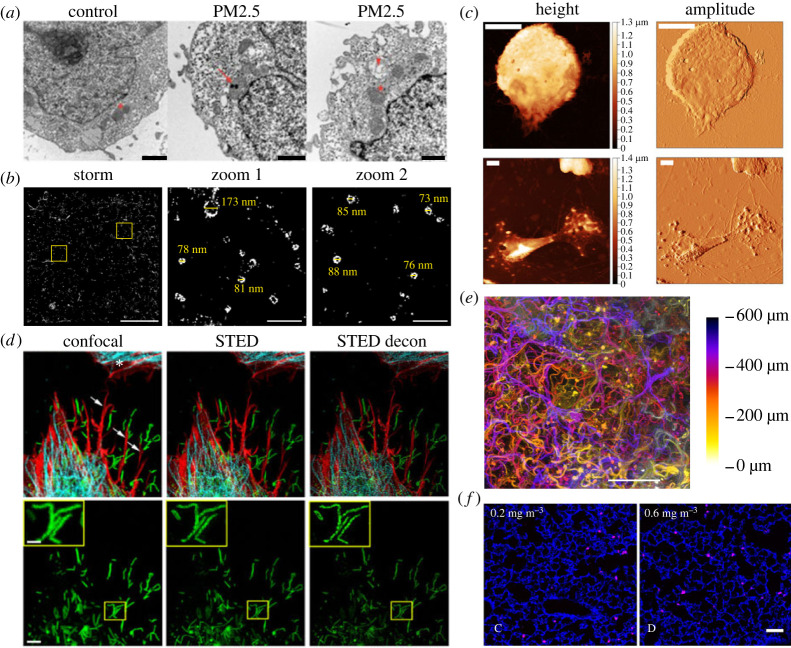
Annually, an estimated seven million deaths are linked to exposure to airborne pollutants. Despite extensive epidemiological evidence supporting clear associations between poor air quality and a range of short- and long-term health effects, there are considerable gaps in our understanding of the specific mechanisms by which pollutant exposure induces adverse biological responses at the cellular and tissue levels. The development of more complex, predictive, in vitro respiratory models, including two- and three-dimensional cell cultures, spheroids, organoids and tissue cultures, along with more realistic aerosol exposure systems, offers new opportunities to investigate the cytotoxic effects of airborne particulates under controlled laboratory conditions. Parallel advances in high-resolution microscopy have resulted in a range of in vitro imaging tools capable of visualizing and analysing biological systems across unprecedented scales of length, time and complexity. This article considers state-of-the-art in vitro respiratory models and aerosol exposure systems and how they can be interrogated using high-resolution microscopy techniques to investigate cell-pollutant interactions, from the uptake and trafficking of particles to structural and functional modification of subcellular organelles and cells. These data can provide a mechanistic basis from which to advance our understanding of the health effects of airborne particulate pollution and develop improved mitigation measures.
Keywords: bioimaging; cell and tissue culture models; microscopy; respiratory toxicology.
© 2023 The Authors.
Conflict of interest statement
We declare we have no competing interests.
Figures
Similar articles
-
Mortality and Morbidity Effects of Long-Term Exposure to Low-Level PM2.5, BC, NO2, and O3: An Analysis of European Cohorts in the ELAPSE Project.Res Rep Health Eff Inst. 2021 Sep;2021(208):1-127. Res Rep Health Eff Inst. 2021. PMID: 36106702 Free PMC article.
-
Mortality-Air Pollution Associations in Low Exposure Environments (MAPLE): Phase 2.Res Rep Health Eff Inst. 2022 Jul;2022(212):1-91. Res Rep Health Eff Inst. 2022. PMID: 36224709 Free PMC article.
-
Understanding the Early Biological Effects of Isoprene-Derived Particulate Matter Enhanced by Anthropogenic Pollutants.Res Rep Health Eff Inst. 2019 Mar;2019(198):1-54. Res Rep Health Eff Inst. 2019. PMID: 31872748 Free PMC article.
-
Lung toxicity of particulates and gaseous pollutants using ex-vivo airway epithelial cell culture systems.Environ Pollut. 2022 Jul 15;305:119323. doi: 10.1016/j.envpol.2022.119323. Epub 2022 Apr 18. Environ Pollut. 2022. PMID: 35447256 Review.
-
Assessing Adverse Health Effects of Long-Term Exposure to Low Levels of Ambient Air Pollution: Implementation of Causal Inference Methods.Res Rep Health Eff Inst. 2022 Jan;2022(211):1-56. Res Rep Health Eff Inst. 2022. PMID: 36193708 Free PMC article. Review.
Cited by
-
The different response of PM2.5 stimulated nasal epithelial spheroids in control, asthma and COPD groups.Respir Res. 2025 Jan 8;26(1):8. doi: 10.1186/s12931-025-03097-w. Respir Res. 2025. PMID: 39780154 Free PMC article.
-
Integrating 4-D light-sheet fluorescence microscopy and genetic zebrafish system to investigate ambient pollutants-mediated toxicity.Sci Total Environ. 2023 Dec 1;902:165947. doi: 10.1016/j.scitotenv.2023.165947. Epub 2023 Aug 3. Sci Total Environ. 2023. PMID: 37543337 Free PMC article. Review.
-
Household air pollution and respiratory health in Africa: persistent risk and unchanged health burdens.Curr Opin Pulm Med. 2025 Mar 1;31(2):89-97. doi: 10.1097/MCP.0000000000001126. Epub 2024 Oct 18. Curr Opin Pulm Med. 2025. PMID: 39410863 Free PMC article. Review.
-
Multiparametric physicochemical analysis of a type 1 collagen 3D cell culture model using light and electron microscopy and mass spectrometry imaging.Sci Rep. 2025 Mar 20;15(1):9578. doi: 10.1038/s41598-025-93700-3. Sci Rep. 2025. PMID: 40113888 Free PMC article.
References
-
- WHO. 2018 9 out of 10 people worldwide breathe polluted air, but more countries are taking action. See https://www.who.int/news-room/detail/02-05-2018-9-out-of-10-people-world... (accessed 1 July 2020).
-
- GBD 2017 Risk Factor Collaborators. 2018. Global, regional, and national comparative risk assessment of 84 behavioural, environmental and occupational, and metabolic risks or clusters of risks for 195 countries and territories, 1990–2017: a systematic analysis for the Global Burden of Disease Study 2017. Lancet 392, 1923-1994. ( 10.1016/S0140-6736(18)32225-6) - DOI - PMC - PubMed
Publication types
Grants and funding
LinkOut - more resources
Full Text Sources
