Upregulation of the ferroptosis-related STEAP3 gene is a specific predictor of poor triple-negative breast cancer patient outcomes
- PMID: 37064114
- PMCID: PMC10102497
- DOI: 10.3389/fonc.2023.1032364
Upregulation of the ferroptosis-related STEAP3 gene is a specific predictor of poor triple-negative breast cancer patient outcomes
Abstract
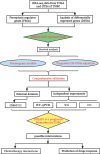
Objective: This study was designed to assess ferroptosis regulator gene (FRG) expression patterns in patients with TNBC based on data derived from The Cancer Genome Atlas (TCGA). Further, it was utilized to establish a TNBC FRG signature, after which the association between this signature and the tumor immune microenvironment (TIME) composition was assessed, and relevant prognostic factors were explored.
Methods: The TCGA database was used to obtain RNA expression datasets and clinical information about 190 TNBC patients, after which a prognostic TNBC-related FRG signature was established using a least absolute shrinkage and selection operator (LASSO) Cox regression approach. These results were validated with separate data from the Gene Expression Omnibus (GEO). The TNBC-specific prognostic gene was identified via this method. The STEAP3 was then validated through Western immunoblotting, immunohistochemical staining, and quantitative real-time polymerase chain reaction (RT-qPCR) analyses of clinical tissue samples and TNBC cell lines. Chemotherapy interactions and predicted drug sensitivity studies were investigated to learn more about the potential clinical relevance of these observations.
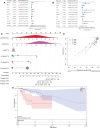
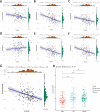
Results: These data revealed that 87 FRGs were differentially expressed when comparing TNBC tumors and healthy tissue samples (87/259, 33.59%). Seven of these genes (CA9, CISD1, STEAP3, HMOX1, DUSP1, TAZ, HBA1) are significantly related to the overall survival of TNBC patients. Kaplan-Meier analyses and established FRG signatures and nomograms identified CISD1 and STEAP3 genes of prognostic relevance. Prognostic Risk Score values were positively correlated with the infiltration of CD4+ T cells (p = 0.001) and myeloid dendritic cells (p =0.004). Further evidence showed that STEAP3 was strongly and specifically associated with TNBC patient OS (P<0.05). The results above were confirmed by additional examinations of STEAP3 expression changes in TNBC patient samples and cell lines. High STEAP3 levels were negatively correlated with half-maximal inhibitory concentration (IC50) values for GSK1904529A (IGF1R inhibitor), AS601245 (JNK inhibitor), XMD8-85 (Erk5 inhibitor), Gefitinib, Sorafenib, and 5-Fluorouracil (P < 0.05) in patients with TNBC based on information derived from the TCGA-TNBC dataset.
Conclusion: In the present study, a novel FRG model was developed and used to forecast the prognosis of TNBC patients accurately. Furthermore, it was discovered that STEAP3 was highly overexpressed in people with TNBC and associated with overall survival rates, laying the groundwork for the eventually targeted therapy of individuals with this form of cancer.
Keywords: STEAP3; ferroptosis; overall survival; prognostic signature; triple-negative breast cancer (TNBC).
Copyright © 2023 Yuan, Liu, Bao, Qu, Xiang and Sun.
Conflict of interest statement
The authors declare that the research was conducted in the absence of any commercial or financial relationships that could be construed as a potential conflict of interest.
Figures


Similar articles
-
Ferroptosis and Triple-Negative Breast Cancer: A Systematic Overview of Prognostic Insights and Therapeutic Potential.Cureus. 2024 Jan 5;16(1):e51719. doi: 10.7759/cureus.51719. eCollection 2024 Jan. Cureus. 2024. PMID: 38318597 Free PMC article. Review.
-
Identification of a Novel Ferroptosis-Related Gene Prognostic Signature in Bladder Cancer.Front Oncol. 2021 Sep 7;11:730716. doi: 10.3389/fonc.2021.730716. eCollection 2021. Front Oncol. 2021. PMID: 34557413 Free PMC article.
-
Identification and Validation of a Novel Glycolysis-Related Gene Signature for Predicting the Prognosis and Therapeutic Response in Triple-Negative Breast Cancer.Adv Ther. 2023 Jan;40(1):310-330. doi: 10.1007/s12325-022-02330-y. Epub 2022 Nov 1. Adv Ther. 2023. PMID: 36316558
-
Identification of STEAP3-based molecular subtype and risk model in ovarian cancer.J Ovarian Res. 2023 Jun 29;16(1):126. doi: 10.1186/s13048-023-01218-x. J Ovarian Res. 2023. PMID: 37386521 Free PMC article.
-
Construction and Validation of a Prognostic Risk Model for Triple-Negative Breast Cancer Based on Autophagy-Related Genes.Front Oncol. 2022 Feb 4;12:829045. doi: 10.3389/fonc.2022.829045. eCollection 2022. Front Oncol. 2022. PMID: 35186763 Free PMC article.
Cited by
-
Ferroptosis in TNBC: interplay with tumor-infiltrating immune cells and therapeutic implications.Mol Cell Biochem. 2025 May 29. doi: 10.1007/s11010-025-05305-z. Online ahead of print. Mol Cell Biochem. 2025. PMID: 40439838 Review.
-
STEAP3 Affects Ovarian Cancer Progression by Regulating Ferroptosis through the p53/SLC7A11 Pathway.Mediators Inflamm. 2024 Feb 26;2024:4048527. doi: 10.1155/2024/4048527. eCollection 2024. Mediators Inflamm. 2024. PMID: 38440354 Free PMC article.
-
A Novel Prognostic Signature of Mitophagy-Related E3 Ubiquitin Ligases in Breast Cancer.Int J Mol Sci. 2025 Feb 12;26(4):1551. doi: 10.3390/ijms26041551. Int J Mol Sci. 2025. PMID: 40004017 Free PMC article.
-
STEAP3 promotes triple-negative breast cancer growth through the FGFR1-mediated activation of PI3K/AKT/mTOR signaling.iScience. 2025 Apr 24;28(6):112526. doi: 10.1016/j.isci.2025.112526. eCollection 2025 Jun 20. iScience. 2025. PMID: 40487427 Free PMC article.
-
Ferroptosis and Triple-Negative Breast Cancer: A Systematic Overview of Prognostic Insights and Therapeutic Potential.Cureus. 2024 Jan 5;16(1):e51719. doi: 10.7759/cureus.51719. eCollection 2024 Jan. Cureus. 2024. PMID: 38318597 Free PMC article. Review.
References
LinkOut - more resources
Full Text Sources
Research Materials
Miscellaneous

