. 2023 Mar 31:11:1066391.
doi: 10.3389/fbioe.2023.1066391. eCollection 2023.

Development of a biomarker signature using grating-coupled fluorescence plasmonic microarray for diagnosis of MIS-C

Affiliations

Development of a biomarker signature using grating-coupled fluorescence plasmonic microarray for diagnosis of MIS-C

Michele Maltz-Matyschsyk et al. Front Bioeng Biotechnol. .

Abstract

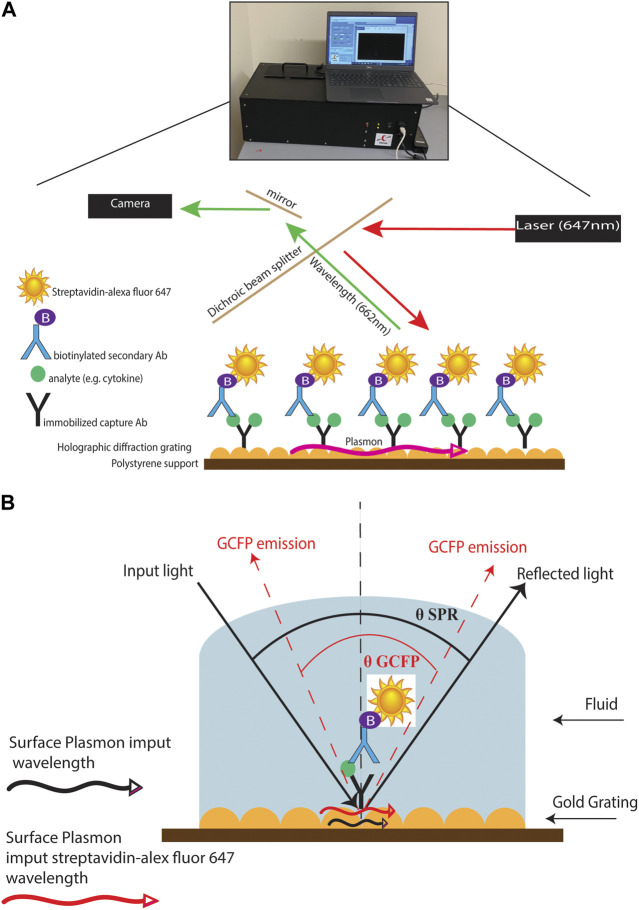
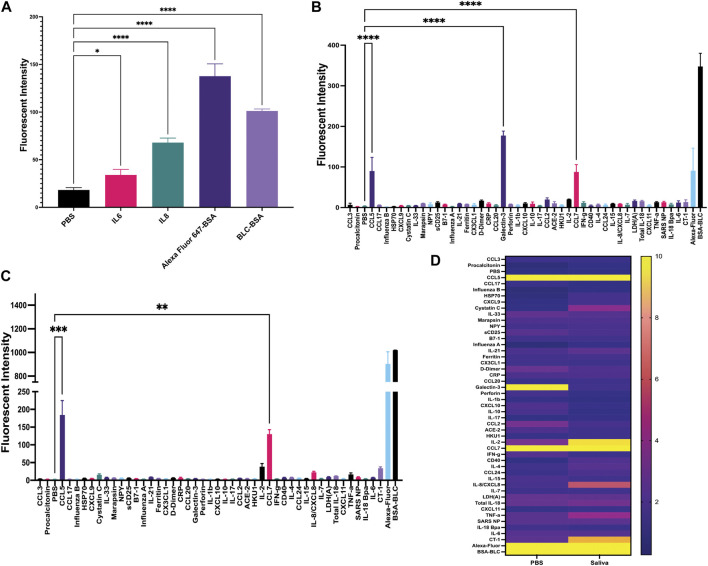
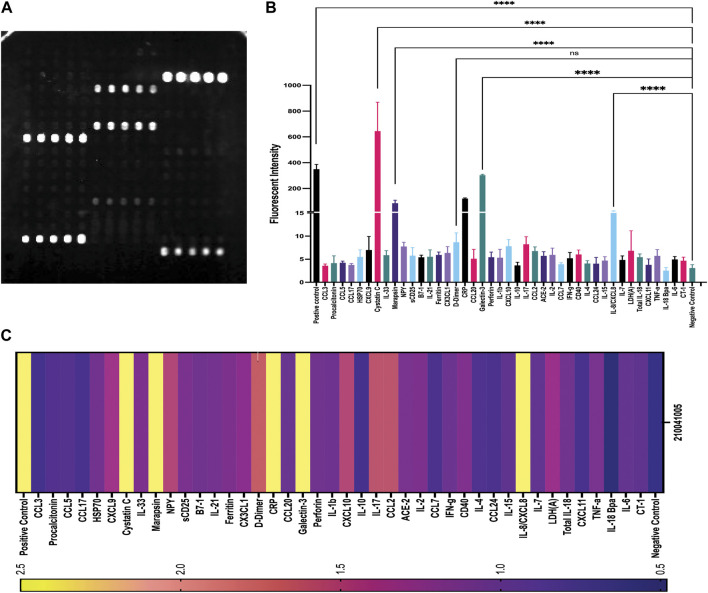
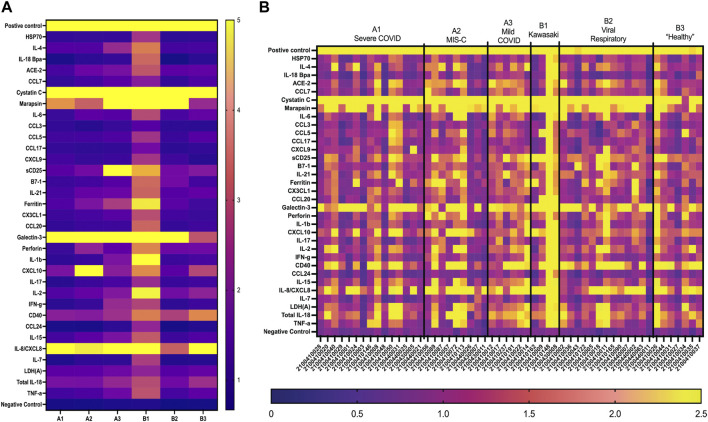
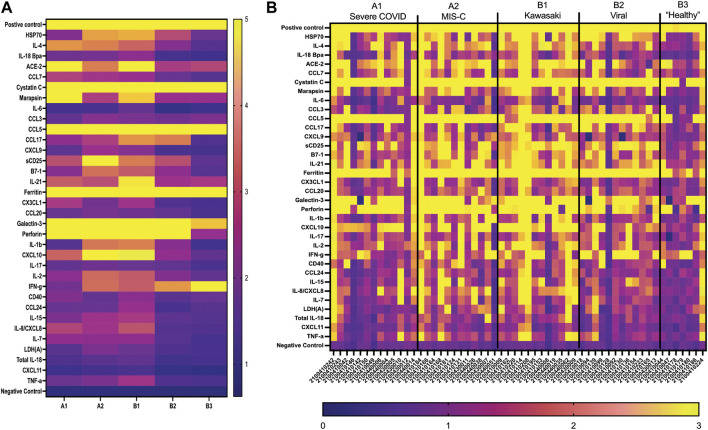
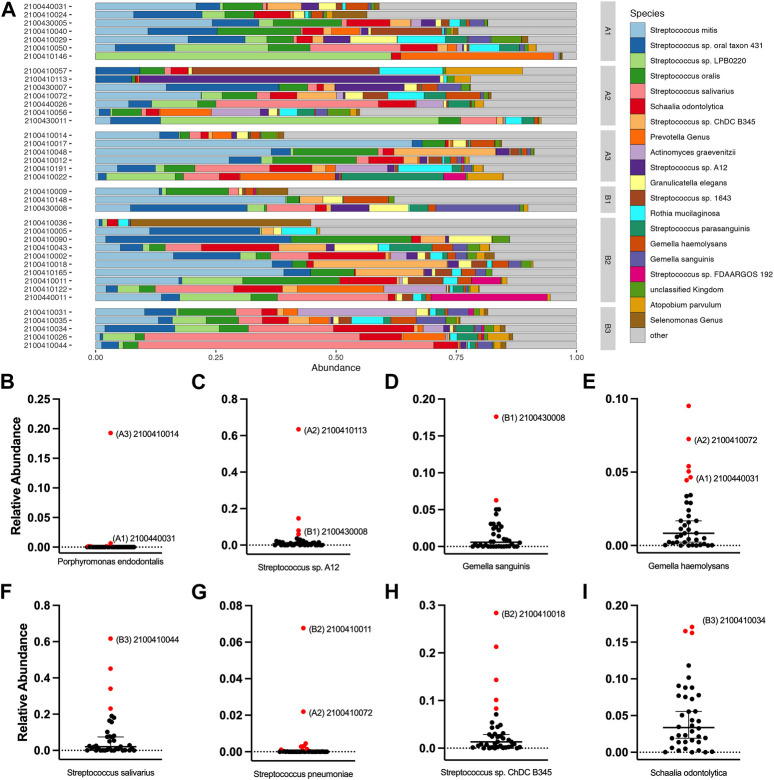
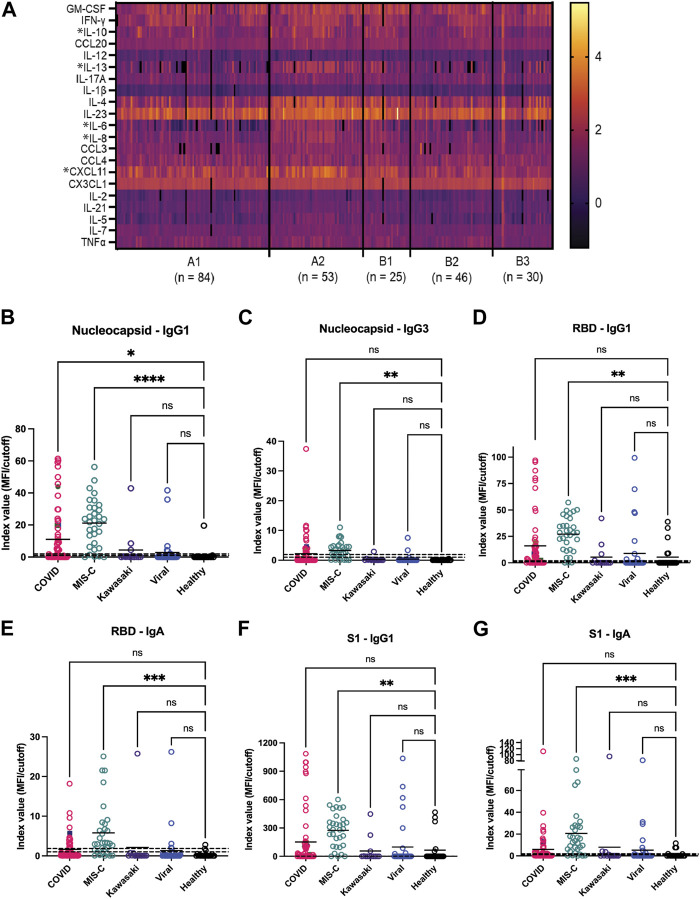
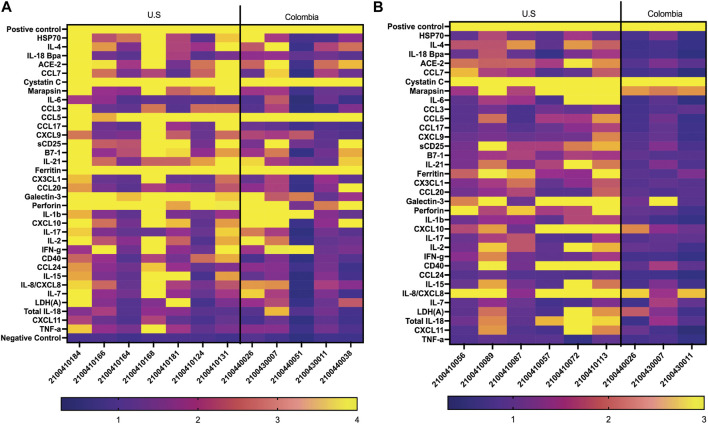
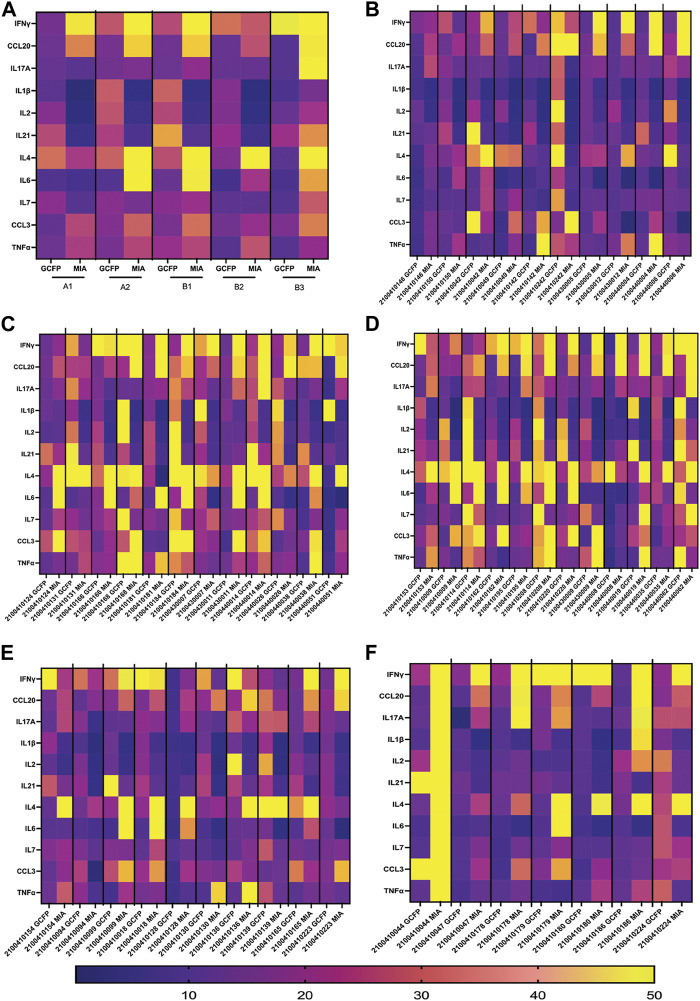
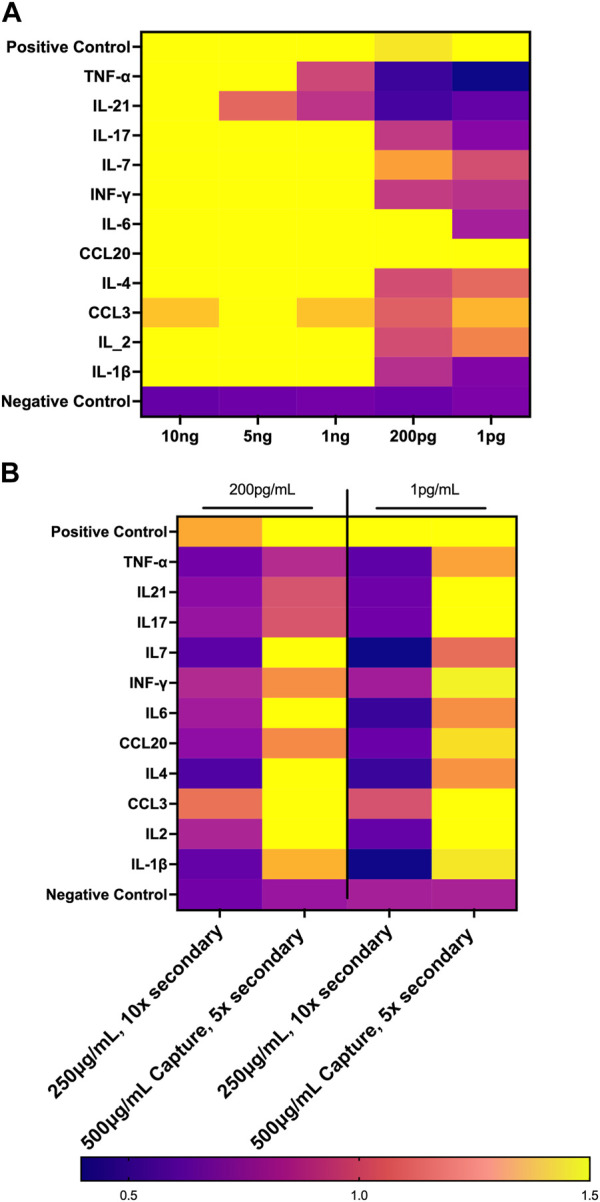
Multisystem inflammatory syndrome in children (MIS-C) is a rare but serious condition that can develop 4-6 weeks after a school age child becomes infected by SARS-CoV-2. To date, in the United States more than 8,862 cases of MIS-C have been identified and 72 deaths have occurred. This syndrome typically affects children between the ages of 5-13; 57% are Hispanic/Latino/Black/non-Hispanic, 61% of patients are males and 100% have either tested positive for SARS-CoV-2 or had direct contact with someone with COVID-19. Unfortunately, diagnosis of MIS-C is difficult, and delayed diagnosis can lead to cardiogenic shock, intensive care admission, and prolonged hospitalization. There is no validated biomarker for the rapid diagnosis of MIS-C. In this study, we used Grating-coupled Fluorescence Plasmonic (GCFP) microarray technology to develop biomarker signatures in pediatric salvia and serum samples from patients with MIS-C in the United States and Colombia. GCFP measures antibody-antigen interactions at individual regions of interest (ROIs) on a gold-coated diffraction grating sensor chip in a sandwich immunoassay to generate a fluorescent signal based on analyte presence within a sample. Using a microarray printer, we designed a first-generation biosensor chip with the capability of capturing 33 different analytes from 80 μ L of sample (saliva or serum). Here, we show potential biomarker signatures in both saliva and serum samples in six patient cohorts. In saliva samples, we noted occasional analyte outliers on the chip within individual samples and were able to compare those samples to 16S RNA microbiome data. These comparisons indicate differences in relative abundance of oral pathogens within those patients. Microsphere Immunoassay (MIA) of immunoglobulin isotypes was also performed on serum samples and revealed MIS-C patients had several COVID antigen-specific immunoglobulins that were significantly higher than other cohorts, thus identifying potential new targets for the second-generation biosensor chip. MIA also identified additional biomarkers for our second-generation chip, verified biomarker signatures generated on the first-generation chip, and aided in second-generation chip optimization. Interestingly, MIS-C samples from the United States had a more diverse and robust signature than the Colombian samples, which was also illustrated in the MIA cytokine data. These observations identify new MIS-C biomarkers and biomarker signatures for each of the cohorts. Ultimately, these tools may represent a potential diagnostic tool for use in the rapid identification of MIS-C.

Keywords: COVID-19; MIS-C; biomarkers; diagnostic; microarray.


Conflict of interest statement

ML has intellectual property (U.S. Patent #7,655,421) related to functional phenotyping of leukocytes by SPR microarray. ML, MM-M, DL, and JG have ongoing, NIH-funded, collaborations with Ciencia, Inc. The remaining authors declare that the research was conducted in the absence of any commercial or financial relationships that could be construed as a potential conflict of interest.

Figures

FIGURE 1
FIGURE 1
GCFP assay and wavelength pathway. (A) Capture antibodies are immobilized onto a gold-coated nanoscale grating surface chip by pin spotting. Chips were then fitted with plexiglass windows and gaskets to create a flow cell for fluid to pass over the surface of the printed chip. Fluid containing potential analytes can then be run over the assembled chip, followed by biotinylated secondary antibodies and then streptavidin-Alexafluor647, with washes in between steps with PSB-T. The chip can then be placed in a GCFP reader where a laser illuminates the chip and the fluorescence intensity is collected with a camera and each ROI is analyzed using Enhanced Fluorescence Reader software, V2.3. (B). Under normal SPR optical conditions, the energy of the light excites electron density oscillation (the plasmon) within the metal coating on the sensor chip, reducing the intensity of the reflected light (Black lines). Using the diffraction grating on the chip, the wave vector of the illuminating beam of light can be matched with the plasmon wave vector (red lines). The gold grating plus the use of a fluorophore increases the collected light, thereby enhancing the signal (red lines).
FIGURE 2
FIGURE 2
Development of sandwich-based ELISA assay on a gold-coated nanoscale grating surface chip. (A) Capture antibodies for IL-6 and IL-8 were immobilized onto the chip, along with the negative control (PBS) and two positive controls; biotin-BSA (BLC-BSA, to show streptavidin binding) and Alexafluor 647-BSA (to show stabilization during washing), 20 ng/mL of recombinant IL-6 and IL-8 were flowed over the chip. The fluorescence intensity was collected as previously described. Fluorescent intensity within the ROIs for IL-6, IL-8 and positive controls was significantly higher than the negative control. (B) Forty-two capture antibodies were immobilized onto the chip, 20 ng/mL each of recombinant CCL5, galactin-3 and CCL7 diluted in PBS was run over the chip and the fluorescence intensity was collecting for each ROI as previously described. The fluorescent intensity within the ROIs for CCL5, galactin-3 and CCL7 were significantly higher than the negative control. (C) Forty-two capture antibodies were immobilized onto the chip, 20 ng/mL of recombinant protein CCL5 and CCL7 diluted in human saliva was run over the chip and the fluorescence intensity was collected for each ROI as previously described. The fluorescent intensity within the ROIs for CCL5 and CCL7 were significantly higher than the negative control. (D) A heat map was generated using the detection ratio, which was normalized to the negative control to compare data in B and (C). One-way ANOVA analysis was performed (* = p< 0.05, ** = p< 0.01, *** = p< 0.001, **** = p< 0.0001. The data are presented as the average of five ROIs for each analyte ( ± standard error of the mean).
FIGURE 3
FIGURE 3
Example of patient (210041005) data generated from GCFP assay. (A) Forty-two unique capture antibodies were immobilized on regions of interest in sets of 5 ROIs on the chip and patient sample number 210041005 was run over the chip and an image of the GCFP sensor chip output was captured. (B) Fluorescent intensity within the ROIs were collected as previously described, detecting cystatin C, Marapsin, D-dimer, galaectin-3, and IL-8. (C) A heat map of the detection ratio was generated and shows detection of the same analytes as in (B). One-way ANOVA analysis was performed (* = p< 0.05, ** = p< 0.01, *** = p< 0.001, **** = p< 0.0001. The data are presented as the average of five ROIs for each analyte ( ± standard error of the mean).
FIGURE 4
FIGURE 4
GCFP detection ratio for patient saliva samples. Saliva samples obtained from each of the patient cohorts; 54 samples (A1 = 15, A2 = 9, A3 = 6, B1 = 4, B2 = 13, B3 = 7) were run over the first-generation biosensor chip. (A) Heat maps generated for each cohort using the mean detection ratio for each analyte, showing candidate biomarkers for the A2 (CXCL10), A3 (sDC25) and B1(IL-1β and IL-2) cohorts. (B) Heat maps generated for each individual patient demonstrate individual variation in disease state.
FIGURE 5
FIGURE 5
GCFP detection ratio for serum samples from patient cohorts. Serum samples from each of the cohorts were tested on the first generation GCFP biosensor chip. 56 samples (A1 = 13, A2 = 12, B1 = 12, B2 = 12, B3 = 7) were tested. (A) Heat maps generated for each cohort using the mean detection ratio for each analyte, showing a more robust signature per cohort then within saliva. (B) Heat maps generated for each patient, showing individual variation in disease state.
FIGURE 6
FIGURE 6
Salivary microbiome of samples analyzed using GCFP. From saliva samples analyzed by GCFP using the first generation GCFP biosensor chip, 34 samples were also analyzed by 16S RNA high throughput sequencing. Relative abundance at species level was calculated. (A) Relative abundance of the top 20 most abundant taxa across all samples. (B–I) Plots of the relative abundance for 8 bacterial species that were elevated in one or more outlier samples from analyte data. Error bars represent a 95% confidence interval of the median. Points in red were identified as outliers by the ROUT method. Samples that were analyte outliers and had an increase in that species are labeled with their cohort.
FIGURE 7
FIGURE 7
Potential analytes found by MIA can inform the evolving composition of a second generation GCFP biosensor chip. (A) A heat map was generated from microsphere immunoassay from serum samples for each cohort. * Indicates a significant difference in that cytokine for the A2 cohort for CXCL11, IL-8, IL-6, IL-4, IL-13, & IL-10 analytes. (B–G) The antibody response to the SARS-CoV-2 nucleocapsid and spike components (full spike, RBD, S1, S2), the MIS-C cohort had a significantly higher IgA response to SARS-COV-2 spike domains as compared to the COVID-19 cohort. One-way ANOVA analysis was performed (* = p< 0.05, ** = p< 0.01, *** = p< 0.001, **** = p< 0.0001.
FIGURE 8
FIGURE 8
Comparison of USA vs. Colombia MIS-C patient samples by GCFP microarray. (A) Heat map of A2 serum samples comparing USA to Colombia samples. The USA patient population has a more robust signature. (B) Heat of A2 saliva samples comparing USA to Colombia samples, USA has a more robust signature.
FIGURE 9
FIGURE 9
Serum from Cohorts and individual patient comparison of GCFP microarray assay to MIA. To compare a traditional MIA with the GCFP microarray, 11 analytes were included in both assays. (A) A heat map was generated by log transforming GCFP detection ratios and using the mean of each analyte detection ratio for each cohort. Of the 11 analytes, 5 were below the detection limit of the GCFP first generation biosensor chip. (B) A heat map generated by log transforming GCFP detection ratios from individual serum samples from cohort A1. (C) A heat map generated by log transforming GCFP detection ratios from individual serum samples from cohort A2. (D) A heat map generated by log transforming GCFP detection ratios from individual serum samples from cohort B1. (E) A heat map generated by log transforming GCFP detection ratios from individual serum samples from cohort B2. (F) A heat map generated by log transforming GCFP detection ratios from individual serum samples from cohort B3. 16 of the 44 shared serum samples had similar biomarker signatures, while IL-4, IL-6 and CCL20 were not consistently detected on the GCFP chip.
FIGURE 10
FIGURE 10
Optimization of First Generation GCFP Chip. (A) Measurements of the limit of detection for 11 analytes from the first-generation biosensor chip. 1 ng/mL is the limit of detection for most analytes in this assay. (B) Optimizing reagents can increase the limit of detection.

Similar articles

Cited by

References

    1. Abramczyk U., Nowaczyński M., Adam S., Wojnicz P., Zatyka P., Kuzan A. (2022). Consequences of COVID-19 for the pancreas. Int. J. Mol. Sci. 23 (2), 864. 10.3390/ijms23020864 - DOI - PMC - PubMed
    1. Algarni A. S., NjoudAlamri M. N Z. K, R A., Alghamdi S. H., Alsubhi R. S., Alghamdi S. H. (2022). Clinical practice guidelines in multisystem inflammatory syndrome (MIS-C) related to COVID-19: A critical review and recommendations. World J. Pediatr. 18 (2), 83–90. 10.1007/s12519-021-00499-w - DOI - PMC - PubMed
    1. Alphonse T., Prince M., Trang T. D., Shumitzu C., Hoang T L., McCrindle B W., et al. (2016). Inositol-triphosphate 3-kinase C mediates inflammasome activation and treatment response in Kawasaki disease. J. Immunol. 197 (9), 3481–3489. LP – 3489. 10.4049/jimmunol.1600388 - DOI - PubMed
    1. Amanullah A., Hewitt C. J., Nienow A. W., Lee C., Chartrain M., Buckland B. C., et al. (2002). Application of multi-parameter flow cytometry using fluorescent probes to study substrate toxicity in the indene bioconversion. Biotechnol. Bioeng. 80 (3), 239–249. 10.1002/BIT.10477 - DOI - PubMed
    1. Bagnasco A., Pezzi E., Rosa F., Fornonil L., Sasso L. (2012). Distraction techniques in children during venipuncture: An Italian experience. J. Prev. Med. Hyg. 53 (1), 44–48. 10.15167/2421-4248/JPMH2012.53.1.314 - DOI - PubMed