

Value of susceptibility-weighted imaging in differentiating benign from malignant portal vein thrombosis
- PMID: 37064354
- PMCID: PMC10102778
- DOI: 10.21037/qims-22-350
Value of susceptibility-weighted imaging in differentiating benign from malignant portal vein thrombosis
Abstract
Background: Many diseases are accompanied by portal vein thrombosis (PVT), and its nature is closely related to its prognosis and treatment. It is important to evaluate magnetic resonance imaging (MRI) parameters, including susceptibility-weighted imaging (SWI) and qualitative diffusion-weighted imaging (DWI), in the differentiation between benign and malignant PVT.
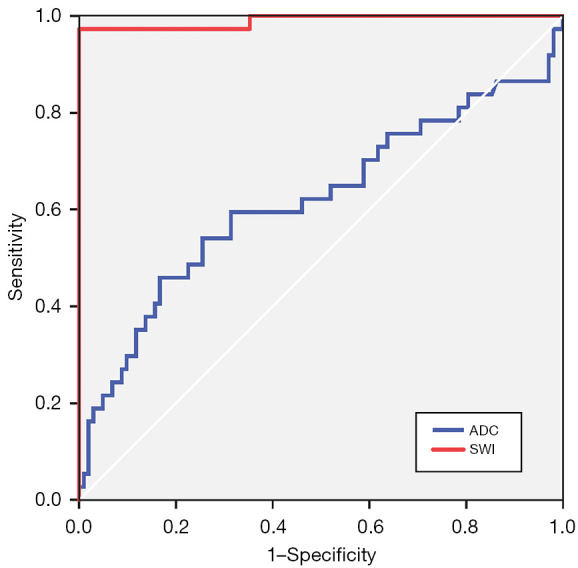
Methods: In this retrospective study, we collected clinical imaging data from 140 patients with PVTs characterized as benign or malignant based on enhanced MRI between January 2011 and April 2016 and retrospectively analyzed PVTs using SWI and DWI. There were 37 benign and 103 malignant PVTs. Image review was performed by 2 radiologists blinded to clinical information. The signal intensity (SI) of PVTs was recorded on SWI. The apparent diffusion coefficient (ADC) and the ratio of signal intensity (SIR) on SWI (SIRSWI) and ADC (SIRADC) between the PVTs and the spinal cord were calculated. Finally, we generated receiver operating characteristic (ROC) curves to evaluate the efficacy of SIRSWI and SIRADC for distinguishing benign and malignant PVTs.
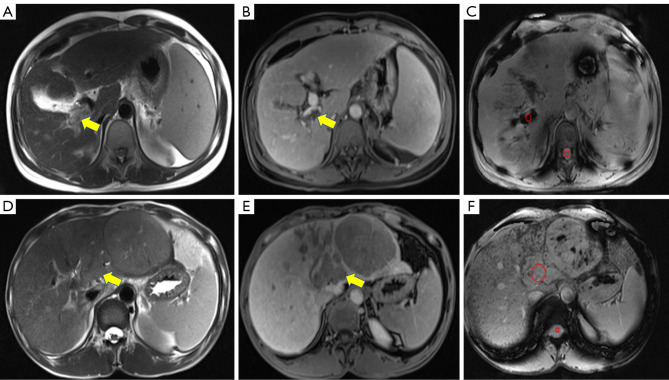
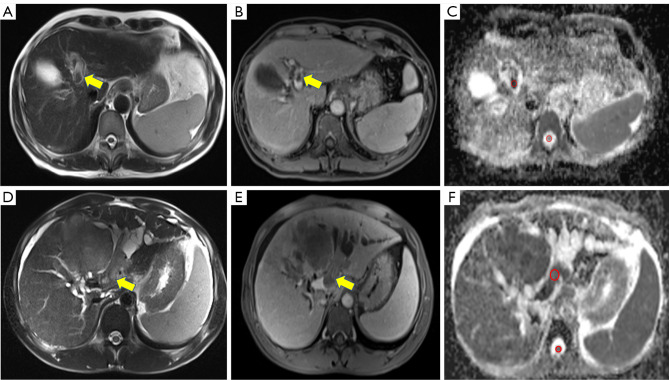
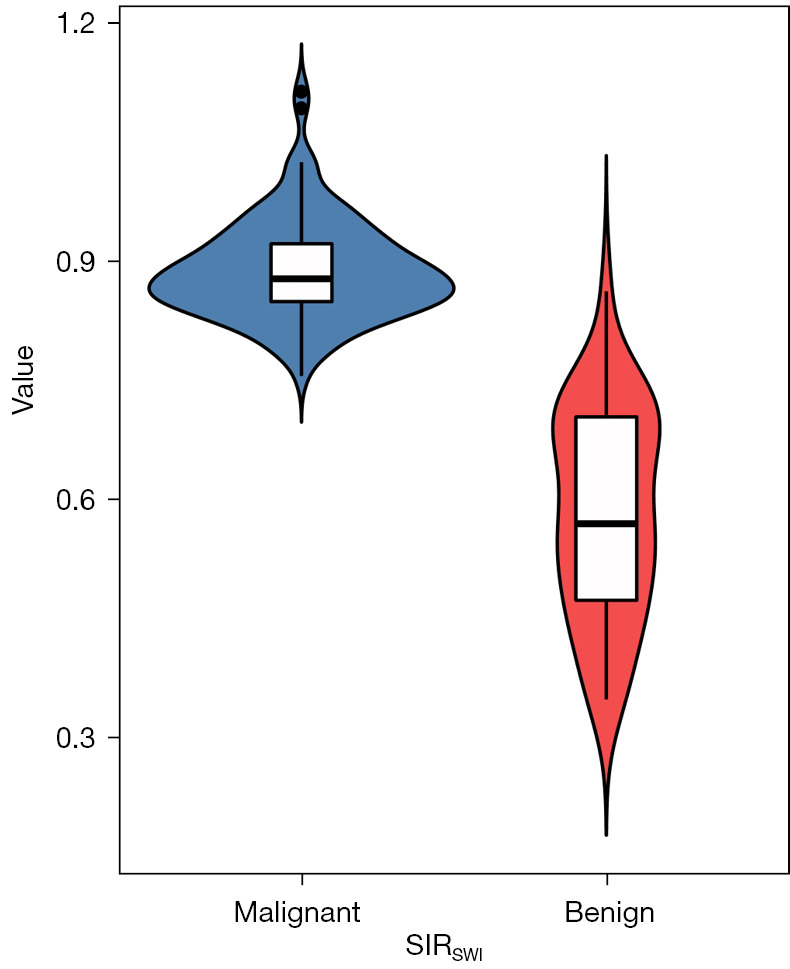
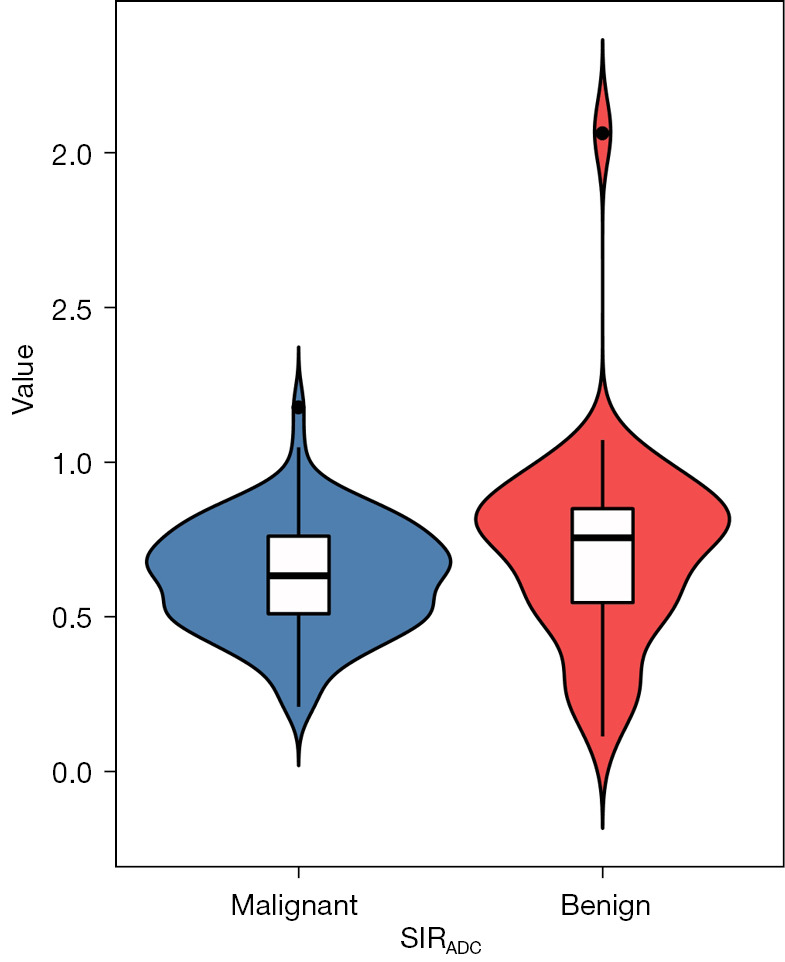
Results: On SWI and DWI, 100.0% (36/36) and 80.5% (29/36) of benign PVTs were hypointense, respectively. For malignant PVTs on SWI and DWI, 99.0% (103/104) and 89.4% (93/104) were hyperintense, respectively. The SIRSWI values of benign and malignant PVTs were 0.58±0.13 and 0.88±0.06, respectively, representing a significant difference (P<0.001). The SIRADC values of benign and malignant PVTs were 0.72±0.32 and 0.62±0.17, respectively, representing a significant difference (P=0.034). The area under the ROC curve (AUROC) for SIRSWI [0.990; 95% confidence interval (CI): 0.971-1.000] was significantly higher than that for SIRADC (0.619; 95% CI: 0.500-0.737; P<0.001). The SIRSWI had a sensitivity of 100.0% and a specificity of 97.3% with a cutoff value of 0.749, while the SIRADC had a sensitivity of 45.9% and specificity of 83.3% with a cutoff value of 0.791.
Conclusions: The diagnostic performance of SWI is superior to that of DWI in the differentiation of benign and malignant PVTs.
Keywords: Benign; diffusion-weighted imaging (DWI); malignant; portal vein thrombosis (PVT); susceptibility-weighted imaging (SWI).
2023 Quantitative Imaging in Medicine and Surgery. All rights reserved.
Conflict of interest statement
Conflicts of Interest: All authors have completed the ICMJE uniform disclosure form (available at https://qims.amegroups.com/article/view/10.21037/qims-22-350/coif). All authors report that this study was supported by the National Key Research and Development Program of China (Nos. 2016YFC0107101 and 2016YFC0107109) and the General Program of National Natural Science Foundation of Chongqing (No. CSTB2022NSCQ-MSX1371). The authors have no other conflicts of interest to declare.
Figures

Similar articles
-
Diffusion-Weighted MRI of Malignant versus Benign Portal Vein Thrombosis.Korean J Radiol. 2016 Jul-Aug;17(4):533-40. doi: 10.3348/kjr.2016.17.4.533. Epub 2016 Jun 27. Korean J Radiol. 2016. PMID: 27390544 Free PMC article.
-
Diagnostic performances of intravoxel incoherent motion and conventional diffusion-weighted imaging in the differential diagnosis of benign and malignant portal vein thrombus.Abdom Radiol (NY). 2018 Sep;43(9):2270-2276. doi: 10.1007/s00261-018-1467-6. Abdom Radiol (NY). 2018. PMID: 29411058
-
Differential diagnosis of parotid gland tumours: Application of SWI combined with DWI and DCE-MRI.Eur J Radiol. 2022 Jan;146:110094. doi: 10.1016/j.ejrad.2021.110094. Epub 2021 Dec 3. Eur J Radiol. 2022. PMID: 34906852
-
Usefulness of conventional MRI sequences and diffusion-weighted imaging in differentiating malignant from benign portal vein thrombus in cirrhotic patients.AJR Am J Roentgenol. 2013 Dec;201(6):1211-9. doi: 10.2214/AJR.12.10171. AJR Am J Roentgenol. 2013. PMID: 24261359
-
Differentiation of benign from malignant adnexal masses by functional 3 tesla MRI techniques: diffusion-weighted imaging and time-intensity curves of dynamic contrast-enhanced MRI.Asian Pac J Cancer Prev. 2015;16(8):3407-12. doi: 10.7314/apjcp.2015.16.8.3407. Asian Pac J Cancer Prev. 2015. PMID: 25921153
Cited by
-
Value of dual-energy computed tomography quantitative parameters in differentiating neoplastic from bland portal vein thrombosis.Quant Imaging Med Surg. 2025 Jun 6;15(6):5101-5113. doi: 10.21037/qims-2024-2516. Epub 2025 May 15. Quant Imaging Med Surg. 2025. PMID: 40606321 Free PMC article.
References
LinkOut - more resources
Full Text Sources
Miscellaneous