CD86 Is Associated with Immune Infiltration and Immunotherapy Signatures in AML and Promotes Its Progression
- PMID: 37064861
- PMCID: PMC10104747
- DOI: 10.1155/2023/9988405
CD86 Is Associated with Immune Infiltration and Immunotherapy Signatures in AML and Promotes Its Progression
Abstract
Background: Cluster of differentiation 86 (CD86), also known as B7-2, is a molecule expressed on antigen-presenting cells that provides the costimulatory signals required for T cell activation and survival. CD86 binds to two ligands on the surface of T cells: the antigen CD28 and cytotoxic T lymphocyte-associated protein 4 (CTLA-4). By binding to CD28, CD86-together with CD80-promotes the participation of T cells in the antigen presentation process. However, the interrelationships among CD86, immunotherapy, and immune infiltration in acute myeloid leukemia (AML) are unclear.
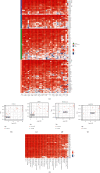
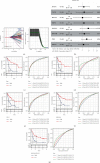
Methods: The immunological effects of CD86 in various cancers (including on chemokines, immunostimulators, MHC, and receptors) were evaluated through a pan-cancer analysis using TCGA and GEO databases. The relationship between CD86 expression and mononucleotide variation, gene copy number variation, methylation, immune checkpoint blockers (ICBs), and T-cell inflammation score in AML was subsequently examined. ESTIMATE and limma packages were used to identify genes at the intersection of CD86 with StromalScore and ImmuneScore. Subsequently, GO/KEGG and PPI network analyses were performed. The immune risk score (IRS) model was constructed, and the validation set was used for verification. The predictive value was compared with the TIDE score.
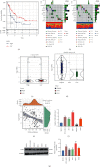
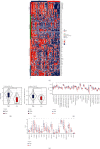
Results: CD86 was overexpressed in many cancers, and its overexpression was associated with a poor prognosis. CD86 expression was positively correlated with the expression of CTLA4, PDCD1LG2, IDO1, HAVCR2, and other genes and negatively correlated with CD86 methylation. The expression of CD86 in AML cell lines was detected by QRT-PCR and Western blot, and the results showed that CD86 was overexpressed in AML cell lines. Immune infiltration assays showed that CD86 expression was positively correlated with CD8 T cell, Dendritic cell, macrophage, NK cell, and Th1_cell and also with immune examination site, immune regulation, immunotherapy response, and TIICs. ssGSEA showed that CD86 was enriched in immune-related pathways, and CD86 expression was correlated with mutations in the genes RB1, ERBB2, and FANCC, which are associated with responses to radiotherapy and chemotherapy. The IRS score performed better than the TIDE website score.
Conclusion: CD86 appears to participate in immune invasion in AML and is an important player in the tumor microenvironment in this malignancy. At the same time, the IRS score developed by us has a good effect and may provide some support for the diagnosis of AML. Thus, CD86 may serve as a potential target for AML immunotherapy.
Copyright © 2023 Qianqian Zhang et al.
Conflict of interest statement
The authors declare that they have no conflicts of interest.
Figures


Similar articles
-
The landscape of CD28, CD80, CD86, CTLA4, and ICOS DNA methylation in head and neck squamous cell carcinomas.Epigenetics. 2020 Nov;15(11):1195-1212. doi: 10.1080/15592294.2020.1754675. Epub 2020 Apr 21. Epigenetics. 2020. PMID: 32281488 Free PMC article.
-
Regulation of CD80/B7-1 and CD86/B7-2 molecule expression in human primary acute myeloid leukemia and their role in allogenic immune recognition.Eur J Immunol. 1998 Jan;28(1):90-103. doi: 10.1002/(SICI)1521-4141(199801)28:01<90::AID-IMMU90>3.0.CO;2-5. Eur J Immunol. 1998. PMID: 9485189
-
Expression of costimulatory molecules CD80 and CD86 and their receptors CD28, CTLA-4 on malignant ascites CD3+ tumour-infiltrating lymphocytes (TIL) from patients with ovarian and other types of peritoneal carcinomatosis.Clin Exp Immunol. 2000 Jan;119(1):19-27. doi: 10.1046/j.1365-2249.2000.01105.x. Clin Exp Immunol. 2000. PMID: 10606960 Free PMC article.
-
Targeting B7-1 in immunotherapy.Med Res Rev. 2020 Mar;40(2):654-682. doi: 10.1002/med.21632. Epub 2019 Aug 25. Med Res Rev. 2020. PMID: 31448437 Review.
-
[Costimulatory molecules in autoimmunity: role of CD28/CTLA4-CD80/CD86].Nihon Rinsho. 1997 Jun;55(6):1419-24. Nihon Rinsho. 1997. PMID: 9200926 Review. Japanese.
Cited by
-
A comprehensive prognostic score for head and neck squamous cancer driver genes and phenotype traits.Discov Oncol. 2023 Oct 28;14(1):193. doi: 10.1007/s12672-023-00796-y. Discov Oncol. 2023. PMID: 37897503 Free PMC article.
-
Assessing the causal relationship between circulating immune cells and abdominal aortic aneurysm by bi-directional Mendelian randomization analysis.Sci Rep. 2024 Jun 14;14(1):13733. doi: 10.1038/s41598-024-64789-9. Sci Rep. 2024. PMID: 38877212 Free PMC article.
-
Causal relationship between immune cells and venous thromboembolism: a bidirectional two-sample Mendelian randomization study.Thromb J. 2025 Aug 5;23(1):78. doi: 10.1186/s12959-025-00754-4. Thromb J. 2025. PMID: 40764987 Free PMC article.
-
Immune checkpoints regulate acute myeloid leukemia stem cells.Leukemia. 2025 Jun;39(6):1277-1293. doi: 10.1038/s41375-025-02566-x. Epub 2025 Apr 2. Leukemia. 2025. PMID: 40175626 Free PMC article. Review.
-
Modeling cellular influence delineates functionally relevant cellular neighborhoods in primary and metastatic pancreatic ductal adenocarcinoma.bioRxiv [Preprint]. 2025 Jun 17:2025.06.12.659314. doi: 10.1101/2025.06.12.659314. bioRxiv. 2025. PMID: 40667118 Free PMC article. Preprint.
References
-
- Jayavelu A. K., Wolf S., Buettner F., et al. The proteogenomic subtypes of acute myeloid leukemia. Cancer Cell . 2022;40(3):301–317. - PubMed
LinkOut - more resources
Full Text Sources
Research Materials
Miscellaneous

