

Hypoxia-Related lncRNA Prognostic Model of Ovarian Cancer Based on Big Data Analysis
- PMID: 37064863
- PMCID: PMC10104744
- DOI: 10.1155/2023/6037121
Hypoxia-Related lncRNA Prognostic Model of Ovarian Cancer Based on Big Data Analysis
Abstract
Background: Hypoxia is regarded as a key factor in promoting the occurrence and development of ovarian cancer. In ovarian cancer, hypoxia promotes cell proliferation, epithelial to mesenchymal transformation, invasion, and metastasis. Long non-coding RNAs (lncRNAs) are extensively involved in the regulation of many cellular mechanisms, i.e., gene expression, cell growth, and cell cycle.
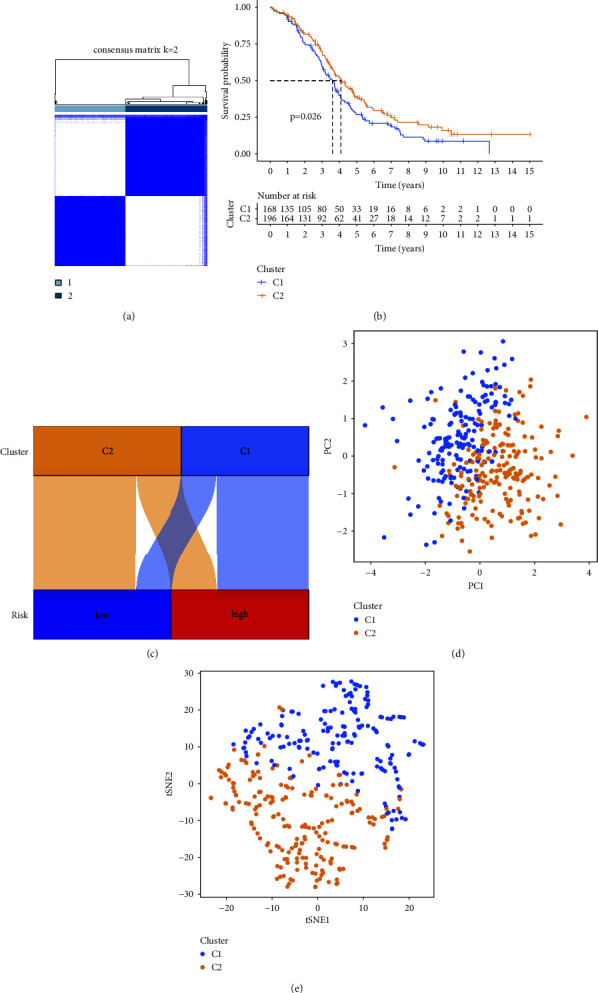
Materials and methods: In our study, a hypoxia-related lncRNA prediction model was established by applying LASSO-penalized Cox regression analysis in public databases. Patients with ovarian cancer were divided into two groups based on the median risk score. The survival rate was analyzed in the Cancer Genome Atlas (TCGA) and International Cancer Genome Consortium (ICGC) datasets, and the mechanisms were investigated.
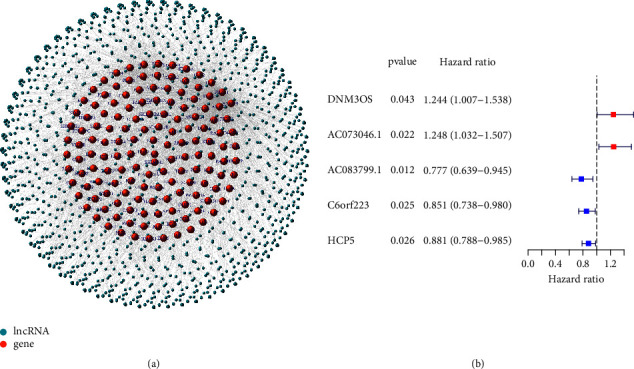
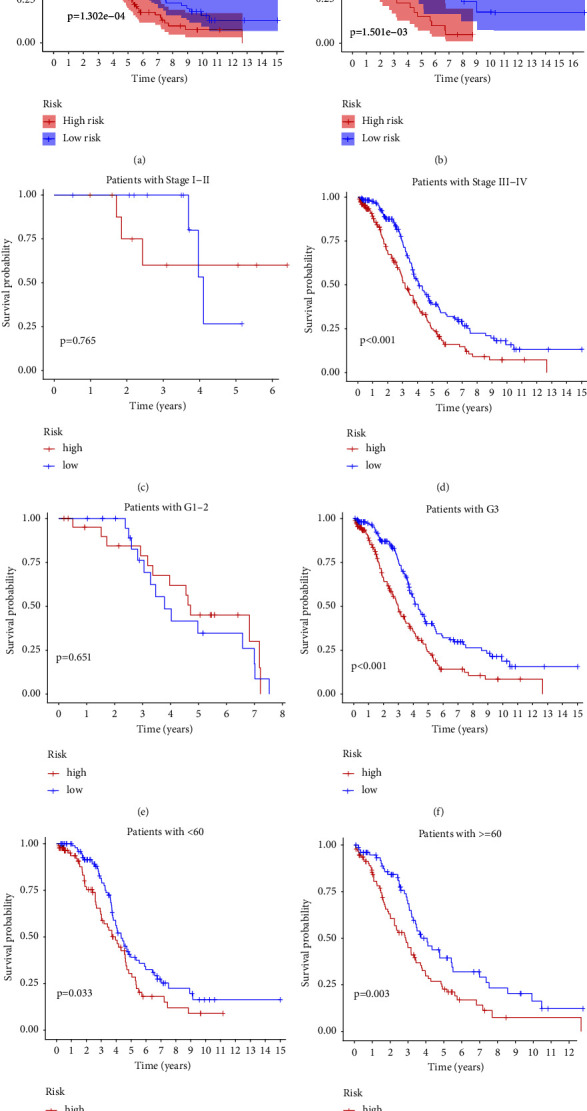
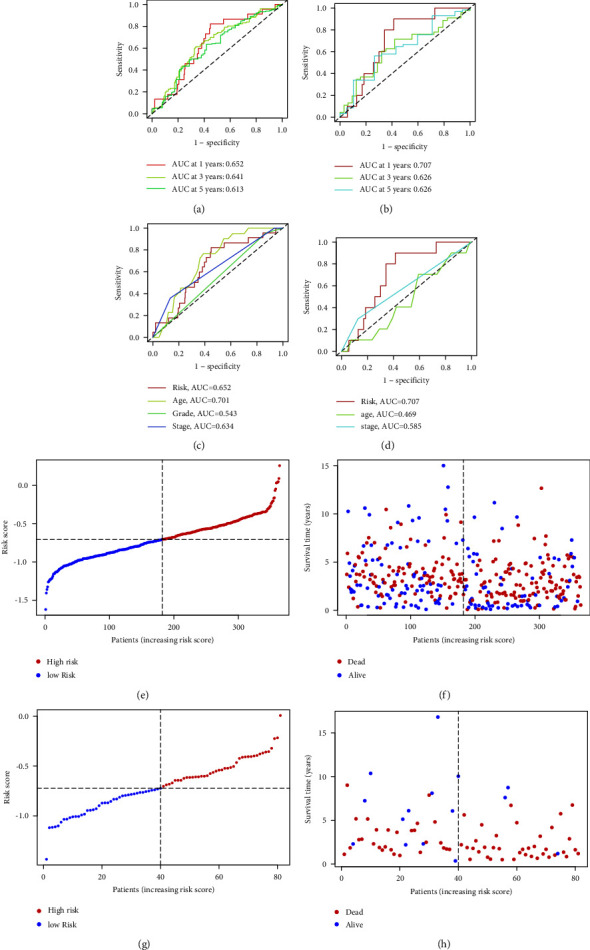
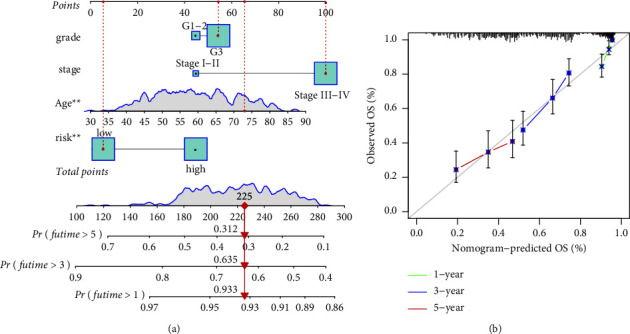
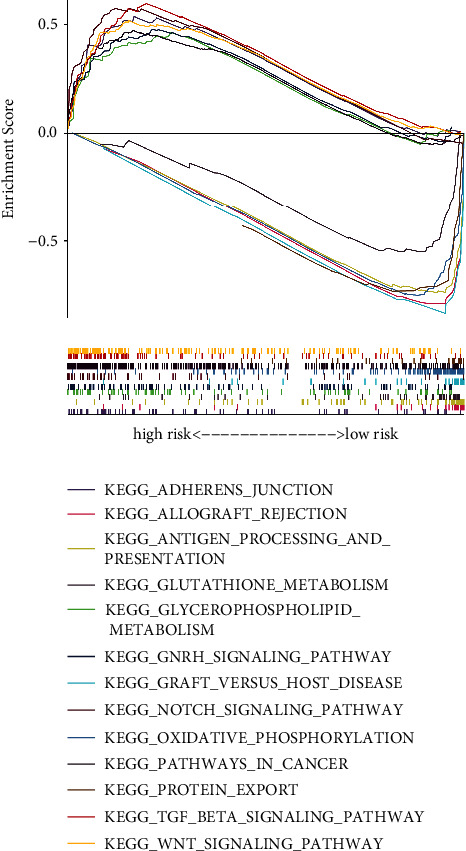
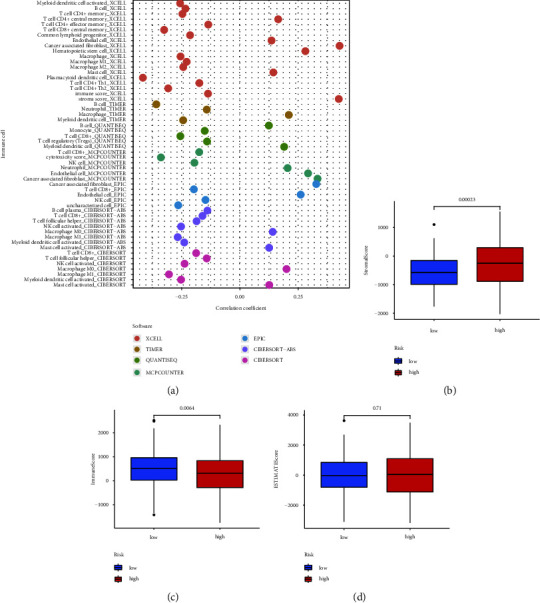
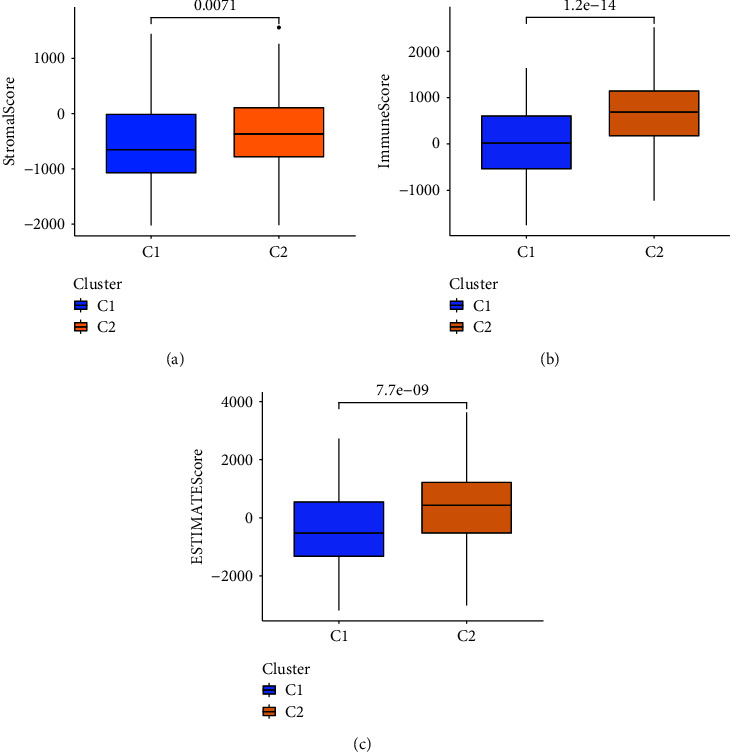
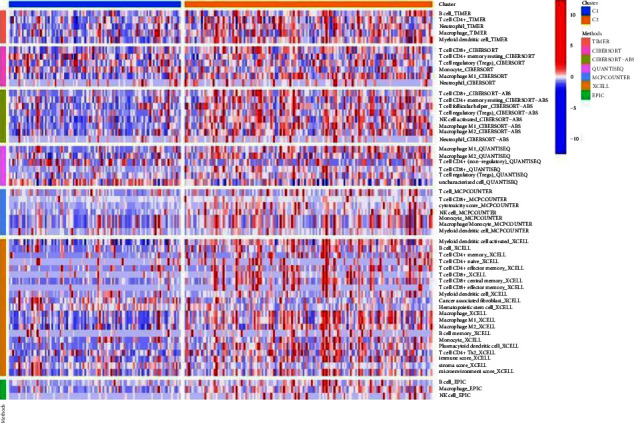
Results: Through the prognostic analysis of DElncRNAs (differentially expressed long non-coding RNAs), a total of 5 lncRNAs were found to be closely associated with OS (overall survival) in ovarian cancer patients. It was evaluated through Kaplan-Meier analysis that low-risk patients can live longer than high-risk patients (TCGA: p = 1.302e - 04; ICGC: 1.501e - 03). The distribution of risk scores and OS status revealed that higher risk score will lead to lower OS. It was evaluated that low-risk group had higher immune score (p = 0.0064) and lower stromal score (p = 0.00023).
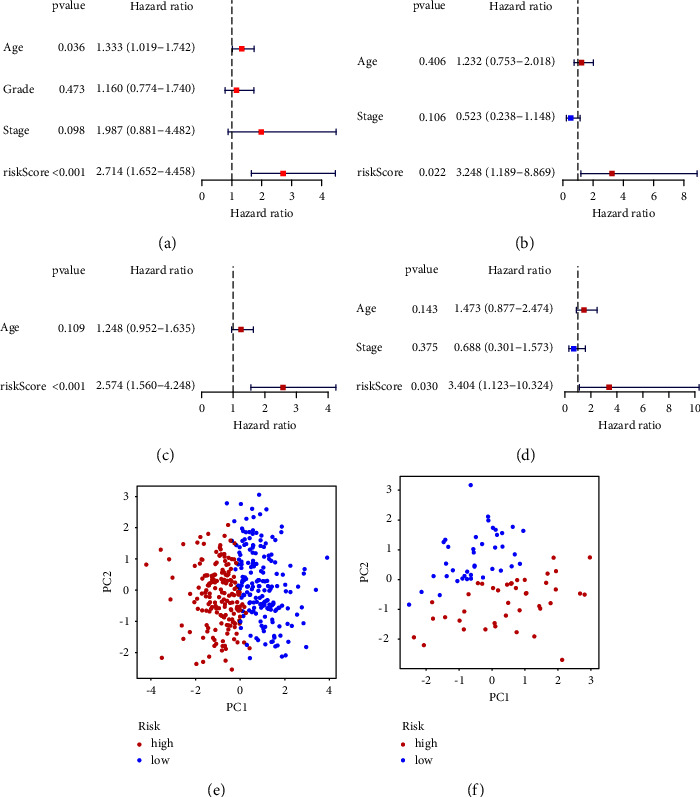
Conclusion: It was concluded that a hypoxia-related lncRNA model can be used to predict the prognosis of ovarian cancer. Our designed model is more accurate in terms of age, grade, and stage when predicting the overall survival of the patients of ovarian cancer.
Copyright © 2023 Yu Zhang et al.
Conflict of interest statement
The authors declare that they have no conflicts of interest.
Figures
Similar articles
-
A prognostic model based on immune-related long noncoding RNAs for patients with epithelial ovarian cancer.J Ovarian Res. 2022 Jan 15;15(1):8. doi: 10.1186/s13048-021-00930-w. J Ovarian Res. 2022. PMID: 35031063 Free PMC article.
-
Development of a novel hypoxia-immune-related LncRNA risk signature for predicting the prognosis and immunotherapy response of colorectal cancer.Front Immunol. 2022 Sep 14;13:951455. doi: 10.3389/fimmu.2022.951455. eCollection 2022. Front Immunol. 2022. PMID: 36189298 Free PMC article.
-
Construction of a Nomogram Based on a Hypoxia-Related lncRNA Signature to Improve the Prediction of Gastric Cancer Prognosis.Front Genet. 2020 Oct 20;11:570325. doi: 10.3389/fgene.2020.570325. eCollection 2020. Front Genet. 2020. PMID: 33193668 Free PMC article.
-
Competitive endogenous RNA network identifies four long non-coding RNA signature as a candidate prognostic biomarker for lung adenocarcinoma.Transl Cancer Res. 2019 Aug;8(4):1046-1064. doi: 10.21037/tcr.2019.06.09. Transl Cancer Res. 2019. PMID: 35116848 Free PMC article.
-
Identification and Validation of a Prognostic lncRNA Signature for Hepatocellular Carcinoma.Front Oncol. 2020 Jun 10;10:780. doi: 10.3389/fonc.2020.00780. eCollection 2020. Front Oncol. 2020. PMID: 32587825 Free PMC article.
Cited by
-
Long Non-Coding RNAs in Ovarian Cancer: Mechanistic Insights and Clinical Applications.Cancers (Basel). 2025 Jan 30;17(3):472. doi: 10.3390/cancers17030472. Cancers (Basel). 2025. PMID: 39941838 Free PMC article. Review.
-
Identification of lncRNAs Deregulated in Epithelial Ovarian Cancer Based on a Gene Expression Profiling Meta-Analysis.Int J Mol Sci. 2023 Jun 28;24(13):10798. doi: 10.3390/ijms241310798. Int J Mol Sci. 2023. PMID: 37445988 Free PMC article.
References
LinkOut - more resources
Full Text Sources
