. 2023 Mar 21;13(6):1892-1905.
doi: 10.7150/thno.78078. eCollection 2023.

HSF1 promotes CD69+ Treg differentiation to inhibit colitis progression

Affiliations

HSF1 promotes CD69+ Treg differentiation to inhibit colitis progression

Lei Yu et al. Theranostics. .

Abstract

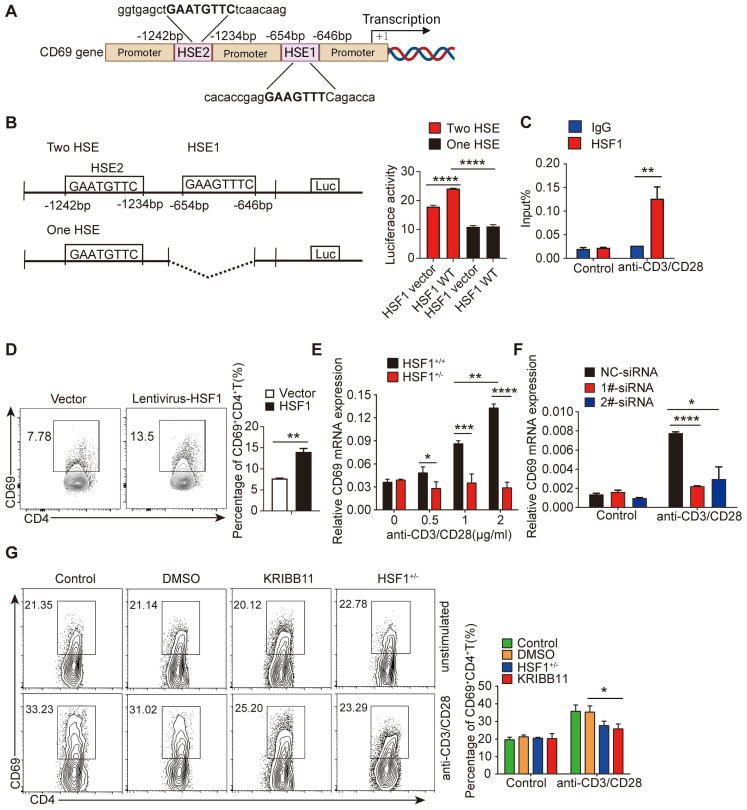
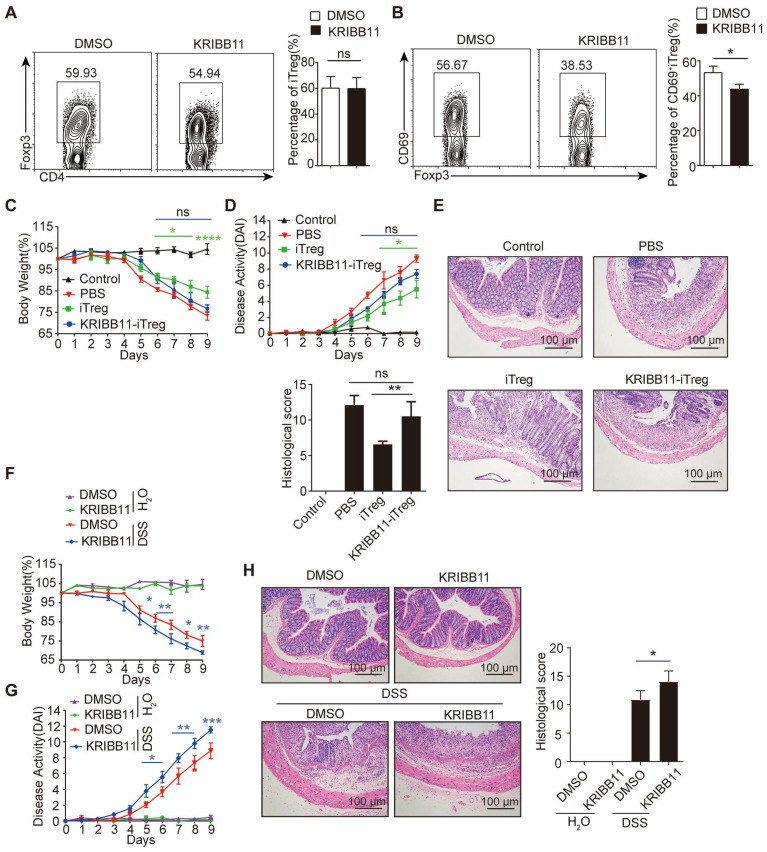
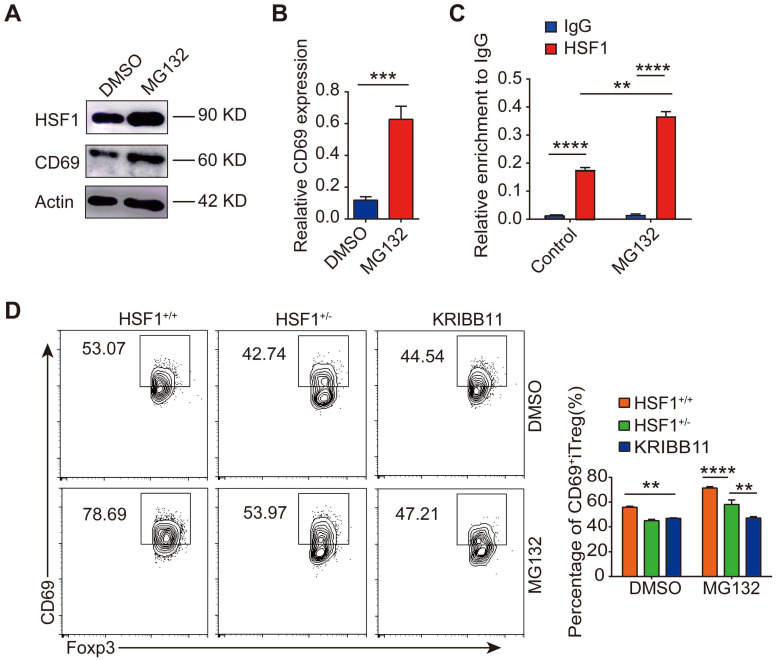
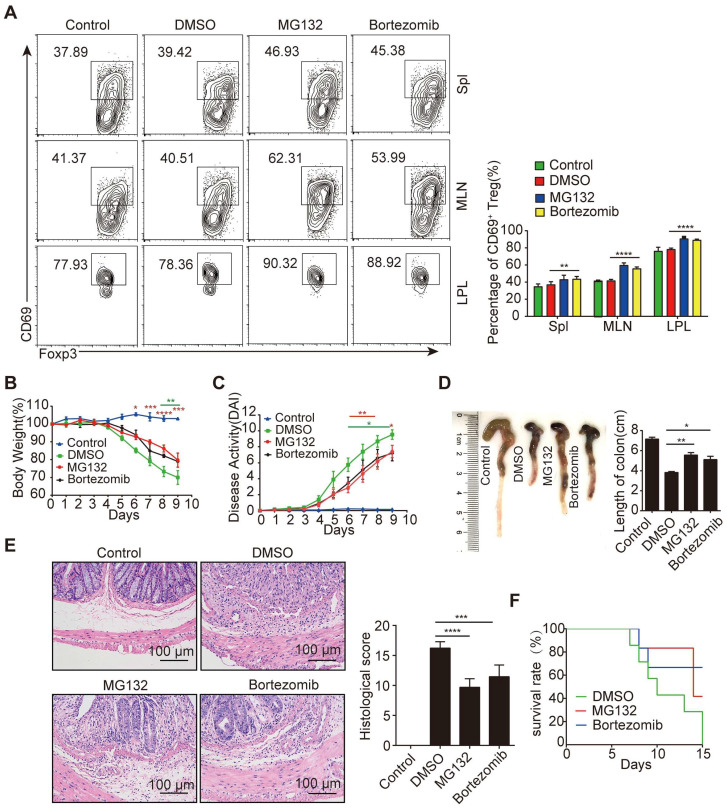
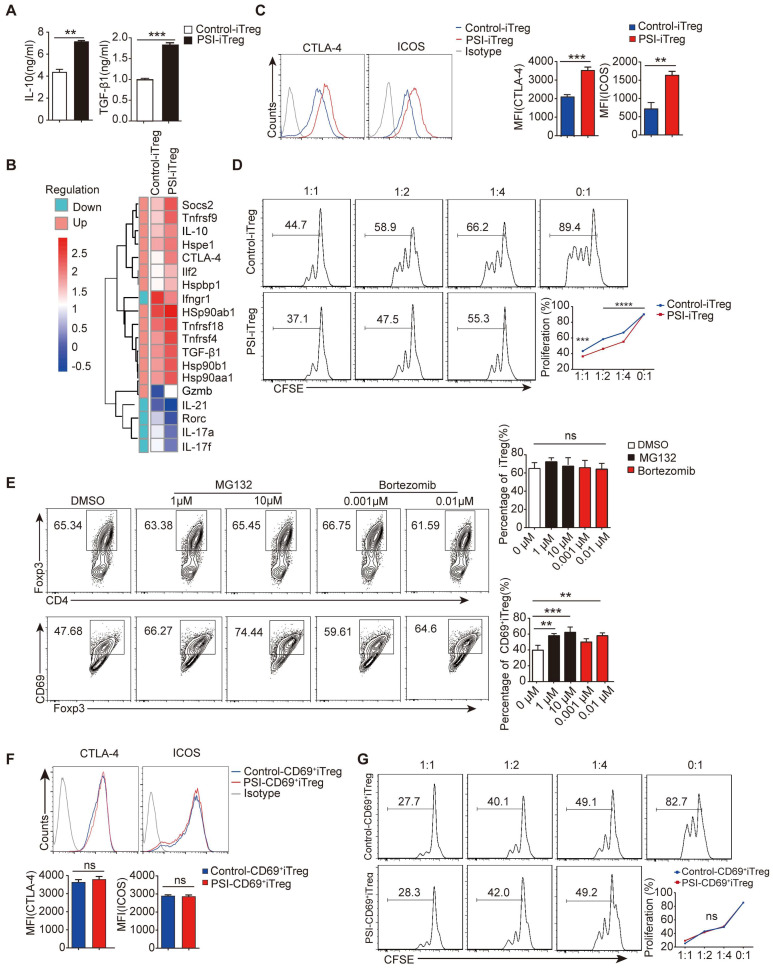
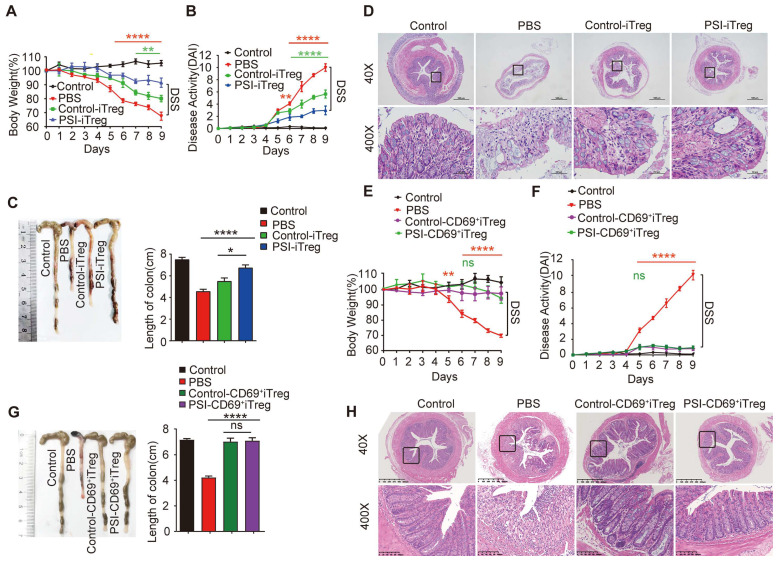
Regulatory T cells (Tregs) are critical for generating and maintaining peripheral tolerance. Treg-based immunotherapy is valuable for the clinical management of diseases resulting from dysregulation of immune tolerance. However, the lack of potency is a potential limitation of Treg therapy. In addition, CD69 positive-Treg (CD69+ Treg) represent a newly identified subset of Tregs with potent immune suppressive capability. Methods: Foxp3 YFP-Cre CD69 fl/fl and CD4 Cre CD69 fl/fl mice were generated to determine the relevance of CD69 to Treg. Chromatin Immunoprecipitation Assay (ChIP) and luciferase Assay were performed to detect the regulation of CD69 transcription by heat shock transcription factor 1(HSF1). Gene expression was measured by western blotting and qRT-PCR. The differentiation of naive T cells to CD69+Foxp3+ iTregs was determined by flow cytometry. The immunosuppressive ability of Tregs was analyzed by ELISA and flow cytometry. Colon inflammation in mice was reflected by changes in body weight and colon length, the disease activity index (DAI), and H&E staining of colon tissues. Results: Induced Tregs (iTregs) from CD4 Cre CD69 fl/fl mice failed to alleviate colitis. The transcription factor HSF1 interacted with the promoter of the CD69 gene to prompt its transcription during Treg differentiation. Genetic and chemical inhibition of HSF1 impaired CD69+ Treg differentiation and promoted the pathogenesis of colitis in mice. In contrast, HSF1 protein stabilized by inhibiting its proteasomal degradation promoted CD69+ Treg differentiation and alleviated colitis in mice. Moreover, adoptive transfer of iTregs with HSF1 stabilization by proteasome inhibitor (PSI) dramatically prevented the development of colitis in mice and was accompanied by decreased production of pro-inflammatory cytokines and reduced accumulation of pro-inflammatory lymphocytes in colitis tissue, whereas Tregs induced in the absence of PSI were less stable and ineffective in suppressing colitis. Conclusions: HSF1 promotes CD69+ Tregs differentiation by activating the CD69 transcription, which is critical for the immunosuppressive function of Tregs. Stabilization of HSF1 by PSIs results in the efficient generation of Tregs with high potency to treat colitis and probably other autoimmune diseases involving Tregs deficiency.

Keywords: CD69; HSF1; IBD; Treg; proteasome inhibitor.


Conflict of interest statement

Competing Interests: The authors have declared that no competing interest exists.

Figures

Figure 1
Figure 1
CD69 is indispensable to maintain iTregs function. (A) CD69fl/fl or Foxp3YFP-CreCD69fl/fl mice were administrated with 2% DSS in drinking water for 9 days (n = 7 for each group). The average body weight is shown as a percentage relative to the initial value. (B) The disease activity index is analyzed. The length of the colon (C) and histological appearance (D) after 9 days of colitis induction. (E and F) Naïve CD4+ T cells isolated from CD69fl/fl or CD4CreCD69fl/fl mice were cultured for 3 days under Treg-polarization conditions and then analyzed by flow cytometry. Foxp3YFP-CreCD69fl/fl mice after 2 days of DSS administration were intravenously injected with iTregs from CD69fl/fl and CD4CreCD69fl/fl mice (n = 7 for each group). The mice's body weight (G)and the DAI (H) were recorded every day. The average body weight is shown as a percentage relative to the initial value. (I)The average length of the colons. (J) Hematoxylin and eosin staining of the colon sections. Scale bar:500 μm (whole colon section) and 100 μm (enlarged insets). ns, not significant. *p < 0.05, **p < 0.01, ***p < 0.001, ****p < 0.0001 compared with the control or the indicated group.
Figure 2
Figure 2
HSF1 is important for CD69 transcription in CD4+ T cells. (A) Schematic of the nucleotide sequence of CD69 promoter, indicating the locations of the putative HSE sites. The potential HSF1 binding sites are shown in boxes. (B) HEK293 cells were infected for 48 h with luciferase reporter plasmids as shown on the left as well as a construct that encodes HSF1 or the empty vector, and then, cells were harvested to detect luciferase activity. (C) ChIP analysis of HSF1 binding to the CD69 promoter in CD4+ T cells with or without anti-CD3/CD28 mAb stimulation. (D) Overall 1×10⁶/mL CD4+ T cells were added to 8 μg polybrene and transfected with control lentivirus or lentivirus-HSF1 at an MOI of 100 for 48 h. CD69 protein levels were determined using flow cytometry. (E) CD4+ T cells isolated from HSF1+/+ and HSF1+/- mice were stimulated with different doses of anti-CD3/CD28 antibodies, and the mRNA levels of CD69 were detected by qRT-PCR. (F) 1 × 10⁶/mL CD4+ T cells were stimulated with or without anti-CD3/CD28 antibodies and treated with HSF1 siRNA for the indicated time. The relative levels of CD69 expression in different groups of CD4+ T cells were determined by qRT-PCR. (G) CD4+ T cells isolated from HSF1+/+ and HSF1+/- mice were stimulated with or without anti-CD3/CD28 antibodies following the treatment with KRIBB11 for 24 h, and then the expression of CD69+CD4+ T cell was analyzed by FACS. Representative images of the data expressed as mean ± SD of three independent experiments (n = 7 per group). ns, not significant. *p <0.05, **p < 0.01, ***p < 0.001, ****p < 0.0001, as analyzed by ANOVA or Student's t-test.
Figure 3
Figure 3
HSF1 is necessary for CD69+ Treg differentiation. Naive CD4+ T cells were cultured in Treg polarization conditions with or without KRIBB11. The frequency of iTreg (A) and CD69+iTreg (B) was analyzed by FACS. Induced Tregs were sorted and injected i.v into IBD mice treated with KRIBB11 on day 2. The body weights (C) were measured and DAI (D) was analyzed daily. (E) H&E-stained images of colon sections. Scale bar: 100 μm. (F-G) The mice were treated with KRIBB11 and then administration with 2% DSS, body weight and DAI were analyzed daily. (H) H&E-stained images of colon sections. Scale bar: 100 μm. Representative images of the data expressed as mean ± SD of three independent experiments (n = 7 per group). ns, not significant. *p < 0.05, **p < 0.01, ***p < 0.001, ****p < 0.0001 as analyzed by ANOVA and Student's t-test.
Figure 4
Figure 4
MG132 prompts the activation of HSF1 and the expression of CD69. 1 × 10⁷ CD4+ T cells were isolated and incubated with 10 µM of MG132 at 37°C for 2 h and then cultured in T lymphocyte culture medium for 24 h. (A) All the cells were harvested and protein levels of HSF1 and CD69 were analyzed by western blot. (B) The relative levels of CD69 were analyzed by qRT-PCR. (C) CD4+ T cells were incubated with MG132 for 2 h and then washed with 1640 RPMI, followed by culture under Treg polarization for 24 h. Cells were then subjected to a ChIP assay using the indicated antibodies. The precipitated DNA was analyzed by quantitative PCR using primer pairs corresponding to the indicated genomic regions. (D) CD4+ naive T cells were sorted from HSF1+/+ or HSF1+/- mice and pretreated with MG132 and induced iTregs while HSF1 inhibitor was added at the same time to block HSF1 expression. The flow cytometric analysis of iTregs and CD69+ iTregs expression. Representative images of the data expressed as mean ± SD of three independent experiments. **p < 0.01, ***p < 0.001, ****p < 0.0001. ns, not significant, as analyzed by ANOVA or Student's t-test.
Figure 5
Figure 5
Proteasome inhibitors showed a milder therapeutic effect on IBD. (A) Density plots showing CD69 expression in gated CD4+Foxp3+ cells from freshly isolated spleen, MLN and colonic LPL in mice treated with MG132 and bortezomib. Acute colitis was induced in animals by administering 2% DSS in their drinking water for 9 days. Mice were treated with or without MG132 and bortezomib for 2 days at indicated doses. Changes in body weight (B), disease activity index (C), and colon length (D) and histological sections of inflamed colons (E) during the course of DSS treatment in each group of mice. Scale bar:100 μm. (F) Survival rates of each group of mice after the initiation of DSS-induced acute colitis were recorded daily (n=10 per group). Representative images of the data expressed as mean ± SD of three independent experiments. *p < 0.01, **p < 0.01, ***p < 0.001, ****p < 0. 0001.ns, not significant, as analyzed by ANOVA or Student's t-test.
Figure 6
Figure 6
Proteasome inhibitors prompt CD69 expression in vitro. Overall 1 × 10⁶/ml freshly isolated naive CD4+ T cells incubated with or without MG132 for 2 h at 37°C and washed three times with 1640 RPMI. The cells were then stimulated with 2 µg/ml anti-CD3/CD28 antibody, 10ng/ml TGF-β1, and 50 IU/ml of IL-2 for 72 h. (A) The levels of IL-10 and TGF-β1 in the supernatants of cultured cells were measured by ELISA. (B) Total RNA was extracted from isolated PSI-iTregs and Control-iTregs while the gene expression profile was analyzed using the microarray analysis. The heat map of the gene expression is also shown. (C and F) The expression levels of CTLA-4 and ICOS in PSI-iTregs/CD69+iTregs and Control-iTregs/CD69+ iTregs were analyzed using flow cytometry with indicated antibodies. (D and G) 1 × 10⁶/ml of CD4+CD25- T cells were labeled with CFSE and co-cultured with PSI-iTregs/CD69+ iTregs and Control-iTregs/CD69+ iTregs at a ratio of 1:1, 1: 2, or 1: 4 in the presence of 1 µl anti-CD3/CD28 coated beads for 3 days. The proliferation of CD4+ T cells was analyzed by flow cytometry. The cells were first gated on living lymphocytes and then on CFSE+ T cells (n = 3). (E) Naive CD4+ T cells incubated with or without MG132 or Bortezomib then cultured under Treg porlarization condition, the relative frequency of iTregs and CD69+ iTregs was analyzed using FACS (n = 3). Representative images of the data were expressed as mean ± SD of three independent experiments while Student's t-test was used for statistical analysis. *p < 0.01, **p < 0.01, ***p < 0.001, ****p < 0.0001. ns, not significant.
Figure 7
Figure 7
Adoptive transfer of PSI-iTregs attenuated the severity of DSS-induced IBD in mice. IBD was induced by administering DSS in drinking water for 10 days. For the treatment of IBD, 1 × 10⁶ PSI-iTregs or Control-iTregs were sorted and intravenously injected into mice on day 2. (A) The loss in body weight was recorded daily. Each point represents the average weight data pooled from eight mice ± SD. Control group: the mice fed with normal water; PBS group, the mice were drinking water containing 2% DSS and intravenously treated with PBS on day 2. (B) The DAI was evaluated daily. Each point represents the average DAI data pooled from eight mice. (C) Appearance and statistical analysis of colon length on day 9. (D) Representative H&E staining of the colon mice of different groups. (E-F) Weight loss and DAI in mice transferred with PSI-CD69+iTregs and Control-CD69+iTregs. (G-H) The length of colon and H&E staining of the colon from mice from the different groups. Representative images of the data expressed as the mean ± SD of three independent experiments. * p < 0.05, **p < 0.01, ***p < 0.001, ****p < 0.001, ns, not significant. ANOVA or Student's t-test was used to determine the significance.

Similar articles

Cited by

References

    1. Aharoni R, Sonego H, Brenner O, Eilam R, Arnon R. The therapeutic effect of glatiramer acetate in a murine model of inflammatory bowel disease is mediated by anti-inflammatory T-cells. Immunol Lett. 2007;112(2):110–119. - PubMed
    1. Dickson I. IBD: Ustekinumab therapy for Crohn's disease. Nat Rev Gastroenterol Hepatol. 2017;14(1):4. - PubMed
    1. Kitagawa Y, Sakaguchi S. Molecular control of regulatory T cell development and function. Curr Opin Immunol. 2017;49:64–70. - PubMed
    1. Tanoue T, Atarashi K, Honda K. Development and maintenance of intestinal regulatory T cells. Nat Rev Immunol. 2016;16(5):295–309. - PubMed
    1. Shevach EM, Thornton AM. tTregs, pTregs, and iTregs: similarities and differences. Immunol Rev. 2014;259(1):88–102. - PMC - PubMed

Publication types

Substances