

Tumor protease-activated theranostic nanoparticles for MRI-guided glioblastoma therapy
- PMID: 37064879
- PMCID: PMC10091873
- DOI: 10.7150/thno.79342
Tumor protease-activated theranostic nanoparticles for MRI-guided glioblastoma therapy
Abstract
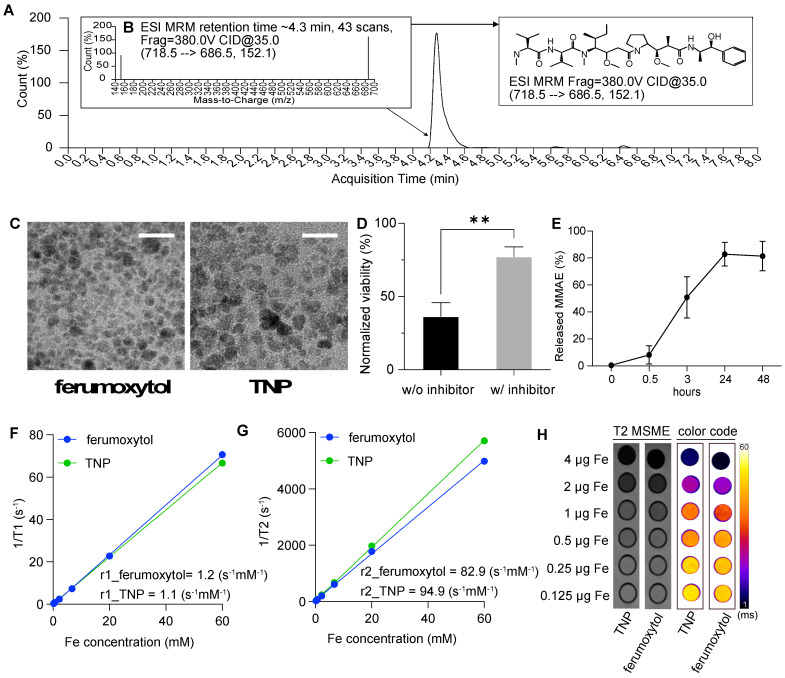
Rationale: As a cancer, Glioblastoma (GBM) is a highly lethal and difficult-to-treat. With the aim of improving therapies to GBM, we developed novel and target-specific theranostic nanoparticles (TNPs) that can be selectively cleaved by cathepsin B (Cat B) to release the potent toxin monomethyl auristatin E (MMAE). Methods: We synthesized TNPs composed of a ferumoxytol-based nanoparticle carrier and a peptide prodrug with a Cat-B-responsive linker and the tubulin inhibitor MMAE. We hypothesized that intratumoral Cat B can cleave our TNPs and release MMAE to kill GBM cells. The ferumoxytol core enables in vivo drug tracking with magnetic resonance imaging (MRI). We incubated U87-MG GBM cells with TNPs or ferumoxytol and evaluated the TNP content in the cells with transmission electron microscopy and Prussian blue staining. In addition, we stereotaxically implanted 6- to 8-week-old nude mice with U87-MG with U87-MG GBM cells that express a fusion protein of Green Fluorescence Protein and firefly Luciferase (U87-MG/GFP-fLuc). We then treated the animals with an intravenous dose of TNPs (25 mg/kg of ferumoxytol, 0.3 mg/kg of MMAE) or control. We also evaluated the combination of TNP treatment with radiation therapy. We performed MRI before and after TNP injection. We compared the results for tumor and normal brain tissue between the TNP and control groups. We also monitored tumor growth for a period of 21 days. Results: We successfully synthesized TNPs with a hydrodynamic size of 41 ± 5 nm and a zeta potential of 6 ± 3 mV. TNP-treated cells demonstrated a significantly higher iron content than ferumoxytol-treated cells (98 ± 1% vs. 3 ± 1% of cells were iron-positive, respectively). We also found significantly fewer live attached cells in the TNP-treated group (3.8 ± 2.0 px2) than in the ferumoxytol-treated group (80.0 ± 14.5 px2, p < 0001). In vivo MRI studies demonstrated a decline in the tumor signal after TNP (T2= 28 ms) but not control (T2= 32 ms) injections. When TNP injection was combined with radiation therapy, the tumor signals dropped further (T2 = 24 ms). The combination therapy of radiation therapy and TNPs extended the median survival from 14.5 days for the control group to 45 days for the combination therapy group. Conclusion: The new cleavable TNPs reported in this work accumulate in GBM, cause tumor cell death, and have synergistic effects with radiation therapy.
Keywords: MMAE; MRI; glioblastoma; nanoparticles; theranostic.
© The author(s).
Conflict of interest statement
Competing Interests: The authors have declared that no competing interest exists.
Figures


Similar articles
-
Dual-enzyme activated theranostic nanoparticles for image-guided glioblastoma therapy.Sci Rep. 2025 Apr 19;15(1):13540. doi: 10.1038/s41598-025-97775-w. Sci Rep. 2025. PMID: 40253484 Free PMC article.
-
Development of novel tumor-targeted theranostic nanoparticles activated by membrane-type matrix metalloproteinases for combined cancer magnetic resonance imaging and therapy.Small. 2014 Feb 12;10(3):566-75, 417. doi: 10.1002/smll.201301456. Epub 2013 Aug 27. Small. 2014. PMID: 24038954 Free PMC article.
-
A subtype specific probe for targeted magnetic resonance imaging of M2 tumor-associated macrophages in brain tumors.Acta Biomater. 2025 Mar 1;194:336-351. doi: 10.1016/j.actbio.2025.01.003. Epub 2025 Jan 11. Acta Biomater. 2025. PMID: 39805525
-
Repurposing ferumoxytol: Diagnostic and therapeutic applications of an FDA-approved nanoparticle.Theranostics. 2022 Jan 1;12(2):796-816. doi: 10.7150/thno.67375. eCollection 2022. Theranostics. 2022. PMID: 34976214 Free PMC article. Review.
-
Magnetic resonance imaging of stem cell-macrophage interactions with ferumoxytol and ferumoxytol-derived nanoparticles.Wiley Interdiscip Rev Nanomed Nanobiotechnol. 2019 Jul;11(4):e1552. doi: 10.1002/wnan.1552. Epub 2019 Feb 7. Wiley Interdiscip Rev Nanomed Nanobiotechnol. 2019. PMID: 30734542 Free PMC article. Review.
Cited by
-
Smart Delivery Systems Responsive to Cathepsin B Activity for Cancer Treatment.Pharmaceutics. 2023 Jun 29;15(7):1848. doi: 10.3390/pharmaceutics15071848. Pharmaceutics. 2023. PMID: 37514035 Free PMC article. Review.
-
Magnetic and Fluorescent Dual-Labeled Genetically Encoded Targeted Nanoparticles for Malignant Glioma Cell Tracking and Drug Delivery.Pharmaceutics. 2023 Oct 4;15(10):2422. doi: 10.3390/pharmaceutics15102422. Pharmaceutics. 2023. PMID: 37896182 Free PMC article.
-
Nanoparticle Strategies for Treating CNS Disorders: A Comprehensive Review of Drug Delivery and Theranostic Applications.Int J Mol Sci. 2024 Dec 11;25(24):13302. doi: 10.3390/ijms252413302. Int J Mol Sci. 2024. PMID: 39769066 Free PMC article. Review.
-
Dual-enzyme activated theranostic nanoparticles for image-guided glioblastoma therapy.Sci Rep. 2025 Apr 19;15(1):13540. doi: 10.1038/s41598-025-97775-w. Sci Rep. 2025. PMID: 40253484 Free PMC article.
-
Recent advances in nanomaterial-based brain-targeted delivery systems for glioblastoma therapy.Nanomedicine (Lond). 2025 Jun;20(12):1495-1511. doi: 10.1080/17435889.2025.2503694. Epub 2025 May 12. Nanomedicine (Lond). 2025. PMID: 40353316 Review.
References
-
- Jue TR, McDonald KL. The challenges associated with molecular targeted therapies for glioblastoma. J Neurooncol. 2016;127:427–34. - PubMed
-
- Nieder C, Andratschke N, Wiedenmann N, Busch R, Grosu AL, Molls M. Radiotherapy for high-grade gliomas. Does altered fractionation improve the outcome? Strahlenther Onkol. 2004;180:401–7. - PubMed
Publication types
MeSH terms
Substances
Grants and funding
LinkOut - more resources
Full Text Sources
Research Materials
Miscellaneous
