

Driving drowsiness detection using spectral signatures of EEG-based neurophysiology
- PMID: 37064914
- PMCID: PMC10097971
- DOI: 10.3389/fphys.2023.1153268
Driving drowsiness detection using spectral signatures of EEG-based neurophysiology
Abstract
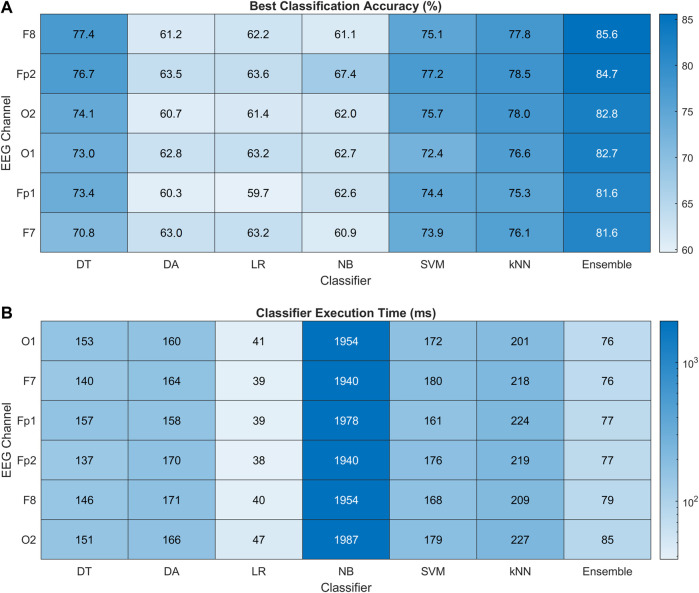
Introduction: Drowsy driving is a significant factor causing dire road crashes and casualties around the world. Detecting it earlier and more effectively can significantly reduce the lethal aftereffects and increase road safety. As physiological conditions originate from the human brain, so neurophysiological signatures in drowsy and alert states may be investigated for this purpose. In this preface, A passive brain-computer interface (pBCI) scheme using multichannel electroencephalography (EEG) brain signals is developed for spatially localized and accurate detection of human drowsiness during driving tasks. Methods: This pBCI modality acquired electrophysiological patterns of 12 healthy subjects from the prefrontal (PFC), frontal (FC), and occipital cortices (OC) of the brain. Neurological states are recorded using six EEG channels spread over the right and left hemispheres in the PFC, FC, and OC of the sleep-deprived subjects during simulated driving tasks. In post-hoc analysis, spectral signatures of the δ, θ, α, and β rhythms are extracted in terms of spectral band powers and their ratios with a temporal correlation over the complete span of the experiment. Minimum redundancy maximum relevance, Chi-square, and ReliefF feature selection methods are used and aggregated with a Z-score based approach for global feature ranking. The extracted drowsiness attributes are classified using decision trees, discriminant analysis, logistic regression, naïve Bayes, support vector machines, k-nearest neighbors, and ensemble classifiers. The binary classification results are reported with confusion matrix-based performance assessment metrics. Results: In inter-classifier comparison, the optimized ensemble model achieved the best results of drowsiness classification with 85.6% accuracy and precision, 89.7% recall, 87.6% F1-score, 80% specificity, 70.3% Matthews correlation coefficient, 70.2% Cohen's kappa score, and 91% area under the receiver operating characteristic curve with 76-ms execution time. In inter-channel comparison, the best results were obtained at the F8 electrode position in the right FC of the brain. The significance of all the results was validated with a p-value of less than 0.05 using statistical hypothesis testing methods. Conclusions: The proposed scheme has achieved better results for driving drowsiness detection with the accomplishment of multiple objectives. The predictor importance approach has reduced the feature extraction cost and computational complexity is minimized with the use of conventional machine learning classifiers resulting in low-cost hardware and software requirements. The channel selection approach has spatially localized the most promising brain region for drowsiness detection with only a single EEG channel (F8) which reduces the physical intrusiveness in normal driving operation. This pBCI scheme has a good potential for practical applications requiring earlier, more accurate, and less disruptive drowsiness detection using the spectral information of EEG biosignals.
Keywords: brain–computer interface; channel selection; drowsiness detection; electroencephalography; feature selection; neurophysiology; spectral features; supervised learning.
Copyright © 2023 Arif, Munawar and Ali.
Conflict of interest statement
The authors declare that the research was conducted in the absence of any commercial or financial relationships that could be construed as a potential conflict of interest.
Figures


Similar articles
-
An Efficient Approach for Driver Drowsiness Detection at Moderate Drowsiness Level Based on Electroencephalography Signal and Vehicle Dynamics Data.J Med Signals Sens. 2022 Nov 10;12(4):294-305. doi: 10.4103/jmss.jmss_124_21. eCollection 2022 Oct-Dec. J Med Signals Sens. 2022. PMID: 36726417 Free PMC article.
-
Vector Phase Analysis Approach for Sleep Stage Classification: A Functional Near-Infrared Spectroscopy-Based Passive Brain-Computer Interface.Front Hum Neurosci. 2021 Apr 30;15:658444. doi: 10.3389/fnhum.2021.658444. eCollection 2021. Front Hum Neurosci. 2021. PMID: 33994983 Free PMC article.
-
Assessment of driver drowsiness using electroencephalogram signals based on multiple functional brain networks.Int J Psychophysiol. 2018 Nov;133:120-130. doi: 10.1016/j.ijpsycho.2018.07.476. Epub 2018 Aug 3. Int J Psychophysiol. 2018. PMID: 30081067
-
A Review of EEG Signal Features and their Application in Driver Drowsiness Detection Systems.Sensors (Basel). 2021 May 30;21(11):3786. doi: 10.3390/s21113786. Sensors (Basel). 2021. PMID: 34070732 Free PMC article. Review.
-
Driver drowsiness detection methods using EEG signals: a systematic review.Comput Methods Biomech Biomed Engin. 2023 Sep;26(11):1237-1249. doi: 10.1080/10255842.2022.2112574. Epub 2022 Aug 19. Comput Methods Biomech Biomed Engin. 2023. PMID: 35983784
Cited by
-
Feature fusion ensemble classification approach for epileptic seizure prediction using electroencephalographic bio-signals.Front Med (Lausanne). 2025 Aug 4;12:1566870. doi: 10.3389/fmed.2025.1566870. eCollection 2025. Front Med (Lausanne). 2025. PMID: 40832093 Free PMC article.
-
[Fatigue feature extraction and classification algorithm of forehead single-channel electroencephalography signals].Sheng Wu Yi Xue Gong Cheng Xue Za Zhi. 2024 Aug 25;41(4):732-741. doi: 10.7507/1001-5515.202312026. Sheng Wu Yi Xue Gong Cheng Xue Za Zhi. 2024. PMID: 39218599 Free PMC article. Chinese.
-
A Comprehensive Review of Unobtrusive Biosensing in Intelligent Vehicles: Sensors, Algorithms, and Integration Challenges.Bioengineering (Basel). 2025 Jun 18;12(6):669. doi: 10.3390/bioengineering12060669. Bioengineering (Basel). 2025. PMID: 40564485 Free PMC article. Review.
-
Beta-band desynchronization in the human hippocampus during movement preparation in a delayed reach task.Exp Brain Res. 2025 Jun 23;243(7):180. doi: 10.1007/s00221-025-07124-6. Exp Brain Res. 2025. PMID: 40549177 Free PMC article.
-
Beta-band power modulation in the human amygdala during a Direct Reach arm reaching task.Neurosci Res. 2025 Jul;216:104906. doi: 10.1016/j.neures.2025.05.001. Epub 2025 May 11. Neurosci Res. 2025. PMID: 40360082 Free PMC article.
References
-
- Abidi A., Ben Khalifa K., Ben Cheikh R., Valderrama Sakuyama C. A., Bedoui M. H. (2022). Automatic detection of drowsiness in EEG records based on machine learning approaches. Neural Process. Lett. 54, 5225–5249. 10.1007/s11063-022-10858-x - DOI
-
- Aboalayon K. a. I., Faezipour M., Almuhammadi W. S., Moslehpour S. (2016). Sleep stage classification using EEG signal analysis: A comprehensive survey and new investigation. Entropy 18, 272. 10.3390/e18090272 - DOI
-
- Akhtar T., Arif S., Mushtaq Z., Gilani S. O., Jamil M., Ayaz Y., et al. (2022). “Ensemble-based effective diagnosis of thyroid disorder with various feature selection techniques,” in 2nd International Conference of Smart Systems and Emerging Technologies (SMARTTECH), Riyadh, Saudi Arabia, 09-11 May 2022 (IEEE; ), 14–19.
LinkOut - more resources
Full Text Sources
Research Materials
Miscellaneous