. 2023 Mar 31:14:1136852.
doi: 10.3389/fphys.2023.1136852. eCollection 2023.

Altered coronary artery function, arteriogenesis and endothelial YAP signaling in postnatal hypertrophic cardiomyopathy

Affiliations

Altered coronary artery function, arteriogenesis and endothelial YAP signaling in postnatal hypertrophic cardiomyopathy

Paulina Langa et al. Front Physiol. .

Abstract

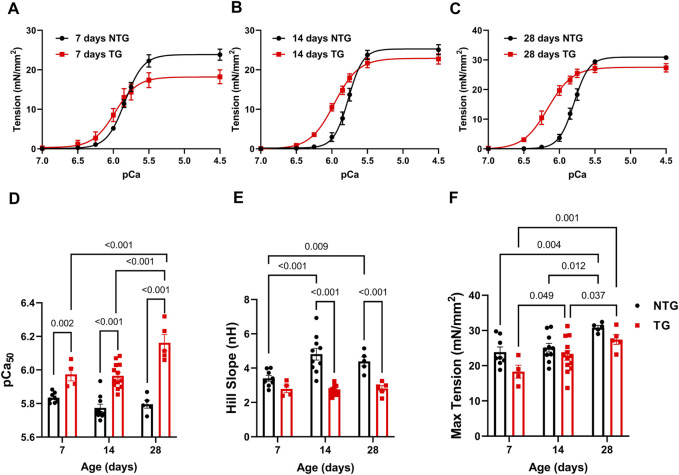
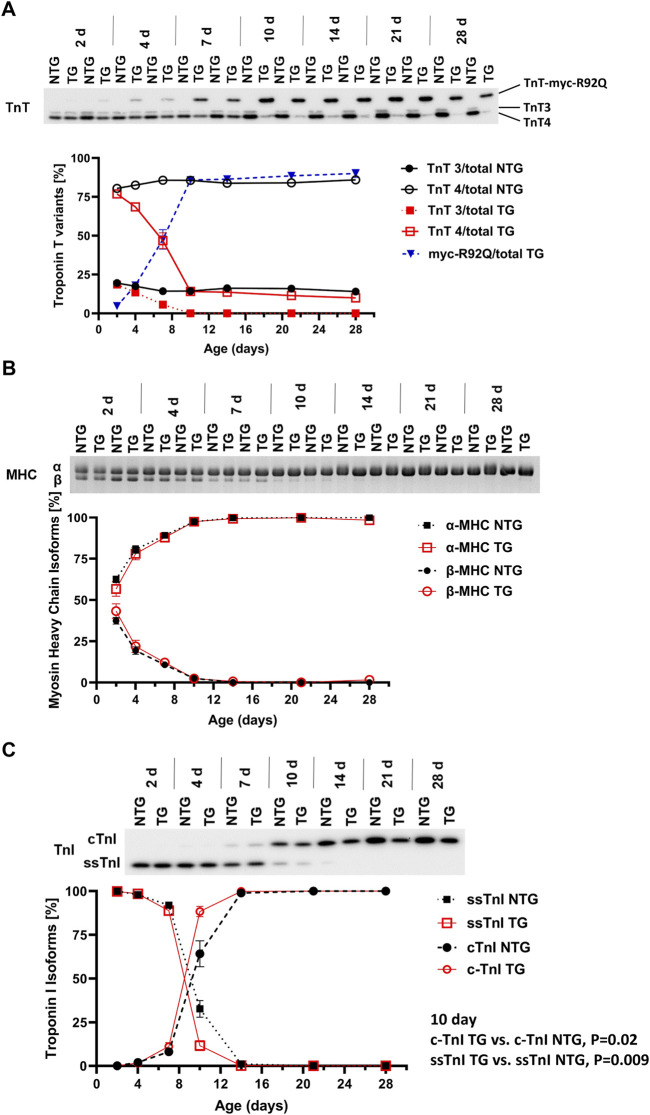
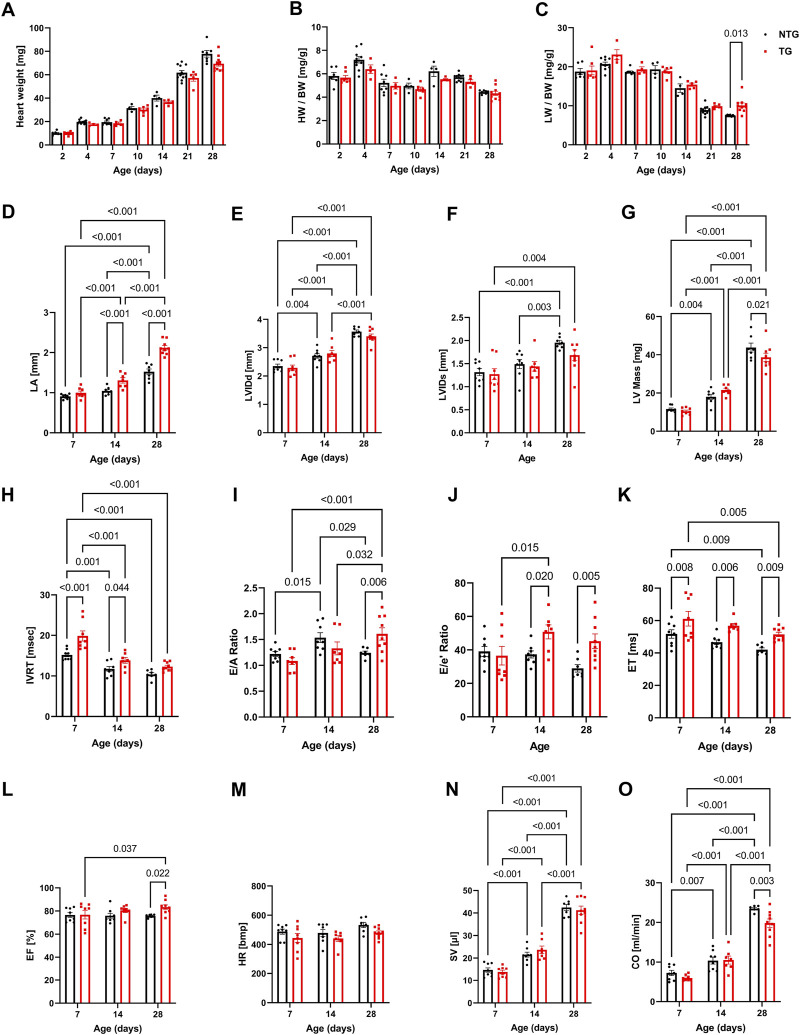
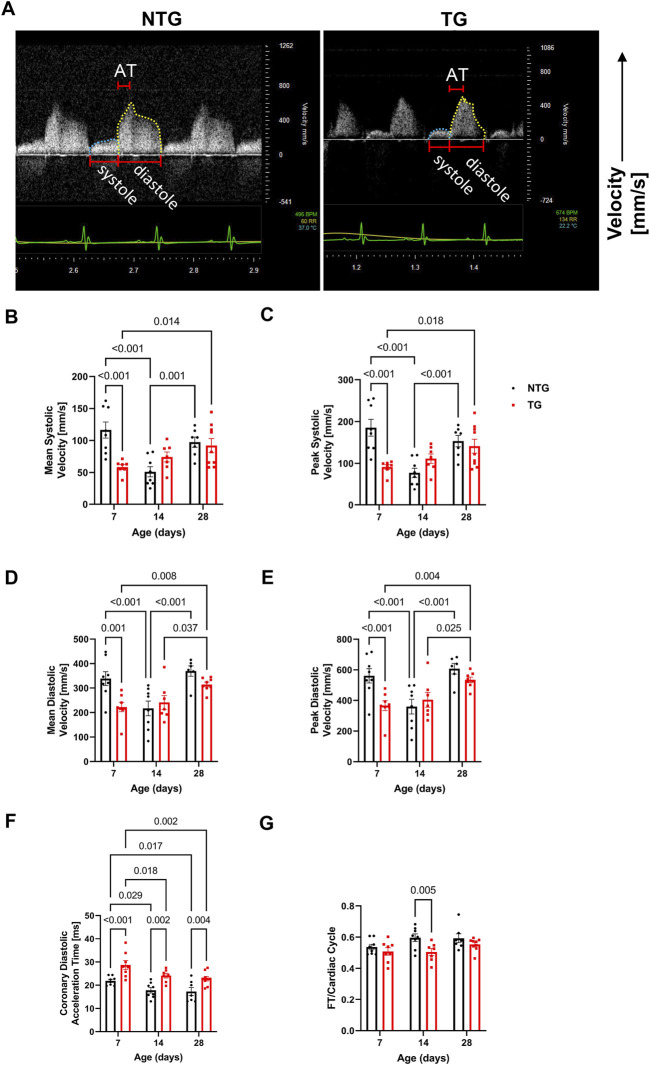
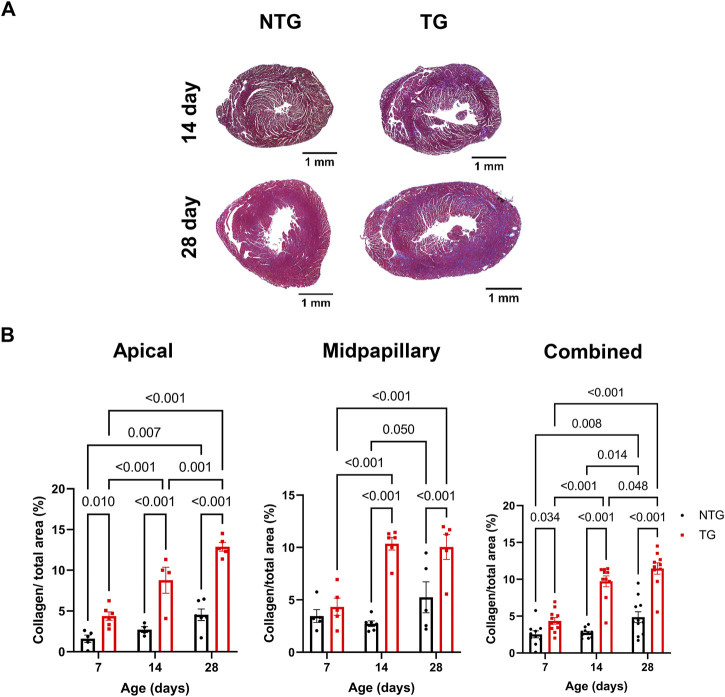
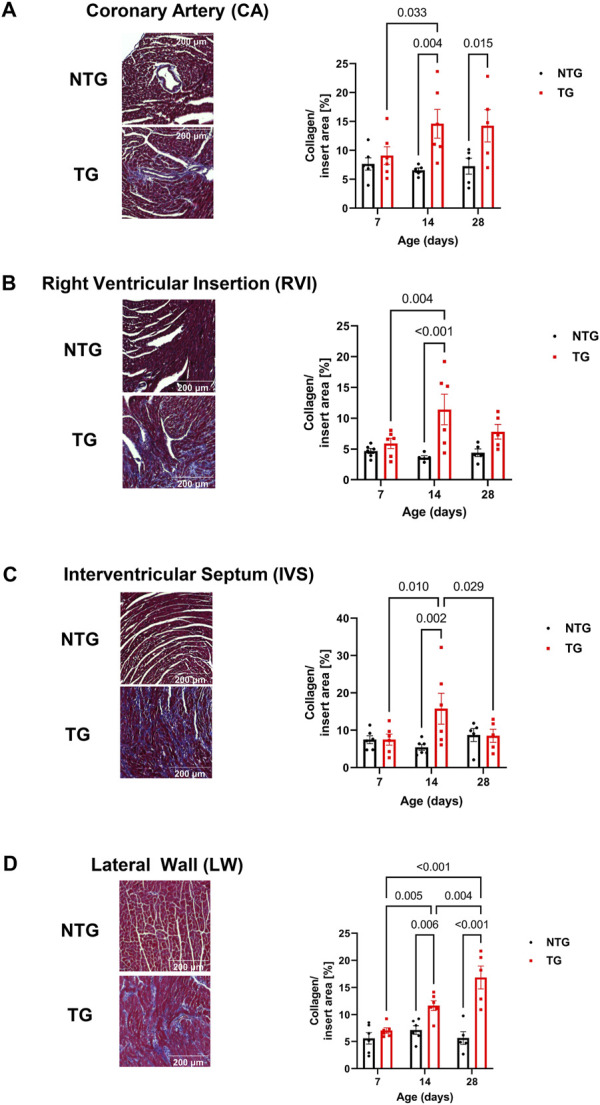
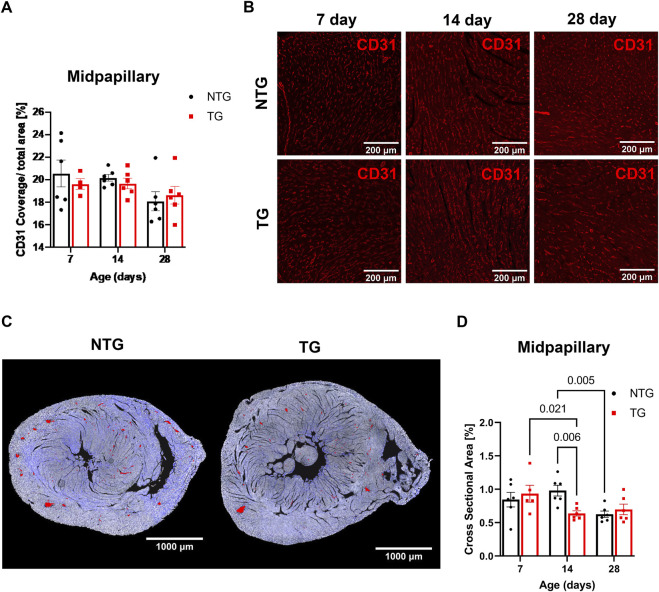
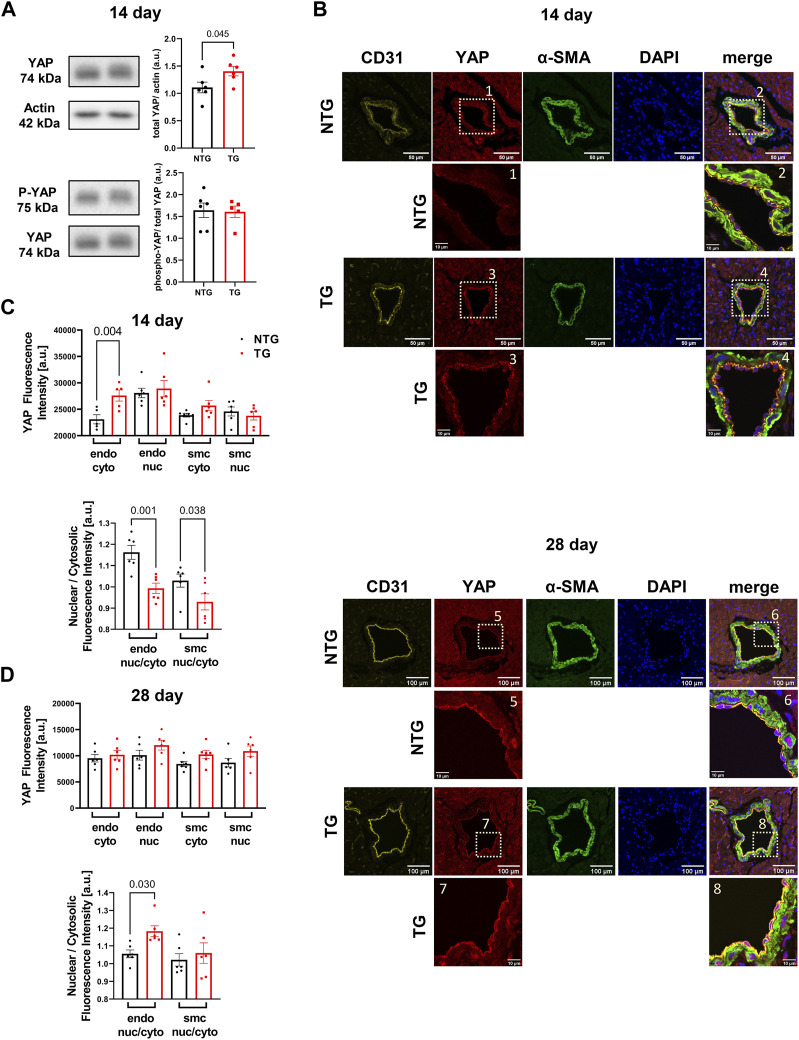
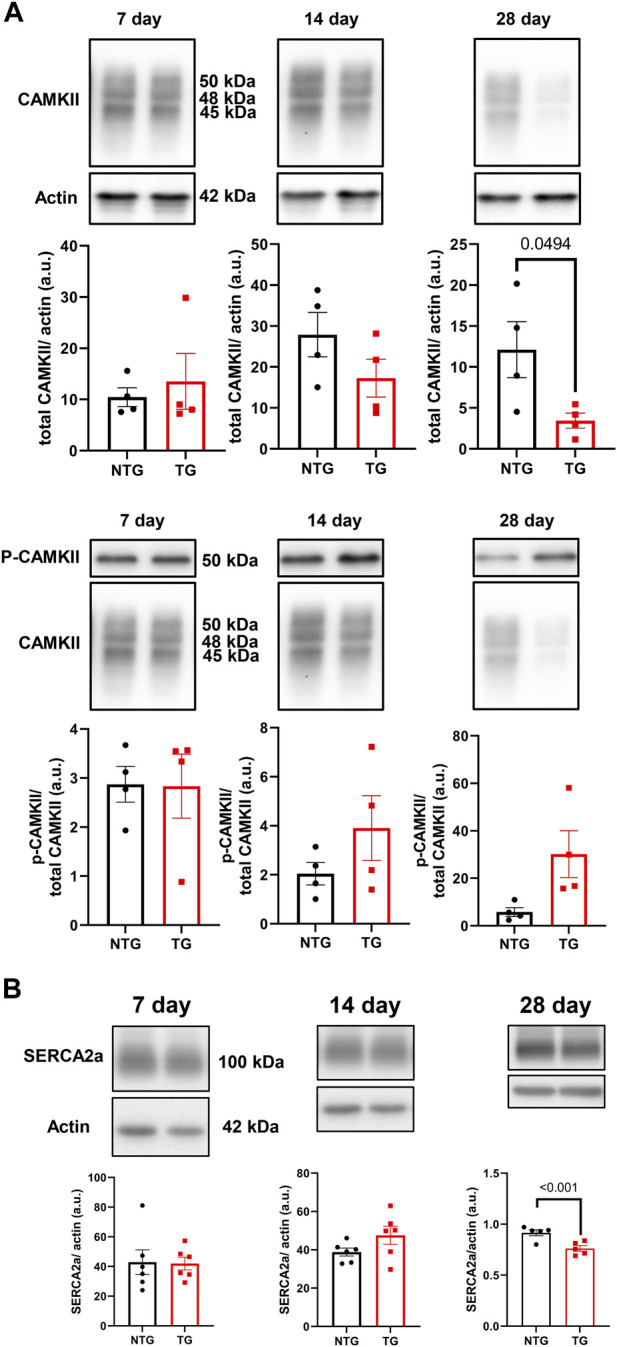
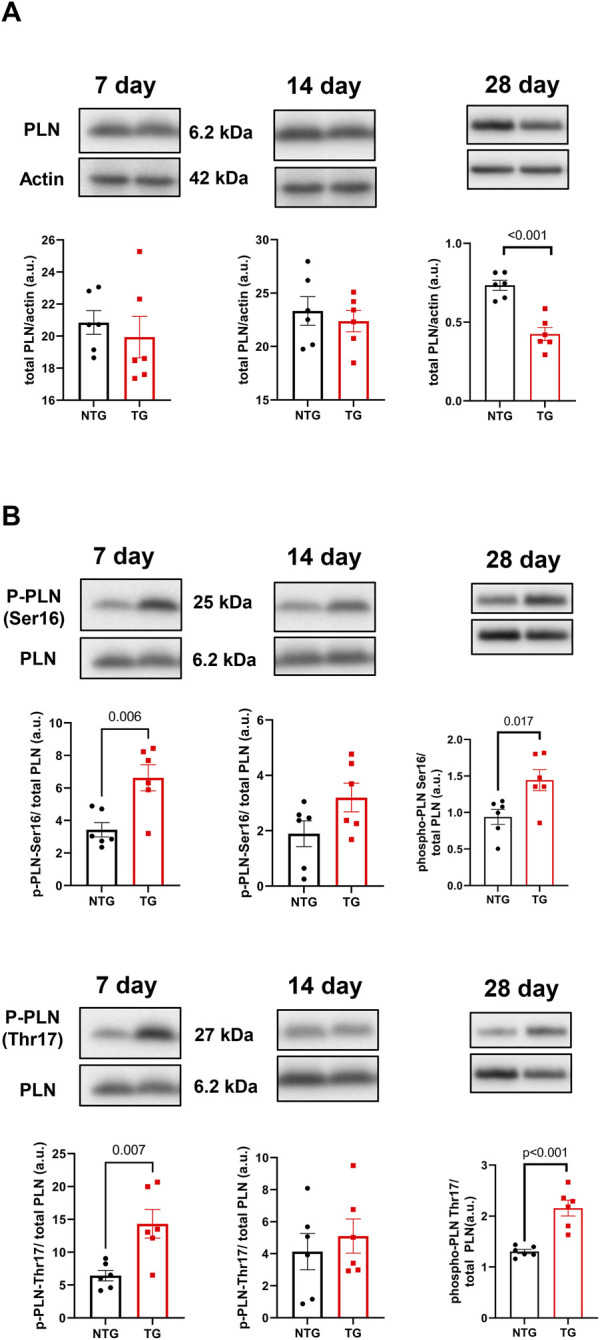
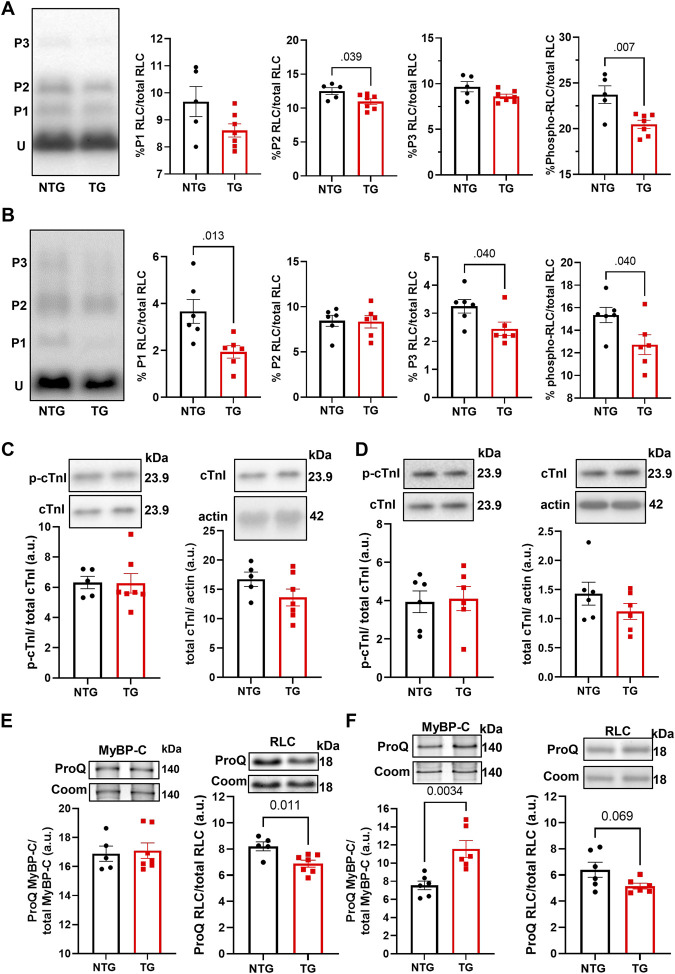
Introduction: Hypertrophic cardiomyopathy (HCM) is a cardiovascular genetic disease caused largely by sarcomere protein mutations. Gaps in our understanding exist as to how maladaptive sarcomeric biophysical signals are transduced to intra- and extracellular compartments leading to HCM progression. To investigate early HCM progression, we focused on the onset of myofilament dysfunction during neonatal development and examined cardiac dynamics, coronary vascular structure and function, and mechano-transduction signaling in mice harboring a thin-filament HCM mutation. Methods: We studied postnatal days 7-28 (P7-P28) in transgenic (TG) TG-cTnT-R92Q and non-transgenic (NTG) mice using skinned fiber mechanics, echocardiography, biochemistry, histology, and immunohistochemistry. Results: At P7, skinned myofiber bundles exhibited an increased Ca2+-sensitivity (pCa50 TG: 5.97 ± 0.04, NTG: 5.84 ± 0.01) resulting from cTnT-R92Q expression on a background of slow skeletal (fetal) troponin I and α/β myosin heavy chain isoform expression. Despite the transition to adult isoform expressions between P7-P14, the increased Ca2+- sensitivity persisted through P28 with no apparent differences in gross morphology among TG and NTG hearts. At P7 significant diastolic dysfunction was accompanied by coronary flow perturbation (mean diastolic velocity, TG: 222.5 ± 18.81 mm/s, NTG: 338.7 ± 28.07 mm/s) along with localized fibrosis (TG: 4.36% ± 0.44%, NTG: 2.53% ± 0.47%). Increased phosphorylation of phospholamban (PLN) was also evident indicating abnormalities in Ca2+ homeostasis. By P14 there was a decline in arteriolar cross-sectional area along with an expansion of fibrosis (TG: 9.72% ± 0.73%, NTG: 2.72% ± 0.2%). In comparing mechano-transduction signaling in the coronary arteries, we uncovered an increase in endothelial YAP expression with a decrease in its nuclear to cytosolic ratio at P14 in TG hearts, which was reversed by P28. Conclusion: We conclude that those early mechanisms that presage hypertrophic remodeling in HCM include defective biophysical signals within the sarcomere that drive diastolic dysfunction, impacting coronary flow dynamics, defective arteriogenesis and fibrosis. Changes in mechano-transduction signaling between the different cellular compartments contribute to the pathogenesis of HCM.

Keywords: YAP signaling; coronary flow; echocardiography; fibrosis; hypertrophic cardiomyopathy; mechano-signaling.


Conflict of interest statement

The authors declare that the research was conducted in the absence of any commercial or financial relationships that could be construed as a potential conflict of interest.

Figures

FIGURE 1
FIGURE 1
Age-dependent myofilament Ca2+ response. (A) Force-Ca2+ relation at P7, (B) at P14, and (C) at P28. (D) Summary of myofilament Ca2+ sensitivity (pCa50), (E) Hill slope, and (F) maximum tension. Data are presented as mean ± SEM. Data were analyzed by 2-way ANOVA followed by Fisher’s LSD test; N = 4–13. NTG, non-transgenic; TG, transgenic.
FIGURE 2
FIGURE 2
Timeline of myofilament isoform switches. Representative images of Western blots and SDS-PAGE summary data of expression of (A) troponin T (TnT) isoforms (N = 2 for both groups), (B) myosin heavy chain (MHC) isoforms, and (C) troponin I (TnI) isoforms in NTG and TG hearts from P2 to P28. For (B,C) N = 4 for both groups. Data are presented as mean ± SEM. NTG, non-transgenic; TG, transgenic. TnT3—adult splicing form 3 of Troponin T; TnT4—adult splicing form 4 of Troponin T; myc-R92Q, myc tag for TnT-R92Q mutation; ssTnI, slow skeletal isoform of TnI; cTnI, cardiac isoform of TnI.
FIGURE 3
FIGURE 3
Morphological, systolic and diastolic changes in NTG and HCM hearts. Summary data represent: (A) heart weight, (B) heart weight to body weight (HW/BW), (C) lung weight to body weight (LW/BW), (D) left atrial diameter (LA), (E) left ventricular internal diastolic diameter (LVIDd), (F) left ventricular internal systolic diameter (LVIDs), (G) left ventricular mass calculated based on echocardiography (LV Mass), (H) isovolumic relaxation time (IVRT), (I) E/A ratio represents peak velocity of early diastolic mitral flow divided by peak velocity of late diastolic mitral inflow, (J) E/e’ ratio represents peak velocity of early diastolic transmitral flow divided by peak velocity of early diastolic mitral annual motion, (K) ejection time (ET), (L) ejection fraction (EF), (M) heart rate (HR), (N) stroke volume (SV), and (O) cardiac output. Data reported as mean ± SEM. N = 4–9 for panels (A–D). N = 6–9 for data presented in panels (E–O). Data were analyzed by 2-way ANOVA followed by Fisher’s LSD test; NTG, non-transgenic; TG, transgenic.
FIGURE 4
FIGURE 4
Time-dependent changes in coronary flow. (A) Representative Doppler echo images of P14 coronary flow charts, with systolic flow highlighted in blue and diastolic in yellow. Summary data represent: (B) mean systolic coronary flow velocity, (C) peak systolic coronary flow velocity, (D) mean diastolic coronary flow velocity, (E) peak diastolic coronary velocity, (F) coronary diastolic acceleration time, and (G) total diastolic flow time (FT) normalized to cardiac cycle length. Data are presented as mean ± SEM, NTG n = 6, TG n = 6 and analyzed by 2-way ANOVA followed by Fisher’s LSD test; NTG, non-transgenic; TG transgenic.
FIGURE 5
FIGURE 5
Time-dependent changes in fibrosis in apical and midventricular regions of NTG and TG hearts. (A) Representative trichrome-stained midpapillary images of NTG and TG hearts at P14 and P28. (B) Quantitation of collagen deposition presented as % of covered area at P7, P14, and P28 at apical, midpapillary and total (apical and midpapillary regions combined). Data are presented as mean ± SEM. Data were analyzed by 2-way ANOVA followed by Fisher’s LSD test; NTG n = 4–6, TG n = 5–6; NTG, non-transgenic; TG, transgenic.
FIGURE 6
FIGURE 6
Time-dependent assessment of localized fibrosis. Representative images of areas with high levels of collagen deposition and quantitation of average collagen deposition in four specific locations: (A) coronary arteries, (B) right ventricular insertion (RVI), (C) interventricular septum (IVS) and (D) lateral free wall (LW). Data presented as mean ± SEM and analyzed using Two-way ANOVA followed by Fisher’s LSD test; NTG n = 5–6, TG n = 5–6. NTG, non-transgenic; TG, transgenic.
FIGURE 7
FIGURE 7
Microvessel density and arteriolar cross-sectional area at midpapillary section. (A) Quantitation of CD31 coverage in NTG and TG hearts. (B) Representative images photomicrographs of CD31 labeled (indicating endothelial cells) immunofluorescent sections taken at midpapillary levels. (C) Representative photomicrographs of midpapillary sections of whole-heart sections with arterioles are highlighted in red at P14. (D) Quantification of arteriolar cross-sectional area (%). N = 5–6. Data presented as mean ± SEM; Two-way ANOVA followed by Fisher’s LSD test.
FIGURE 8
FIGURE 8
Time-dependent expression and localization of YAP. Western blot analysis of YAP abundance (upper panel) and phosphorylation (p-YAP) (Ser-127) (lower panel) at P14 in TG and NTG hearts (A); Representative immunohistochemistry (IHC) images of coronary vessels from NTG and TG hearts stained with fluorescent antibodies against CD31, YAP, α-SMA and DAPI. The merged images represent CD31/YAP/α-SMA with nuclear DAPI counterstaining of the coronary artery region at the basal section of the heart at P14 (B). Inserts below were taken from YAP and merged images at higher magnification; Cytosolic and nuclear YAP fluorescence signal in endothelial (endo) and smooth muscle cells (smc) in the heart sections and a ratio of nuclear/cytosolic YAP expression in the endothelial and smooth muscle cells (smc) in the heart sections at P14 (C), and P28 (D). Data presented as mean ± SEM and analyzed using Student’s t-test (A), NTG N = 6, TG N = 6 and One-way ANOVA followed by Fisher’s LSD test. NTG N = 5–6, TG N = 5–6 (C,D). NTG, non-transgenic; TG, transgenic.
FIGURE 9
FIGURE 9
The effects of R92Q-cTnT on Calcium Signaling—CAMKII and SERCA2a abundance. (A) Western blot analysis of CAMKII abundance and phosphorylation of CAMKII and (B) SERCA2a abundance in NTG and TG hearts. NTG, non-transgenic; TG, transgenic. Data presented as mean ± SEM and analyzed using unpaired Student’s t-test, NTG N = 6, TG N = 5–6.
FIGURE 10
FIGURE 10
The effects of R92Q-cTnT on calcium signaling—phospholamban (PLN) abundance and phosphorylation. Western blot analysis of PLN abundance (A) and phosphorylation of PLN at Ser16 and Thr17 (B) in NTG and TG hearts. NTG, non-transgenic; TG, transgenic. Data presented as mean ± SEM and analyzed using unpaired Student’s t-test, NTG N = 6, TG N = 5–6.
FIGURE 11
FIGURE 11
The Effects of R92Q-cTnT and age on myofilament phosphorylation. (A) PhosTag separation of RLC at P7. Left most panel representative PhosTag Western blot of RLC phosphorylated species (P1-P3) and unmodified RLC (U). The histograms depict the densitometric analysis of relative percent phosphorylation from the left most representative image. (B) PhosTag separation of RLC at P14. Left most panel representative PhosTag Western blot of RLC phosphorylated species (P1-P3) and unmodified RLC (U). The histograms depict the densitometric analysis of relative percent phosphorylation from the left most representative image. (C) Western blot analysis of cardiac troponin I (cTnI) and its phosphorylation abundance at positions 23/24 at P7. The left most panel is an analysis of the phosphorylation abundances while the right most panel is the analysis of total troponin I abundance. Images above the histograms are representative Western blot images. (D) Western blot analysis of cardiac troponin I (cTnI) and its phosphorylation abundance at positions 23/24 at P14. The left most panel is an analysis of the phosphorylation abundances while the right most panel is the analysis of total troponin I abundance. Images above the histograms are representative Western blot images. (E) Heart samples from P7 mice were separated in a 15% SDS-PAGE gel stained with Pro-Q Diamond phospho-specific stain and Coomassie G-250 total protein stain. The left most panel is the analysis of myosin binding protein-C (MyBP-C) phosphorylation abundance and the right most panel is the analysis of regulatory light chain. (F) Heart samples from P14 were separated in a 15% SDS-PAGE gel stained with Pro-Q Diamond phospho-specific stain and Coomassie G-250 total protein stain. The left most panel is the analysis of myosin binding protein-C (MyBP-C) phosphorylation abundance and the right most panel is the analysis of regulatory light chain. Data are presented as mean ± SEM and analyzed using unpaired Student’s t-test; N = 5–7.

Similar articles

Cited by

References

    1. Aguiar Rosa S., Rocha Lopes L., Fiarresga A., Ferreira R. C., Mota Carmo M. (2021). Coronary microvascular dysfunction in hypertrophic cardiomyopathy: Pathophysiology, assessment, and clinical impact. Microcirculation 28, e12656. 10.1111/micc.12656 - DOI - PubMed
    1. Alves M. L., Dias F. a. L., Gaffin R. D., Simon J. N., Montminy E. M., Biesiadecki B. J., et al. (2014). Desensitization of myofilaments to Ca2+ as a therapeutic target for hypertrophic cardiomyopathy with mutations in thin filament proteins. Circ. Cardiovasc Genet. 7, 132–143. 10.1161/CIRCGENETICS.113.000324 - DOI - PMC - PubMed
    1. Anderson P. A., Malouf N. N., Oakeley A. E., Pagani E. D., Allen P. D. (1991). Troponin T isoform expression in humans. A comparison among normal and failing adult heart, fetal heart, and adult and fetal skeletal muscle. Circ. Res. 69, 1226–1233. 10.1161/01.res.69.5.1226 - DOI - PubMed
    1. Araujo A. Q., Arteaga E., Ianni B. M., Buck P. C., Rabello R., Mady C. (2005). Effect of Losartan on left ventricular diastolic function in patients with nonobstructive hypertrophic cardiomyopathy. Am. J. Cardiol. 96, 1563–1567. 10.1016/j.amjcard.2005.07.065 - DOI - PubMed
    1. Briston S. J., Dibb K. M., Solaro R. J., Eisner D. A., Trafford A. W. (2014). Balanced changes in Ca buffering by SERCA and troponin contribute to Ca handling during beta-adrenergic stimulation in cardiac myocytes. Cardiovasc Res. 104, 347–354. 10.1093/cvr/cvu201 - DOI - PMC - PubMed