

Characterization of the oral and gut microbiome in children with obesity aged 3 to 5 years
- PMID: 37065198
- PMCID: PMC10090557
- DOI: 10.3389/fcimb.2023.1102650
Characterization of the oral and gut microbiome in children with obesity aged 3 to 5 years
Abstract
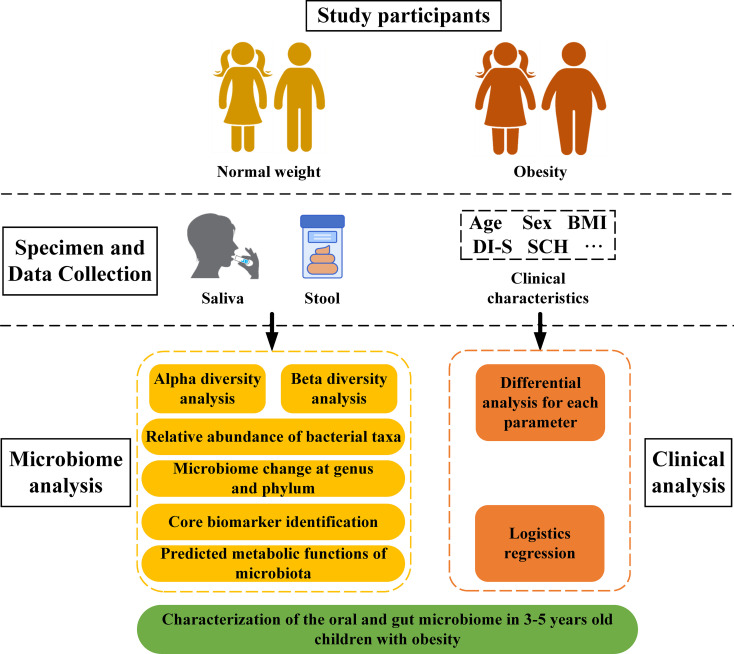
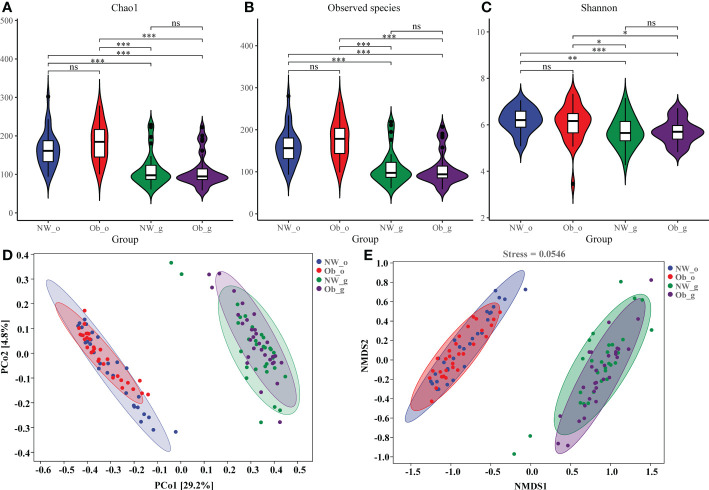
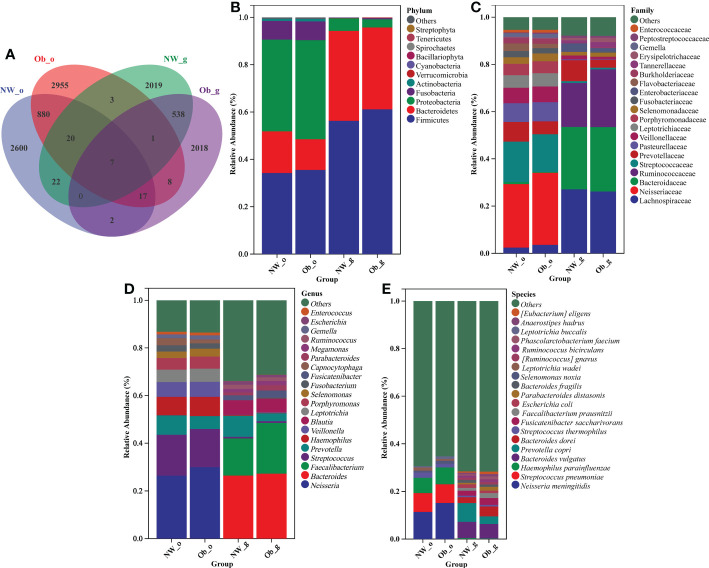
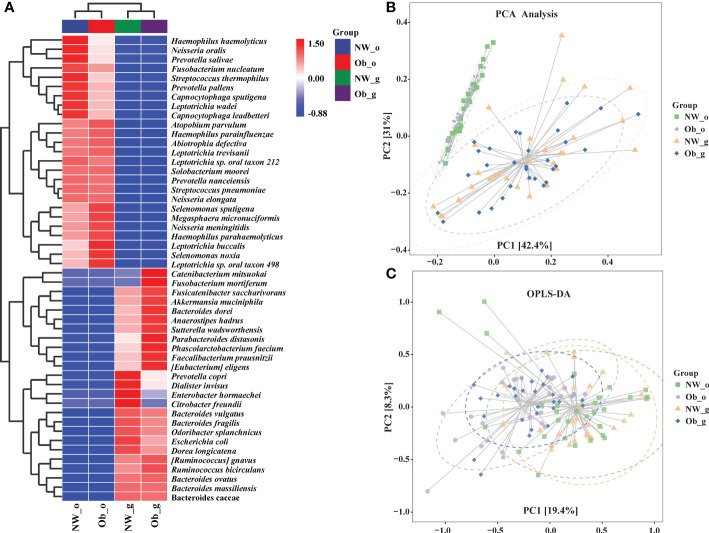
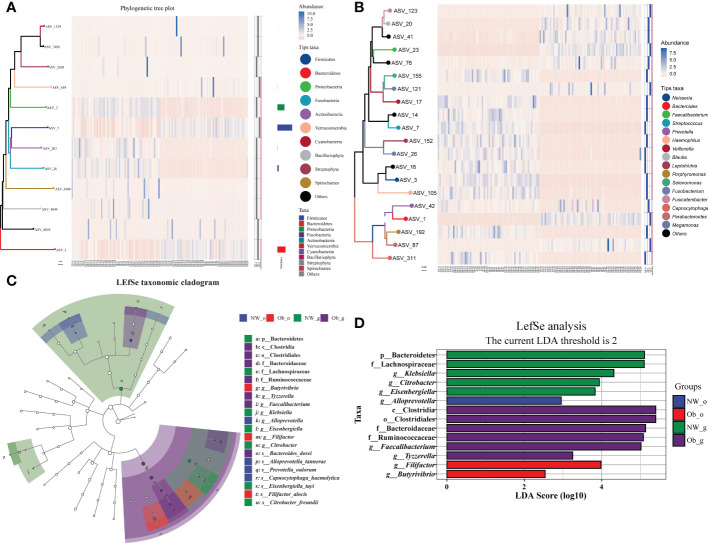
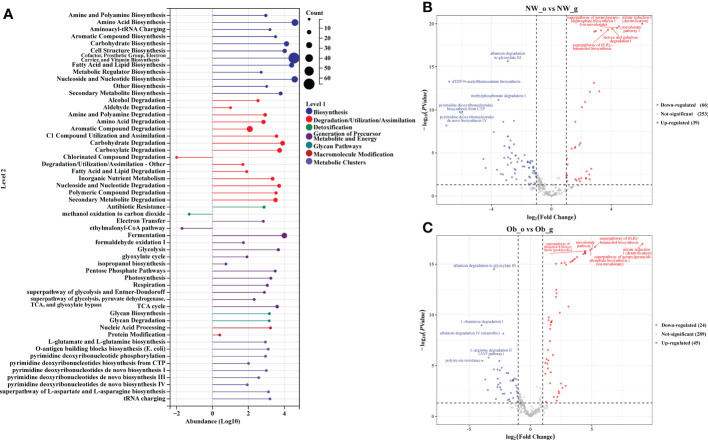
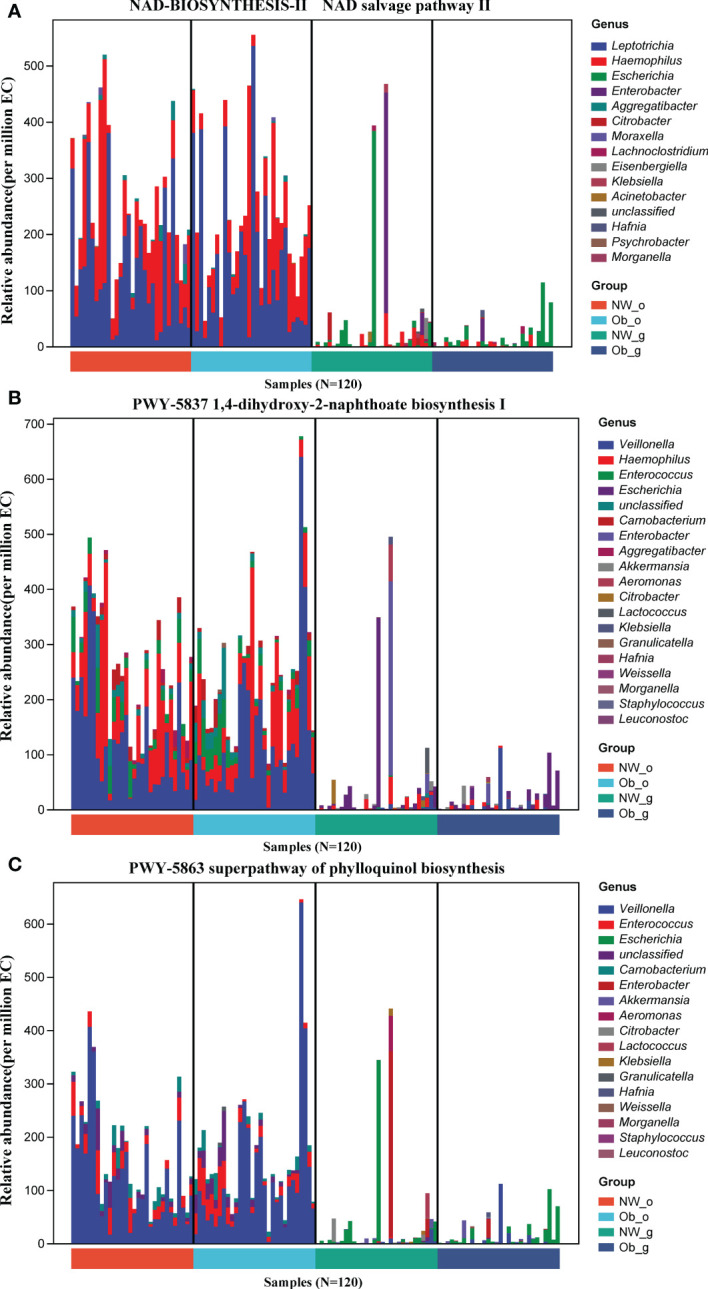
The ever-increasing global prevalence of obesity has trended towards a younger age. The ecological characteristics and changes of the oral and gut microbial community during childhood are poorly understood.In this study, we analyzed the salivary and fecal microbiota of 30 children with obesity and 30 normal weight children aged 3-5 years via third-generation long-range DNA sequencing,with the aim of understanding the structure of childhood microbiota and identifying specific oral and gut microbial lineages and genera in children that may be associated with obesity.The results revealed significant variation in alpha diversity indices among the four groups (Chao1: P < 0.001; observed species: P < 0.001; Shannon < 0.001). Principal coordinate analysis (PCoA) and nonmetric multidimensional scaling (NMDS) revealed significant differences in oral and gut microbial community structure between obesity and controls. The Firmicutes/Bacteroidetes (F/B) abundance ratios of oral and intestinal flora among children with obesity were higher than those of controls. The most abundant phyla and genera found in oral and intestinal flora were Firmicutes, Proteobacteria, Bacteroidetes, Neisseria, Bacteroides, Faecalibacterium, Streptococcus, Prevotella and so on. Linear discriminant analysis effect size (LEfSe) revealed higher proportions of Filifactor (LDA= 3.98; P < 0.05) and Butyrivibrio (LDA = 2.54; P < 0.001) in the oral microbiota of children with obesity, while the fecal microbiota of children with obesity were more enriched with Faecalibacterium (LDA = 5.02; P < 0.001), Tyzzerella (LDA=3.25; P < 0.01), Klebsiella (LDA = 4.31; P < 0.05),which could be considered as dominant bacterial biomarkers for obesity groups.A total of 148 functional bacterial pathways were found to significantly differ in the oral and gut microbiota among controls and obesity using PICRUSt 2. Most predicted functional pathways were clustered in biosynthesis. In conclusion, This work suggests there were significant differences in oral and gut microbiota in controls and obesity groups, microbiota dysbiosis in childhood might have significant effect on the development of obesity.
Keywords: gut microbiome; high-throughput sequencing; obesity; oral microbiome; preschool children.
Copyright © 2023 Ma, Wu, Lin, Shan, Abasijiang and Zhao.
Conflict of interest statement
The authors declare that the research was conducted in the absence of any commercial or financial relationships that could be construed as a potential conflict of interest.
Figures
Similar articles
-
Alteration of the gut microbiota associated with childhood obesity by 16S rRNA gene sequencing.PeerJ. 2020 Jan 14;8:e8317. doi: 10.7717/peerj.8317. eCollection 2020. PeerJ. 2020. PMID: 31976177 Free PMC article.
-
Fecal 16S rRNA Gene Sequencing Analysis of Changes in the Gut Microbiota of Rats with Low-Dose Aspirin-Related Intestinal Injury.Biomed Res Int. 2021 Apr 13;2021:8848686. doi: 10.1155/2021/8848686. eCollection 2021. Biomed Res Int. 2021. PMID: 33954200 Free PMC article.
-
Gut Microbiota May Play a Significant Role in the Pathogenesis of Graves' Disease.Thyroid. 2021 May;31(5):810-820. doi: 10.1089/thy.2020.0193. Epub 2021 Jan 7. Thyroid. 2021. PMID: 33234057 Free PMC article.
-
Childhood Obesity and Firmicutes/Bacteroidetes Ratio in the Gut Microbiota: A Systematic Review.Child Obes. 2018 Nov/Dec;14(8):501-509. doi: 10.1089/chi.2018.0040. Epub 2018 Sep 5. Child Obes. 2018. PMID: 30183336
-
Microbial dysbiosis in obstructive sleep apnea: a systematic review and meta-analysis.Front Microbiol. 2025 May 15;16:1572637. doi: 10.3389/fmicb.2025.1572637. eCollection 2025. Front Microbiol. 2025. PMID: 40444003 Free PMC article.
Cited by
-
The early-life gut microbiome in common pediatric diseases: roles and therapeutic implications.Front Nutr. 2025 May 29;12:1597206. doi: 10.3389/fnut.2025.1597206. eCollection 2025. Front Nutr. 2025. PMID: 40510495 Free PMC article. Review.
-
Integrating Metabolomics and Gut Microbiota to Identify Key Biomarkers and Regulatory Pathways Underlying Metabolic Heterogeneity in Childhood Obesity.Nutrients. 2025 May 30;17(11):1876. doi: 10.3390/nu17111876. Nutrients. 2025. PMID: 40507148 Free PMC article.
-
Exploring the interplay between antiretroviral therapy and the gut-oral microbiome axis in people living with HIV.Sci Rep. 2024 Aug 1;14(1):17820. doi: 10.1038/s41598-024-68479-4. Sci Rep. 2024. PMID: 39090139 Free PMC article.
-
The Obesity-Epigenetics-Microbiome Axis: Strategies for Therapeutic Intervention.Nutrients. 2025 May 1;17(9):1564. doi: 10.3390/nu17091564. Nutrients. 2025. PMID: 40362873 Free PMC article. Review.
-
Characterization of the upper respiratory tract microbiota in Chilean asthmatic children reveals compositional, functional, and structural differences.Front Allergy. 2023 Jul 28;4:1223306. doi: 10.3389/falgy.2023.1223306. eCollection 2023. Front Allergy. 2023. PMID: 37577334 Free PMC article.
References
-
- Araujo D. S., Klein M. I., Scudine K. G. O., de Sales Leite L., Parisotto T. M., Ferreira C. M., et al. . (2020). Salivary microbiological and gingival health status evaluation of adolescents with overweight and obesity: A cluster analysis. Front. Pediatr. 8. doi: 10.3389/fped.2020.00429 - DOI - PMC - PubMed
Publication types
MeSH terms
Substances
LinkOut - more resources
Full Text Sources