. 2023 Mar 31:10:1089733.
doi: 10.3389/fvets.2023.1089733. eCollection 2023.

Melatonin ameliorates serobiochemical alterations and restores the cardio-nephro diabetic vascular and cellular alterations in streptozotocin-induced diabetic rats

Affiliations

Melatonin ameliorates serobiochemical alterations and restores the cardio-nephro diabetic vascular and cellular alterations in streptozotocin-induced diabetic rats

Ehab Kotb Elmahallawy et al. Front Vet Sci. .

Erratum in

Abstract

Melatonin possesses a wide range of pharmacological activities, including antidiabetic properties. Diabetes mellitus (DM) induces several physiopathological changes in body organs, which could be observed lately after systemic failure. In the current study, we aimed to investigate the serobiochemical changes and the histopathological picture in the diabetic heart and the kidney early before chronic complications and highlight the association between hyperglycemia, glomerular alterations, and cardiovascular changes. In addition, the role of melatonin in the treatment of cardio-nephro diabetic vascular and cellular adverse changes in streptozotocin-induced diabetic rats was also studied. A total of 40 mature Wistar albino rats were distributed into five groups; (1) control untreated rats, (2) diabetic mellitus untreated (DM) rats, in which DM was induced by the injection of streptozotocin (STZ), (3) control melatonin-treated (MLT), (4) melatonin-treated diabetic (DM + MLT) rats, in which melatonin was injected (10 mg/kg/day, i.p.) for 4 weeks, and (5) insulin-treated diabetic (DM + INS) rats. The serum biochemical analysis of diabetic STZ rats showed a significant (P < 0.05) increase in the concentrations of blood glucose, total oxidative capacity (TOC), CK-MB, endothelin-1, myoglobin, H-FABP, ALT, AST, urea, and creatinine as compared to control rats. In contrast, there was a significant (P < 0.05) decrease in serum concentration of insulin, total antioxidative capacity (TAC), total nitric oxide (TNO), and total protein level in DM rats vs. the control rats. Significant improvement in the serobiochemical parameters was noticed in both (DM + MLT) and (DM + INS) groups as compared with (DM) rats. The histological examination of the DM group revealed a disorder of myofibers, cardiomyocyte nuclei, and an increase in connective tissue deposits in between cardiac tissues. Severe congestion and dilation of blood capillaries between cardiac muscle fibers were also observed. The nephropathic changes in DM rats revealed various deteriorations in glomeruli and renal tubular cells of the same group. In addition, vascular alterations in the arcuate artery at the corticomedullary junction and interstitial congestion take place. Melatonin administration repaired all these histopathological alterations to near-control levels. The study concluded that melatonin could be an effective therapeutic molecule for restoring serobiochemical and tissue histopathological alterations during diabetes mellitus.

Keywords: H-FABP; TNO; endothelin-1; heart; kidney; melatonin.


Conflict of interest statement

The authors declare that the research was conducted in the absence of any commercial or financial relationships that could be construed as a potential conflict of interest.

Figures

Figure 1
Figure 1
Photomicrograph of longitudinal sections of the left ventricular cardiac tissue sections from control rats (G1): (A–C): branching and anastomosing cardiac muscle fibers (MFs) with an acidophilic sarcoplasm and centrally located cigar-shaped vesicular nuclei (arrows). (C): Normal blood vascular structure (arrowhead). H&E stain. The bar size [(A, B) = 20 μm and (C) = 50 μm].
Figure 2
Figure 2
Photomicrograph of ventricular cardiac tissue sections from melatonin control rats (G3): [(A) magnified in (B, C)]: normal endocardium lined internally with continuous endothelium (blue arrowheads), inner subendothelium containing the impulse-conducting cardiac muscle fibers (Purkinjie fibers) (stars), and branching and anastomosing cardiac muscle fibers (MFs) with an acidophilic sarcoplasm and centrally located cigar-shaped vesicular nuclei (arrows). Normal blood vessel with a normal wall thickening (zigzag arrows). Normal blood capillaries in between cardiac muscle fibers (arrowheads). H&E stain. The bar size [(A) = 50 μm and (B, C) = 20 μm].
Figure 3
Figure 3
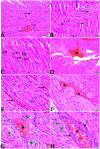
Photomicrograph of ventricular cardiac tissue sections from diabetic untreated rats (G2): (A, B): deformation in sizes with a disarrayed pattern of cardiac muscle fibers (arrows), (C): nuclear changes (zigzag arrows) in cardiac myocytes (MFs), (D): severe congestion (star), (E): congested and dilated capillaries in between cardiac muscle fibers (arrows), (F, G): severe congestion in the blood vessels (stars) surrounded by vacuolated cells (arrowheads), and (H): congested blood vessel (star) with a thick hyalinized wall (arrows), surrounded by vacuolated cells (arrowheads). H&E stain. The bar size [(A, F) = 50 μm, (B, C, E, G, H) = 20 μm, and (D) = 100 μm].
Figure 4
Figure 4
Photomicrograph of cardiac tissue sections from diabetic rats treated with melatonin (G4): (A): normal endocardium lined internally with continuous endothelium (arrow), (A, B): a marked improvement in the orientation and size of cardiac myofibers (MF), (C, D): cardiac muscle fibers (MFs) showed a normal acidophilic sarcoplasm and centrally located cigar-shaped vesicular nuclei (zigzag arrows). Mild congested capillaries in between cardiac muscle fibers (arrows). H&E stain. The bar size [(A) = 50 μm, (B–D) = 20 μm].
Figure 5
Figure 5
Photomicrograph of cardiac tissue sections from diabetic rats treated with insulin (G5): (A): cardiac muscle fibers with more or less normal acidophilic sarcoplasm and centrally located cigar-shaped vesicular nuclei (arrowheads), mild congested capillaries in between cardiac muscle fibers (arrows), (B): improvement in the orientation and size of cardiac myofibers (arrows), (C): congestion in blood vessels (arrows), and (D): thick vascular wall. H&E stain. The bar size [(A, B) = 20 μm, (C) = 100, and (D) = 50 μm].
Figure 6
Figure 6
Photomicrograph of cardiac tissue sections from the experimental groups stained with Masson's trichrome stain showed (A, B): cardiac tissue sections from control rats, (C, D): cardiac tissue sections from MT control rats showed normal fine threads of collagenous fibers between cardiac myofibers (arrows), (E–G): cardiac tissue sections from diabetic untreated rats, (E, F): showed dense collagenous fibers between cardiac myofibers (arrows) and thick fibroses in a vascular wall [(G), arrowhead], (H–J): cardiac tissue sections from diabetic rats treated with melatonin showed fine threads of collagenous fibers between cardiac myofibers (arrows), (K, L): cardiac tissue sections from diabetic rats treated with insulin showed fine threads of collagenous fibers between cardiac myofibers (arrows). The bar size [(A, D–L) = 50 μm, (B, C) = 100 μm].
Figure 7
Figure 7
Histomorphometric graph showing quantitative and semiquantitative measurements of lesion scores recorded in cardiac tissue sections among the experimental groups: (A): cardiomyocyte widths and (B): collagenous fibrous score. Data are expressed as means ± standard deviations. Significant differences vs. the control group are marked by different asterisks through one-way ANOVA with Tukey's post hoc test: *p ≤ 0.05, **p ≤ 0.01, ***p ≤ 0.001.
Figure 8
Figure 8
Photomicrograph of kidney tissue sections from control rats (G1): (A): normal cortical structure compromising in normal glomerular size and structure (arrow) and normal renal tubules (arrowheads), (B): normal glomerular basement membrane thickening (arrows), and (C, D): normal renal medullary tubular structure (arrows). (A&C, H&E stain) (B&D, PAS). The bar size [(A) = 20 μm, (B–D) = 50 μm].
Figure 9
Figure 9
Photomicrograph of kidney tissue sections from melatonin control rats (G3): showing (A): normal cortical structure compromising in normal glomerular size and structure (arrow), (B): normal glomerular basement membrane thickening (arrows). (C): normal proximal (arrowheads) and distal (arrows) convoluted tubules, (D): normal renal medullary tubular structure (arrows). (A, H&E stains) (B, C&D, PAS). The bar size [(A, D) = 100 μm, (B, C) = 20 μm].
Figure 10
Figure 10
Photomicrograph of kidney tissue sections from diabetic untreated rats (G2): (A–C): glomerular distortion with intraglomerular congestion (arrowheads), severe interstitial cortical congestion (stars), [(D) magnified in (E)]: vacuolar degeneration markedly in distal convoluted tubules (arrows), degeneration and desquamation in epithelium lining the proximal convoluted tubules (arrowheads), (F): thickening in the arcuate artery at the corticomedullary junction (arrow) and fibrosis infiltrated with mononuclear cellular infiltration (arrowheads), and [(G) magnified in (H)]: medullary renal tubular dilatation (arrows) and interstitial fibrosis infiltrated with mononuclear inflammatory cells (zigzag arrows). Interstitial inflammatory cellular infiltration in between medullary renal tubules (arrows). H&E stain. The bar size [(A) = 20, (B, D–F, H) = 50 μm, (C, G, I) = 100 μm].
Figure 11
Figure 11
Photomicrograph of kidney tissue sections from diabetic untreated rats (G2): showing (A–C): thickening in the glomerular basement membrane (membranous glomerulonephritis) (Bowman's capsule membrane) (arrows), thickening in the glomerular capillary membrane with expansion in mesangial cells (arrowheads), and thickening in the basement membrane lining renal tubules [(B) zigzag arrows]. Variable degenerative changes in cortical renal tubules [(A, C), red arrows], (D): cortical interstitial congestion (stars), (E): severe vacuolar degeneration in epithelium lining distal convoluted tubules (arrowheads), and (F): dilatation with vacuolar degeneration in epithelium lining medullary renal tubules (arrowheads) and interstitial fibrosis infiltrated with mononuclear inflammatory cells (arrows). PAS stain, the bar size [(A–C, E, F) = 20 μm and (D) = 50 μm].
Figure 12
Figure 12
Photomicrograph of kidney tissue sections from diabetic rats treated with melatonin (G4): showing [(A) magnified in (B)]: normal glomerular size and structure (arrows), normal proximal (red arrowheads) and distal (black arrowhead), (C): vacuolar degeneration in some proximal (red arrowheads) and distal (black arrowheads), (D): interstitial mononuclear inflammatory cellular infiltration (arrows), (E): normal arcuate artery at the corticomedullary junction (arrow), (F): mild interstitial mononuclear inflammatory cellular infiltration (arrows), [(G) magnified in (H)]: mild thickening of the glomerular basement membrane (membranous glomerulonephritis) (Bowman's capsule membrane) (arrowheads) and mild expansion in mesangial cells (elbow arrows). Mild thickening in the basement membrane lining renal tubules (arrows), and (I): mild interstitial fibrosis between medullary renal tubules (arrows). (A–F, H&E stain, G–I, PAS), the bar size [(A, C, D, G, I) = 50 μm, (B, H) =20 μm, and (E, F) = 100 μm].
Figure 13
Figure 13
Photomicrograph of kidney tissue sections from diabetic rats treated with insulin (G5): (A): a normal glomerular size with mild intraglomerular congestion (arrow) and mild vacuolar degeneration in cortical renal tubules (red arrowheads), (B): mild thickening of the glomerular basement membrane (Bowman's capsule membrane) (arrow), (C): normal arcuate artery at the corticomedullary junction (arrow), and (D): normal renal medullary renal tubules (arrows). (A, C&D, H&E stain, B, PAS), the bar size [(A) = 20 μm, (B) = 50 μm, and (C, D) = 100 μm].
Figure 14
Figure 14
Histomorphometric graph showing semiquantitative measurements of lesion scores recorded in kidney tissue sections among the experimental groups: (A): glomerular lesion score, (B): interstitial lesion score, (C): renal tubular lesion score, and (D): vascular lesion score. Data are expressed as means ± standard deviations. Significant differences vs. the control group are marked by different asterisks through one-way ANOVA with Tukey's post hoc test: *p ≤ 0.05, **p ≤ 0.01, ***p ≤ 0.001.

References

    1. Sirisha A, Gaur GS, Pal P, Bobby Z, Balakumar B, Pal GK. Effect of honey and insulin treatment on oxidative stress and nerve conduction in an experimental model of diabetic neuropathy Wistar rats. PLoS ONE. (2021) 16:e0245395. 10.1371/journal.pone.0245395 - DOI - PMC - PubMed
    1. Adam M, Tan JH, Ng EY. The effect of diabetes on cardiovascular system. J Mech Med Biol. (2017) 17:1740008. 10.1142/S0219519417400085 - DOI
    1. Odum EP, Young EE. Elevated cardiac troponin I, creatine kinase and myoglobin and their relationship with cardiovascular risk factors in patients with type 2 diabetes. Diabetes Metabol Synd Clin Res Rev. (2018) 12:141–5. 10.1016/j.dsx.2017.12.001 - DOI - PubMed
    1. Abdelsamia EM, Khaleel SA, Balah A, Baky NAA. Curcumin augments the cardioprotective effect of metformin in an experimental model of type I diabetes mellitus; Impact of Nrf2/HO-1 and JAK/STAT pathways. Biomed Pharmacother. (2019) 109:2136–44. 10.1016/j.biopha.2018.11.064 - DOI - PubMed
    1. Kovacic JC, Castellano JM, Farkouh ME, Fuster V. The relationships between cardiovascular disease and diabetes: focus on pathogenesis. Endocrinol Metabol Clin. (2014) 43:41–57. 10.1016/j.ecl.2013.09.007 - DOI - PubMed