. 2023 Mar 30:14:1111816.
doi: 10.3389/fgene.2023.1111816. eCollection 2023.

Clustering and machine learning-based integration identify cancer associated fibroblasts genes' signature in head and neck squamous cell carcinoma

Affiliations

Clustering and machine learning-based integration identify cancer associated fibroblasts genes' signature in head and neck squamous cell carcinoma

Qiwei Wang et al. Front Genet. .

Abstract

Background: A hallmark signature of the tumor microenvironment in head and neck squamous cell carcinoma (HNSCC) is abundantly infiltration of cancer-associated fibroblasts (CAFs), which facilitate HNSCC progression. However, some clinical trials showed targeted CAFs ended in failure, even accelerated cancer progression. Therefore, comprehensive exploration of CAFs should solve the shortcoming and facilitate the CAFs targeted therapies for HNSCC. Methods: In this study, we identified two CAFs gene expression patterns and performed the single-sample gene set enrichment analysis (ssGSEA) to quantify the expression and construct score system. We used multi-methods to reveal the potential mechanisms of CAFs carcinogenesis progression. Finally, we integrated 10 machine learning algorithms and 107 algorithm combinations to construct most accurate and stable risk model. The machine learning algorithms contained random survival forest (RSF), elastic network (Enet), Lasso, Ridge, stepwise Cox, CoxBoost, partial least squares regression for Cox (plsRcox), supervised principal components (SuperPC), generalised boosted regression modelling (GBM), and survival support vector machine (survival-SVM). Results: There are two clusters present with distinct CAFs genes pattern. Compared to the low CafS group, the high CafS group was associated with significant immunosuppression, poor prognosis, and increased prospect of HPV negative. Patients with high CafS also underwent the abundant enrichment of carcinogenic signaling pathways such as angiogenesis, epithelial mesenchymal transition, and coagulation. The MDK and NAMPT ligand-receptor cellular crosstalk between the cancer associated fibroblasts and other cell clusters may mechanistically cause immune escape. Moreover, the random survival forest prognostic model that was developed from 107 machine learning algorithm combinations could most accurately classify HNSCC patients. Conclusion: We revealed that CAFs would cause the activation of some carcinogenesis pathways such as angiogenesis, epithelial mesenchymal transition, and coagulation and revealed unique possibilities to target glycolysis pathways to enhance CAFs targeted therapy. We developed an unprecedentedly stable and powerful risk score for assessing the prognosis. Our study contributes to the understanding of the CAFs microenvironment complexity in patients with head and neck squamous cell carcinoma and serves as a basis for future in-depth CAFs gene clinical exploration.

Keywords: HNSCC; cancer-associated fibroblasts (CAFs); machine learning; prognosis; the tumor microenvironment.


Conflict of interest statement

The authors declare that the research was conducted in the absence of any commercial or financial relationships that could be construed as a potential conflict of interest.

Figures

FIGURE 1
FIGURE 1
Workflow. The workflow of HNSCC cancer-associated fibroblasts signature analysis.
FIGURE 2
FIGURE 2
Enrichment analysis in 31 CAFs genes (A) MF function analysis for 31 CAFs genes. (B) BP function analysis for 31 CAFs genes. (C) CC function analysis for 31 CAFs genes. (D) KEGG pathway analysis for 31 CAFs genes.
FIGURE 3
FIGURE 3
Clustering analysis identified two CAFs patterns. (A) Principal component analysis (PCA) showed the gene expression profile in the combined cohort, before elimination of the batch effects. (B) Principal component analysis (PCA) showed the gene expression profile in the combined cohort after elimination of the batch effects. (C) The heatmap displays the differential expression between the two groups of the 31 cancer associated fibroblasts (CAFs) genes, C1 cluster, C2 cluster, “1” means dead, “0” means alive, “fustat” means survival status. (D) The Kaplan-Meier plot displays significant differences survival rate among the two kinds of CAFs phenotypes in the Combined cohorts. C1 was worse than C2 (log rank p = 0.018), unit of Time (years). (E) The heatmap displays the differential expression between the two groups of the 31 cancer associated fibroblasts (CAFs) genes in the external cohort GSE42743. (F) The Kaplan-Meier plot displays the same trend of significant differences survival rate among the two kinds of CAFs phenotypes in the external cohort GSE42743 (log rank p = 0.034).
FIGURE 4
FIGURE 4
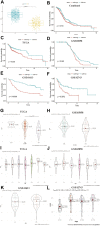
Construct a score system named CafS to evaluate 31 CAFs genes expression and classify HNSCC clinical characteristics (A) CafS in the groups of C1 and C2; combined database; p < 2.2e-16. (B–F) The Kaplan-Meier plot displays significant differences of survival time among the high-CafS and low-CafS groups in the Combined, TCGA, GSE65858, GSE41613, and GSE42743 cohort, respectively. High group was worse than low group, log rank p = 0.013, 0.036, 0.049, 0.00028, 0.0072. (G) CafS in TCGA cohort among the group of HPV positive and HPV negative, p = 6e-10. (H) CafS in GSE65858 cohort among the group of HPV positive and HPV negative, p = 0.002. (I–L) CafS in TCGA, GSE65858, GSE41613, and external cohort GSE42743; among the group of stages; respectively, (p = 0.101, 0.194, 0.451, 0.483).
FIGURE 5
FIGURE 5
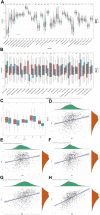
CafS changes the tumor immune microenvironment and is related to tumor associated macrophage (TAM) (A) Enrichment of 28 immune cell types infiltrating in the groups of CafS; combined database; the asterisk represents the different p values (* <0.05; ** <0.01; *** <0.001, **** <0.0001). (B) Boxplot of 24 immune cell types infiltrating by CIBERSORT algorithm in the groups of CafS; combined database; the asterisk represents the different p values (* <0.05; ** <0.01; *** <0.001, **** <0.0001). (C) Five genes’ expression of tumor associated macrophage (TAM) in the groups of CafS; the asterisk represents the different p values (* <0.05; ** <0.01; *** <0.001, **** <0.0001). (DH) Correlation between CafS and CCL2, CLEC7A, CSF1, CSF1R and PDGFB (CafS and CCL2: r = 0.28, p = 1.44e-16; CafS and CLEC7A: r = 0.19, p = 1.69e-08; CafS and CSF1: r = 0.28, p = 4.14e-17; CafS and CSF1R: r = 0.33, p = 3.1e-23; CafS and PDGFB: r = 0.61, p = 1.28e-88).
FIGURE 6
FIGURE 6
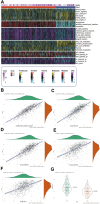
CafS changes hallmark signaling pathway and promotes the ability of tumor invasion (A) Complex-heatmap display the landscape in the combined cohort; the panel display the expression of hallmark signaling pathway involved in different CafS group; Proliferation, Invasion, Immune, Metabolism, Mutation and DNA represented six different pathway modules which arrange from the top down in complex-heatmap and they are labeled at the bottom of it; C1 represented high Cafs group and C2 represented low Cafs group; “fustat” means survival status, “1” means dead, “0” means alive. (BF) Correlation between CafS and EMT, coagulation, angiogenesis, hypoxia, and uv-response-down pathway (CafS and EMT: r = 0.87, p = 1.77e-268; CafS and Coagulation: r = 0.82, p = 7.12e-209; CafS and Angiogenesis: r = 0.82, p = 3.19e-215; CafS and Hypoxia: r = 0.53, p = 1.09e-63; CafS and Uv-response-down: r = 0.60, p = 1.24e-86). (G) StromalScore in the groups of CafS; combined database; p = 1.61e-36.
FIGURE 7
FIGURE 7
Verification of CafS clinical characteristic and biological function in single-cell RNA sequencing database (A) UMAP plot of selected 10244 single cells in tumor and non-immune stromal cells (CD45 negative). Different colors represent different cell types. (B) UMAP plot showed the expression of endothelial cell and cancer associated fibroblasts cell. (C) UAMP plot of selected 10244 single cells in tumor and non-immune stromal cells (CD45 negative). 18 cell clusters were divided into 12 cell types. (D) The Kaplan-Meier plot displays significant differences of survival time among the high-CAFs proportion and low-CAFs proportion in TCGA cohorts. Deconvolution method. High proportion group had worse overall time than low. (E) Display of the landscape of signaling pathways in different cell clusters; the panel display the hallmark signaling pathway involved in different cell clusters; Cluster (red module represent CAFs cell type), p-value and Direction of up or down are labeled at the right of plot; RRA represent significance. (F) Display of the landscape of gene set up-regulation or down-regulation in different cell clusters; Cluster (red module represent CAFs gene set), Method and Significance are labeled at the right of plot. (G) The differential cell–cell cellular communication shows CAFs weight coefficient between all cell types. (H) The heatmap of cell–cell cellular communication shows the counts of CAFs between all cell types. (I) Communication network of the significant ligand-receptor pairs between CAFs and other cell types, which contribute to the signaling from CAFs to Naive B cell, Endothelial Cell, Epithelial cell, Monocyte cell, NK cell, CD4+ T cell and Tissue stem cell subpopulations. Dot color reflects communication probabilities and dot size represents computed p-values. Empty space means the communication probability is zero. p-values are computed from one-sided permutation test. (J) SDC1, SDC2, NCL, LRP1 in the groups of Combined cohorts; p = 2.47e-06; p = 1.03e-22; p = 0.002; p = 5e-12. (K) ITGA5 and ITGB1 in the groups of combined cohorts; p = 2.88e-85; p = 2.78e-45.
FIGURE 8
FIGURE 8
Construction and verification to the CAFs risk prediction model using machine learning methods (A) LASSO coefficient profiles of 31 cancer associated fibroblasts marker genes in Combined cohort. (B) 1000‐time cross‐validation for tuning parameter selection in the LASSO model; Combined cohort. (C) A total of 107 kinds of prediction models via machine learning and further calculated the C-index of each model across training and all validation cohorts. (DH) Kaplan–Meier curves of overall survival according to the median risk score in Combined, TCGA-HNSC, GSE41613, GSE65858, and GSE42743 external validation cohorts. All log-rank p < 0.0001. (IM) Time-ROC value in Combined, TCGA-HNSC, GSE41613, GSE65858, and GSE42743 external validation cohorts. (I) Combined, AUC one-three-five years = 0.93, 0.99, 0.97. (J) TCGA-HNSC, AUC one-three-five years = 0.97, 0.98, 0.96. (K) GSE41613, AUC one-three-five years = 0.96, 0.97, 0.94. (L) GSE65858, AUC one-three years = 0.98. (M) GSE42743, AUC one-three-five years = 0.95, 0.91, 0.96. (NR) Multivariate Cox regression of risk score regarding to OS in the Combined, TCGA-HNSC, GSE41613, GSE65858 and GSE42743. Statistic tests: two-sided Wald test. Data are presented as hazard ratio (HR) ± 95% confidence interval [CI].
FIGURE 9
FIGURE 9
Relationship between CafS classification pattern and CAFs risk score model (A, B) The correlation between CafS and risk score in the combined and external cohort GSE42743; Combined, r = 0.14, p = 3.1e-05; GSE42743, r = 0.5, p = 7e-06. (CF) CafS in the high and low risk groups in the combined, TCGA-HNSC, GSE41613 and GSE42743 cohort p = 0.025, 0.012, 2.57e-06, 0.007, respectively. (GJ) Kaplan–Meier curves of overall survival according to the median of ENO1 and PGAM1 expression in the Combined and GSE42743 external validation cohorts. Combined, ENO1 and PGAM1, log-rank p = 0.015, 0.035, respectively. GSE42743, ENO1 and PGAM1, log-rank p = 0.0063, 0.015, respectively. (KN) ENO1, PGAM1, HK2, PFKP, BPGM, PGK1 and CafS expression in the CafS classification model and risk score model; Combined and external GSE42743 cohorts; the asterisk represents the different p values (* <0.05; ** <0.01; *** <0.001, **** <0.0001). (OR) Immunohistochemical of PGMA1 and ENO1 in the matched tumor and normal side.

Similar articles

Cited by

References

    1. Ang K. K., Harris J., Wheeler R., Weber R., Rosenthal D. I., Nguyen-Tân P. F., et al. (2010). Human papillomavirus and survival of patients with oropharyngeal cancer. N. Engl. J. Med. 363 (1), 24–35. 10.1056/NEJMoa0912217 - DOI - PMC - PubMed
    1. Bindea G., Mlecnik B., Tosolini M., Kirilovsky A., Waldner M., Obenauf A. C., et al. (2013). Spatiotemporal dynamics of intratumoral immune cells reveal the immune landscape in human cancer. Immunity 39 (4), 782–795. 10.1016/j.immuni.2013.10.003 - DOI - PubMed
    1. Bray F., Ferlay J., Soerjomataram I., Siegel R. L., Torre L. A., Jemal A. (2018). Global cancer statistics 2018: GLOBOCAN estimates of incidence and mortality worldwide for 36 cancers in 185 countries. CA Cancer J. Clin. 68 (6), 394–424. 10.3322/caac.21492 - DOI - PubMed
    1. Buchheit C. L., Weigel K. J., Schafer Z. T. (2014). Cancer cell survival during detachment from the ECM: Multiple barriers to tumour progression. Nat. Rev. Cancer 14 (9), 632–641. 10.1038/nrc3789 - DOI - PubMed
    1. Butler A., Hoffman P., Smibert P., Papalexi E., Satija R. (2018). Integrating single-cell transcriptomic data across different conditions, technologies, and species. Nat. Biotechnol. 36 (5), 411–420. 10.1038/nbt.4096 - DOI - PMC - PubMed