

ADCY9 functions as a novel cancer suppressor gene in lung adenocarcinoma
- PMID: 37065546
- PMCID: PMC10089850
- DOI: 10.21037/jtd-22-1027
ADCY9 functions as a novel cancer suppressor gene in lung adenocarcinoma
Abstract
Background: The process of lucubrating into lung adenocarcinoma (LUAD) is of profound clinical and practical significance in improving the prognosis of LUAD patients. Multiple biomarkers are reportedly involved in the proliferation or metastasis of adenocarcinoma. However, whether the ADCY9 gene influences the development of LUAD remains unknown. Therefore, we aimed to elucidate the relationship between the expression of ADCY9 and the proliferation and migration of LUAD.
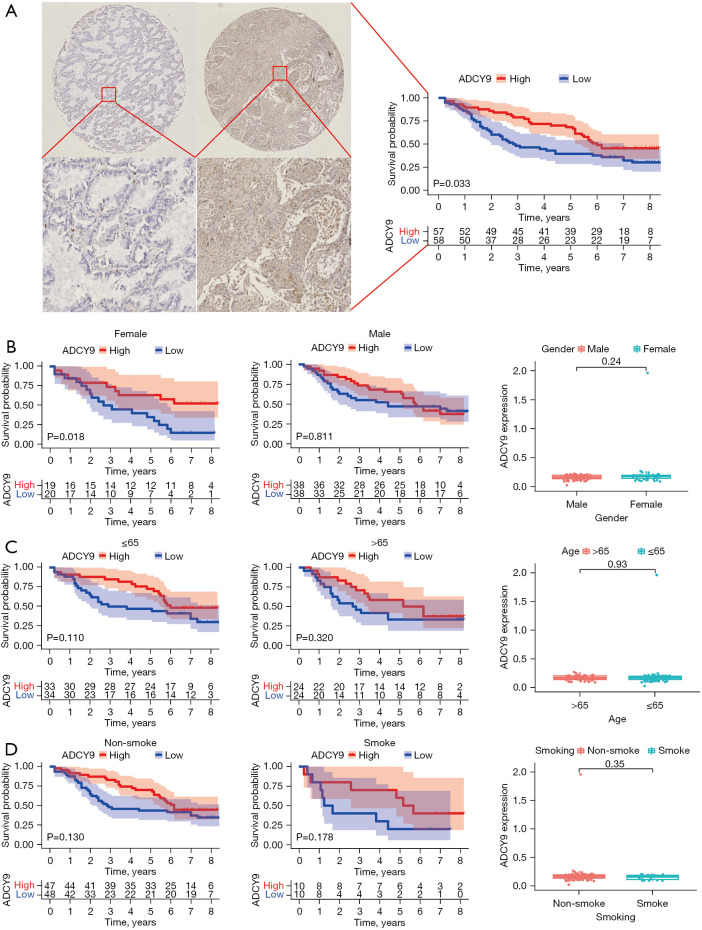
Methods: The ADCY9 gene was filtered via a survival analysis of LUAD acquired from the Gene Expression Omnibus (GEO). Then, we conducted a validation analysis and ADCY9-microRNA, microRNA-lncRNA, and ADCY9-lncRNA targeting relationship analysis through the data obtained from The Cancer Genome Atlas (TCGA) dataset. The survival curve, correlation, and prognostic analysis were implemented through bioinformatics methods. Both protein and mRNA expression levels of LUAD cell lines and LUAD patient samples (80 pairs) were detected using western blot assays and quantitative real-time polymerase chain reaction (qRT-PCR). An immunohistochemistry assay was performed to display the correlation between the expression level of the ADCY9 gene and prognosis in LUAD patients (2012-2013; n=115). Overexpression of cell lines SPCA1 and A549 were used for a series of cell function assays.
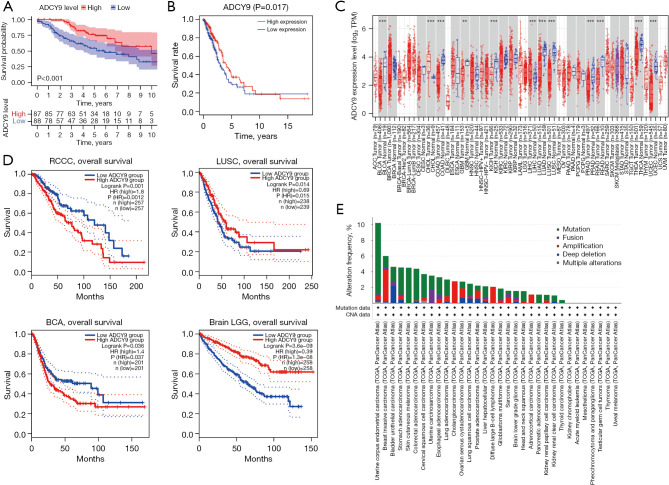
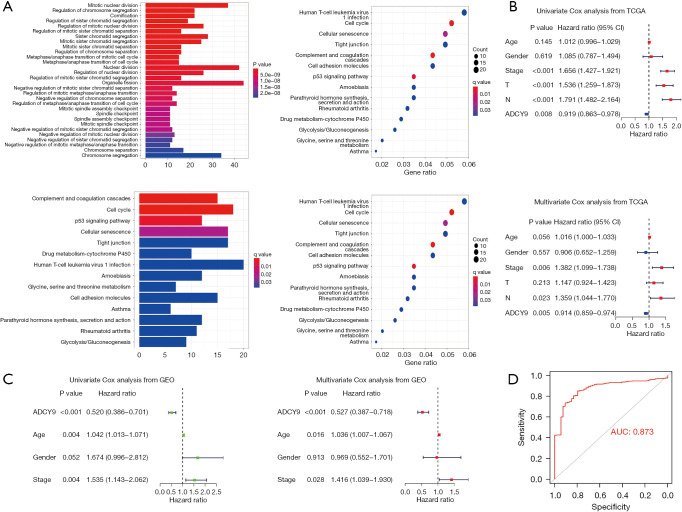
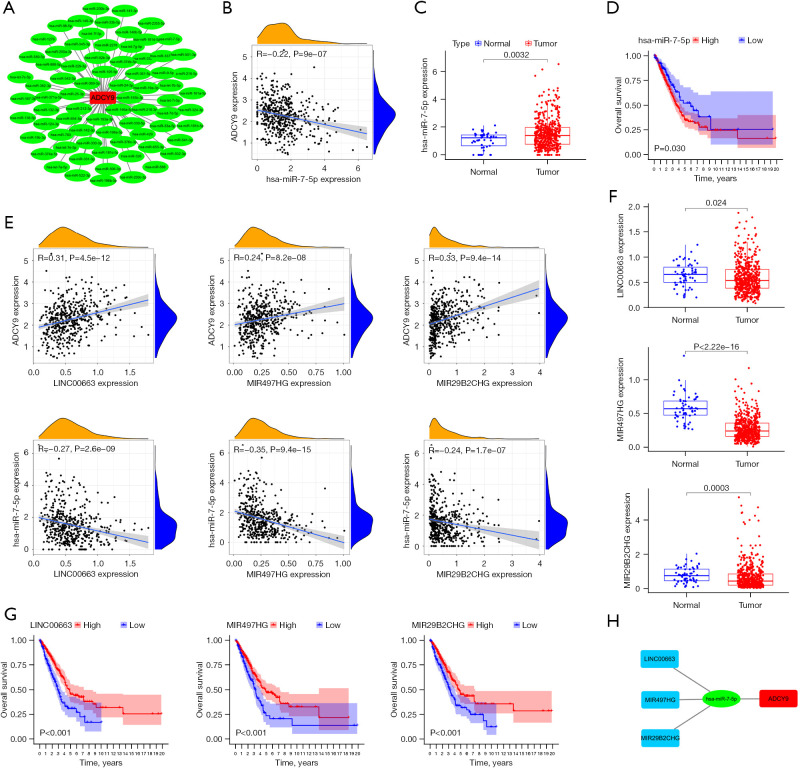
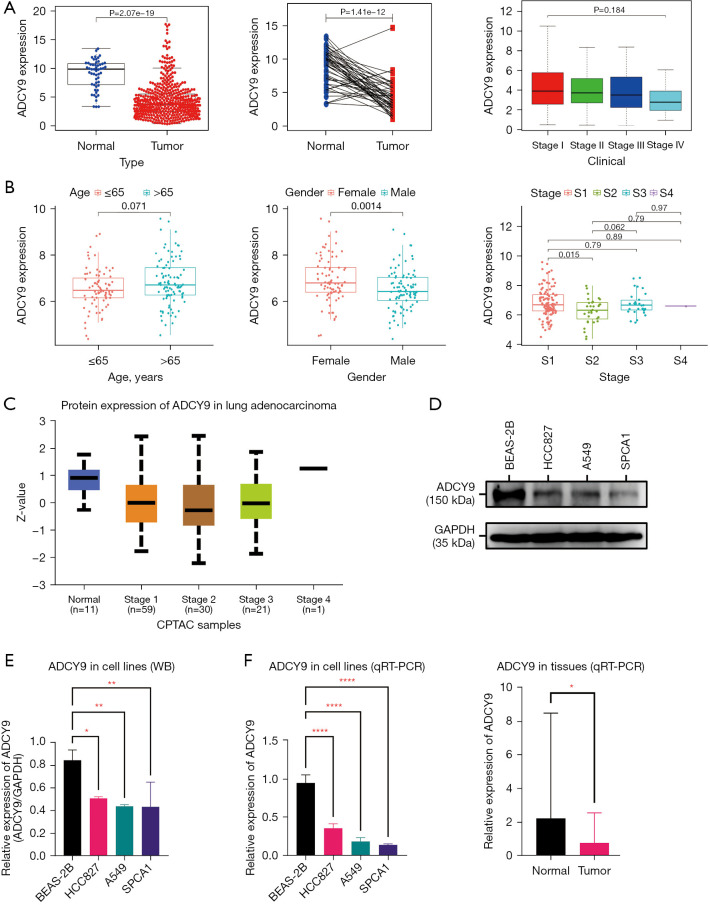
Results: Compared with the expression level in adjacent normal tissues, ADCY9 expression was downregulated in LUAD tissues. Based on the result of the survival curve analysis, high expression of ADCY9 may lead to a better prognosis and may be seen as an independent predictor for LUAD patients. High expression of ADCY9-related microRNA hsa-miR-7-5p may lead to a worse prognosis, and high expression of hsa-miR-7-5p-related lncRNAs may lead to the opposite effects. Overexpression of ADCY9 restrained the proliferation, invasion, and migration abilities of SPCA1, A549 cells.
Conclusions: Results indicate that the ADCY9 gene acts as a tumor suppressor to restrain the proliferation, migration, and invasion in LUAD and can lead to a better survival or prognosis in LUAD patients.
Keywords: ADCY9 gene; lung adenocarcinoma (LUAD); tumor migration and invasion.
2023 Journal of Thoracic Disease. All rights reserved.
Conflict of interest statement
Conflicts of Interest: All authors have completed the ICMJE uniform disclosure form (available at https://jtd.amegroups.com/article/view/10.21037/jtd-22-1027/coif). The authors have no conflicts of interest to declare.
Figures


Similar articles
-
circ_0000567/miR-421/TMEM100 Axis Promotes the Migration and Invasion of Lung Adenocarcinoma and Is Associated with Prognosis.J Cancer. 2022 Feb 28;13(5):1540-1552. doi: 10.7150/jca.60124. eCollection 2022. J Cancer. 2022. PMID: 35371319 Free PMC article.
-
SPTBN2, a New Biomarker of Lung Adenocarcinoma.Front Oncol. 2021 Oct 20;11:754290. doi: 10.3389/fonc.2021.754290. eCollection 2021. Front Oncol. 2021. PMID: 34745988 Free PMC article.
-
Identification of a novel prognosis-associated ceRNA network in lung adenocarcinoma via bioinformatics analysis.Biomed Eng Online. 2021 Nov 24;20(1):117. doi: 10.1186/s12938-021-00952-x. Biomed Eng Online. 2021. PMID: 34819106 Free PMC article.
-
LncRNA LINC00511 promotes COL1A1-mediated proliferation and metastasis by sponging miR-126-5p/miR-218-5p in lung adenocarcinoma.BMC Pulm Med. 2022 Jul 16;22(1):272. doi: 10.1186/s12890-022-02070-3. BMC Pulm Med. 2022. PMID: 35842617 Free PMC article.
-
Identify miRNA-mRNA regulation pairs to explore potential pathogenesis of lung adenocarcinoma.Aging (Albany NY). 2022 Oct 19;14(20):8357-8373. doi: 10.18632/aging.204341. Epub 2022 Oct 19. Aging (Albany NY). 2022. PMID: 36260870 Free PMC article.
Cited by
-
Epigenetic mechanisms underlying endometrial cancer outcomes: race-specific patterns of DNA methylation associated with molecular subtypes and survival.Carcinogenesis. 2025 Jan 20;46(1):bgaf004. doi: 10.1093/carcin/bgaf004. Carcinogenesis. 2025. PMID: 39873457
-
Stage-specific gene pair ratios highlight genes and mechanisms related to presymptomatic and symptomatic Multiple Myeloma.Comput Struct Biotechnol J. 2025 Jul 12;27:3090-3098. doi: 10.1016/j.csbj.2025.07.017. eCollection 2025. Comput Struct Biotechnol J. 2025. PMID: 40703094 Free PMC article.
-
Melanoma-specific mutation hotspots in distal, non-coding, promoter-interacting regions implicate novel candidate driver genes.Br J Cancer. 2024 Nov;131(10):1644-1655. doi: 10.1038/s41416-024-02870-w. Epub 2024 Oct 4. Br J Cancer. 2024. PMID: 39367275 Free PMC article.
-
Adenylate cyclase 9 expression level is associated with hormone receptor-positive breast cancer and predicts patient prognosis.Nagoya J Med Sci. 2024 Nov;86(4):665-682. doi: 10.18999/nagjms.86.4.665. Nagoya J Med Sci. 2024. PMID: 39780930 Free PMC article.
-
Genomic Fabrics of the Excretory System's Functional Pathways Remodeled in Clear Cell Renal Cell Carcinoma.Curr Issues Mol Biol. 2023 Nov 24;45(12):9471-9499. doi: 10.3390/cimb45120594. Curr Issues Mol Biol. 2023. PMID: 38132440 Free PMC article.
References
LinkOut - more resources
Full Text Sources
Miscellaneous