

Integrating single-cell and bulk RNA sequencing to develop a cancer-associated fibroblast-related signature for immune infiltration prediction and prognosis in lung adenocarcinoma
- PMID: 37065583
- PMCID: PMC10089835
- DOI: 10.21037/jtd-23-238
Integrating single-cell and bulk RNA sequencing to develop a cancer-associated fibroblast-related signature for immune infiltration prediction and prognosis in lung adenocarcinoma
Abstract
Background: An accumulating amount of studies are highlighting the impacts of cancer-associated fibroblasts (CAFs) on the initiation, metastasis, invasion, and immune evasion of lung cancer. However, it is still unclear how to tailor treatment regimens based on the transcriptomic characteristics of CAFs in the tumor microenvironment of patients with lung cancer.
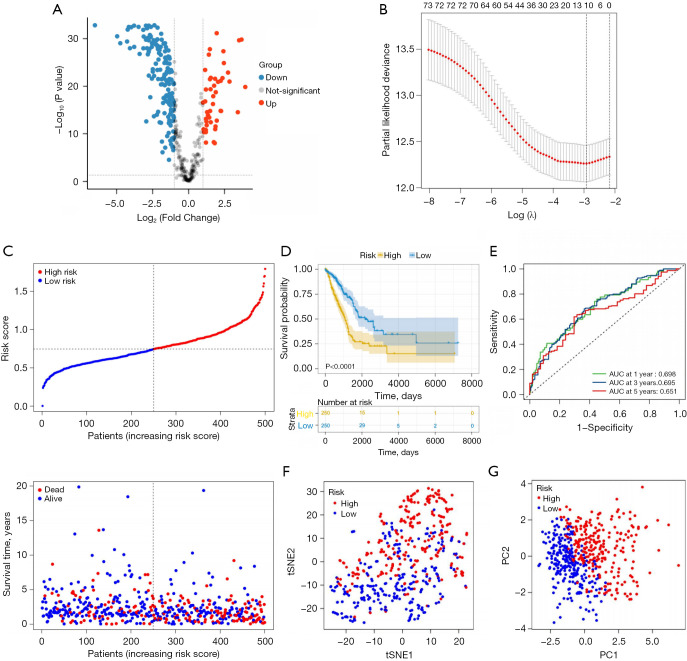
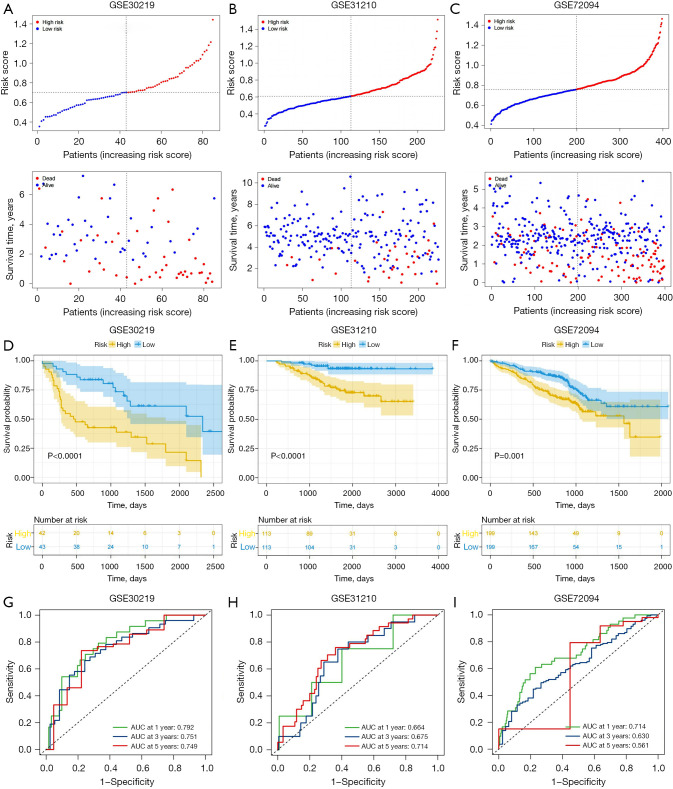
Methods: Our study examined single-cell RNA-sequencing data from the Gene Expression Omnibus (GEO) database to identify expression profiles for CAF marker genes and constructed a prognostic signature of lung adenocarcinoma using these genes in The Cancer Genome Atlas (TCGA) database. The signature was validated in 3 independent GEO cohorts. Univariate and multivariate analyses were used to confirm the clinical significance of the signature. Next, multiple differential gene enrichment analysis methods were used to explore the biological pathways related to the signature. Six algorithms were used to assess the relative proportion of infiltrating immune cells, and the relationship between the signature and immunotherapy response of lung adenocarcinoma (LUAD) was explored based on the tumor immune dysfunction and exclusion (TIDE) algorithm.
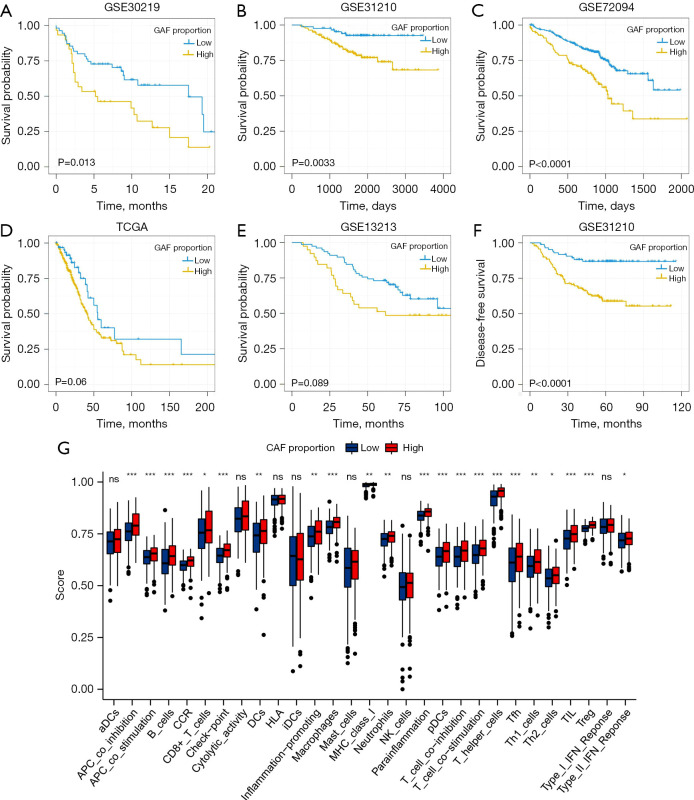
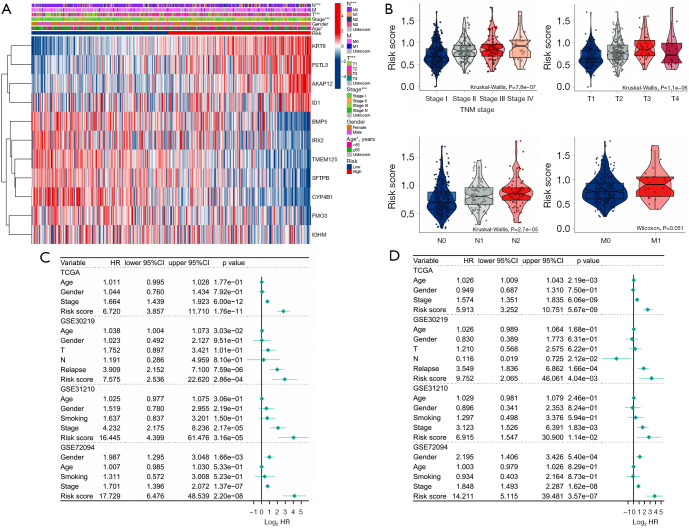
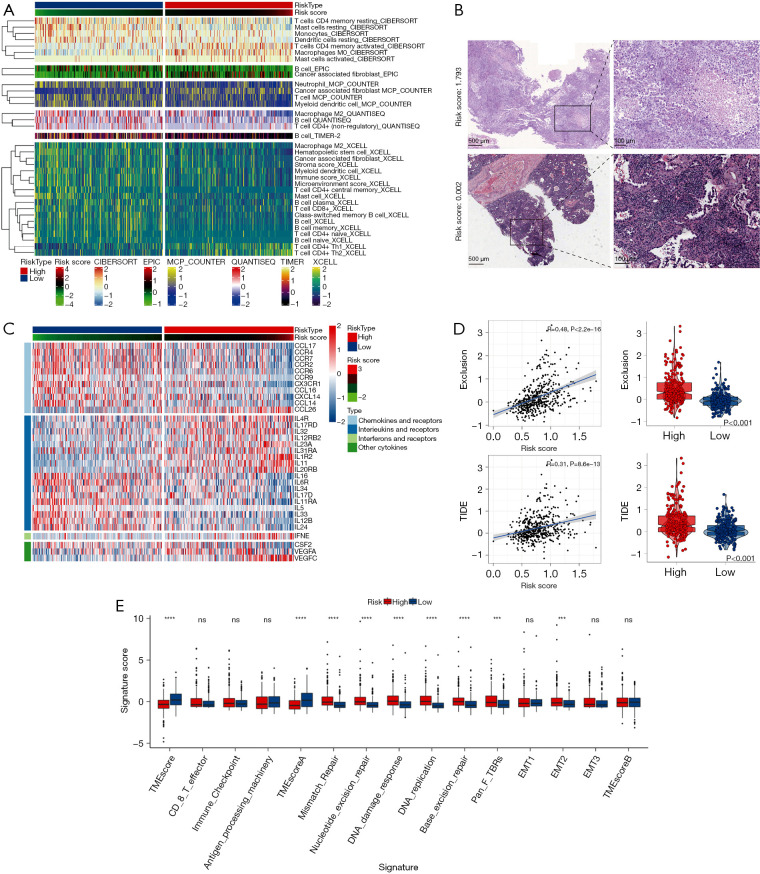
Results: The signature related to CAFs in this study showed good accuracy and predictive capacity. In all clinical subgroups, the high-risk patients had a poor prognosis. The univariate and multivariate analyses confirmed that the signature was an independent prognostic marker. Moreover, the signature was closely associated with particular biological pathways related to cell cycle, DNA replication, carcinogenesis, and immune response. The 6 algorithms used to assess the relative proportion of infiltrating immune cells indicated that a lower infiltration of immune cells in the tumor microenvironment was associated with high-risk scores. Importantly, we found a negative correlation between TIDE, exclusion score, and risk score.
Conclusions: Our study constructed a prognostic signature based on CAF marker genes useful for prognosis and immune infiltration estimation of lung adenocarcinoma. This tool could enhance therapy efficacy and allow individualized treatments.
Keywords: Single-cell RNA-sequencing; cancer-associated fibroblasts (CAFs); immune infiltration; lung adenocarcinoma (LUAD); prognostic signature.
2023 Journal of Thoracic Disease. All rights reserved.
Conflict of interest statement
Conflicts of Interest: All authors have completed the ICMJE uniform disclosure form (available at https://jtd.amegroups.com/article/view/10.21037/jtd-23-238/coif). The authors have no conflicts of interest to declare.
Figures


Similar articles
-
Integrating single-cell and bulk RNA sequencing data unveils antigen presentation and process-related CAFS and establishes a predictive signature in prostate cancer.J Transl Med. 2024 Jan 14;22(1):57. doi: 10.1186/s12967-023-04807-y. J Transl Med. 2024. PMID: 38221616 Free PMC article.
-
RNA-seq and bulk RNA-seq data analysis of cancer-related fibroblasts (CAF) in LUAD to construct a CAF-based risk signature.Sci Rep. 2024 Oct 6;14(1):23243. doi: 10.1038/s41598-024-74336-1. Sci Rep. 2024. PMID: 39369095 Free PMC article.
-
Prognosis and immunotherapy significances of a cancer-associated fibroblasts-related gene signature in lung adenocarcinoma.Cell Mol Biol (Noisy-le-grand). 2023 Dec 20;69(14):51-61. doi: 10.14715/cmb/2023.69.14.9. Cell Mol Biol (Noisy-le-grand). 2023. PMID: 38279482
-
Integrated analysis of single-cell and bulk RNA-sequencing identifies a signature based on B cell marker genes to predict prognosis and immunotherapy response in lung adenocarcinoma.Cancer Immunol Immunother. 2022 Oct;71(10):2341-2354. doi: 10.1007/s00262-022-03143-2. Epub 2022 Feb 13. Cancer Immunol Immunother. 2022. PMID: 35152302 Free PMC article.
-
Identification and verification of eight cancer-associated fibroblasts related genes as a prognostic signature for head and neck squamous cell carcinoma.Heliyon. 2023 Feb 28;9(3):e14003. doi: 10.1016/j.heliyon.2023.e14003. eCollection 2023 Mar. Heliyon. 2023. PMID: 36938461 Free PMC article.
Cited by
-
Correlation between chromatin epigenetic-related lncRNA signature (CELncSig) and prognosis, immune microenvironment, and immunotherapy in non-small cell lung cancer.PLoS One. 2023 May 24;18(5):e0286122. doi: 10.1371/journal.pone.0286122. eCollection 2023. PLoS One. 2023. PMID: 37224123 Free PMC article.
-
Development of a CD8+ T cell associated signature for predicting the prognosis and immunological characteristics of gastric cancer by integrating single-cell and bulk RNA-sequencing.Sci Rep. 2024 Feb 24;14(1):4524. doi: 10.1038/s41598-024-54273-9. Sci Rep. 2024. PMID: 38402299 Free PMC article.
-
Single-cell data analysis of malignant epithelial cell heterogeneity in lung adenocarcinoma for patient classification and prognosis prediction.Heliyon. 2023 Sep 18;9(9):e20164. doi: 10.1016/j.heliyon.2023.e20164. eCollection 2023 Sep. Heliyon. 2023. PMID: 37809682 Free PMC article.
References
-
- Bejarano L, Jordāo MJC, Joyce JA. Therapeutic Targeting of the Tumor Microenvironment. Cancer Discov 2021;11:933-59. 10.1158/2159-8290.CD-20-1808 - DOI - PubMed
LinkOut - more resources
Full Text Sources