

Augmentation of BMP Signaling in Cranial Neural Crest Cells Leads to Premature Cranial Sutures Fusion through Endochondral Ossification in Mice
- PMID: 37065628
- PMCID: PMC10097634
- DOI: 10.1002/jbm4.10716
Augmentation of BMP Signaling in Cranial Neural Crest Cells Leads to Premature Cranial Sutures Fusion through Endochondral Ossification in Mice
Abstract
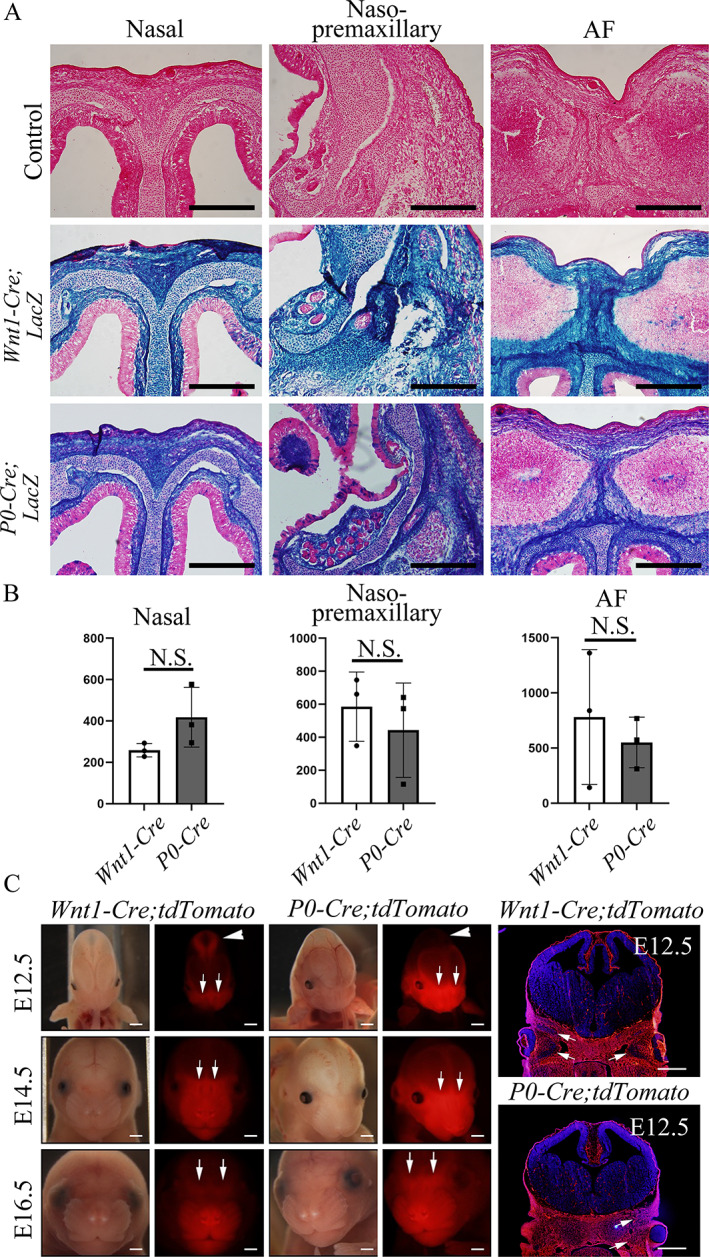
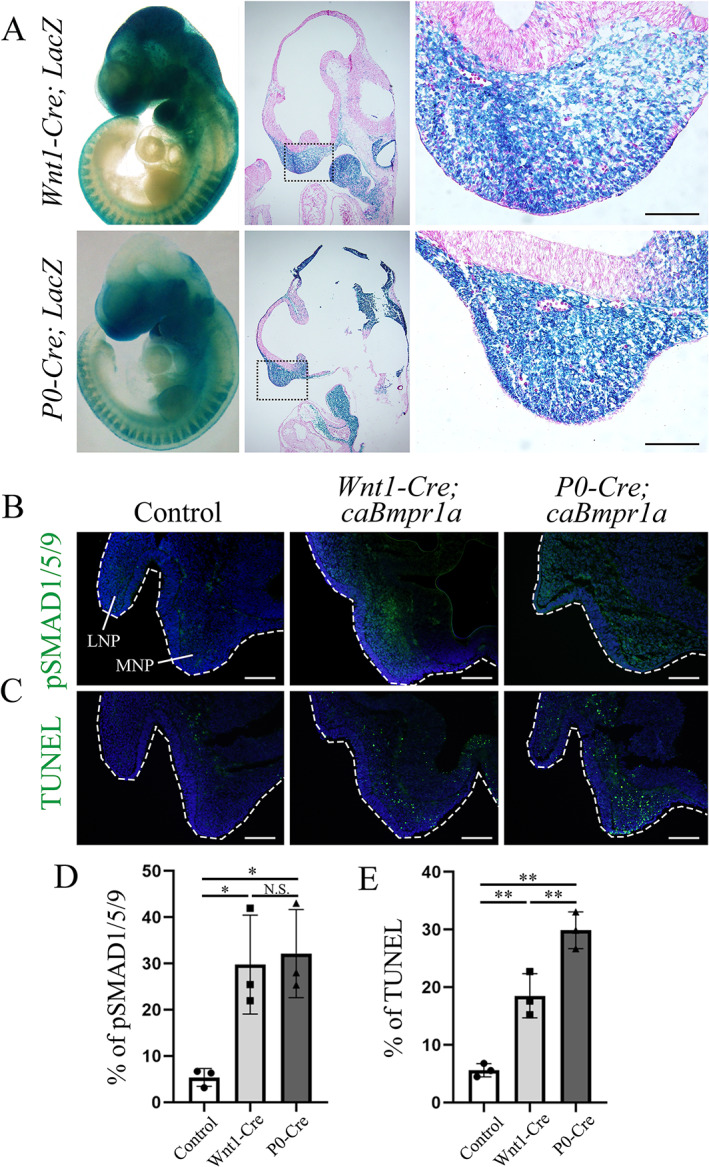
Craniosynostosis is a congenital anomaly characterized by the premature fusion of cranial sutures. Sutures are a critical connective tissue that regulates bone growth; their aberrant fusion results in abnormal shapes of the head and face. The molecular and cellular mechanisms have been investigated for a long time, but knowledge gaps remain between genetic mutations and mechanisms of pathogenesis for craniosynostosis. We previously demonstrated that the augmentation of bone morphogenetic protein (BMP) signaling through constitutively active BMP type 1A receptor (caBmpr1a) in neural crest cells (NCCs) caused the development of premature fusion of the anterior frontal suture, leading to craniosynostosis in mice. In this study, we demonstrated that ectopic cartilage forms in sutures prior to premature fusion in caBmpr1a mice. The ectopic cartilage is subsequently replaced by bone nodules leading to premature fusion with similar but unique fusion patterns between two neural crest-specific transgenic Cre mouse lines, P0-Cre and Wnt1-Cre mice, which coincides with patterns of premature fusion in each line. Histologic and molecular analyses suggest that endochondral ossification in the affected sutures. Both in vitro and in vivo observations suggest a greater chondrogenic capacity and reduced osteogenic capability of neural crest progenitor cells in mutant lines. These results suggest that the augmentation of BMP signaling alters the cell fate of cranial NCCs toward a chondrogenic lineage to prompt endochondral ossification to prematurely fuse cranial sutures. By comparing P0-Cre;caBmpr1a and Wnt1-Cre;caBmpr1a mice at the stage of neural crest formation, we found more cell death of cranial NCCs in P0-Cre;caBmpr1a than Wnt1-Cre;caBmpr1a mice at the developing facial primordia. These findings may provide a platform for understanding why mutations of broadly expressed genes result in the premature fusion of limited sutures. © 2022 The Authors. JBMR Plus published by Wiley Periodicals LLC on behalf of American Society for Bone and Mineral Research.
Keywords: BMP SIGNALING; CELL FATE; CRANIOSYNOSTOSIS; P0‐Cre; Wnt1‐Cre.
© 2022 The Authors. JBMR Plus published by Wiley Periodicals LLC on behalf of American Society for Bone and Mineral Research.
Conflict of interest statement
All authors state that they have no conflict of interest. The authors declared no potential conflicts of interest with respect to the research, authorship, and/or publication of this article.
Figures


Similar articles
-
Augmentation of bone morphogenetic protein signaling in cranial neural crest cells in mice deforms skull base due to premature fusion of intersphenoidal synchondrosis.Genesis. 2023 Mar;61(1-2):e23509. doi: 10.1002/dvg.23509. Epub 2023 Jan 9. Genesis. 2023. PMID: 36622051 Free PMC article.
-
Augmentation of Smad-dependent BMP signaling in neural crest cells causes craniosynostosis in mice.J Bone Miner Res. 2013 Jun;28(6):1422-33. doi: 10.1002/jbmr.1857. J Bone Miner Res. 2013. PMID: 23281127 Free PMC article.
-
Rapamycin rescues BMP mediated midline craniosynostosis phenotype through reduction of mTOR signaling in a mouse model.Genesis. 2018 Jun;56(6-7):e23220. doi: 10.1002/dvg.23220. Genesis. 2018. PMID: 30134066 Free PMC article.
-
Cranial Neural Crest Cells and Their Role in the Pathogenesis of Craniofacial Anomalies and Coronal Craniosynostosis.J Dev Biol. 2020 Sep 9;8(3):18. doi: 10.3390/jdb8030018. J Dev Biol. 2020. PMID: 32916911 Free PMC article. Review.
-
BMP signaling during craniofacial development: new insights into pathological mechanisms leading to craniofacial anomalies.Front Physiol. 2023 May 18;14:1170511. doi: 10.3389/fphys.2023.1170511. eCollection 2023. Front Physiol. 2023. PMID: 37275223 Free PMC article. Review.
Cited by
-
Timing and Graded BMP Signalling Determines Fate of Neural Crest and Ectodermal Placode Derivatives from Pluripotent Stem Cells.Biomedicines. 2024 Oct 4;12(10):2262. doi: 10.3390/biomedicines12102262. Biomedicines. 2024. PMID: 39457575 Free PMC article. Review.
-
Polarity and migration of cranial and cardiac neural crest cells: underlying molecular mechanisms and disease implications.Front Cell Dev Biol. 2025 Jan 6;12:1457506. doi: 10.3389/fcell.2024.1457506. eCollection 2024. Front Cell Dev Biol. 2025. PMID: 39834387 Free PMC article. Review.
-
Transforming growth factor beta signaling and craniofacial development: modeling human diseases in zebrafish.Front Cell Dev Biol. 2024 Feb 7;12:1338070. doi: 10.3389/fcell.2024.1338070. eCollection 2024. Front Cell Dev Biol. 2024. PMID: 38385025 Free PMC article. Review.
-
Augmented Bone Morphogenetic Protein Signaling During TMJ Development Alters Morphology in a Timepoint-Dependent Manner.Int J Mol Sci. 2025 Feb 15;26(4):1655. doi: 10.3390/ijms26041655. Int J Mol Sci. 2025. PMID: 40004119 Free PMC article.
-
The tectum transversum(TTR) maintains patency of the developing coronal suture.Res Sq [Preprint]. 2025 Aug 5:rs.3.rs-7216722. doi: 10.21203/rs.3.rs-7216722/v1. Res Sq. 2025. PMID: 40799753 Free PMC article. Preprint.
References
-
- Rice DP. Developmental anatomy of craniofacial sutures. Front Oral Biol. 2008;12:1‐21. - PubMed
-
- Rice DP, Rice R, Thesleff I. Molecular mechanisms in calvarial bone and suture development, and their relation to craniosynostosis. Eur J Orthod. 2003;25(2):139‐148. - PubMed
-
- Esparza J, Hinojosa J. Complications in the surgical treatment of craniosynostosis and craniofacial syndromes: apropos of 306 transcranial procedures. Childs Nerv Syst. 2008;24(12):1421‐1430. - PubMed
LinkOut - more resources
Full Text Sources